
9. Creating and Formatting Tables
A table is a grid of rows and columns that define cells at their intersections. Each cell is its own separate area, somewhat like a text box.
The most obvious use for a table is to organize multiple columns of data in tabular form, as in a spreadsheet. For example, in Figure 9.1, information about fish is displayed in a table. Some cells contain pictures; others contain text.
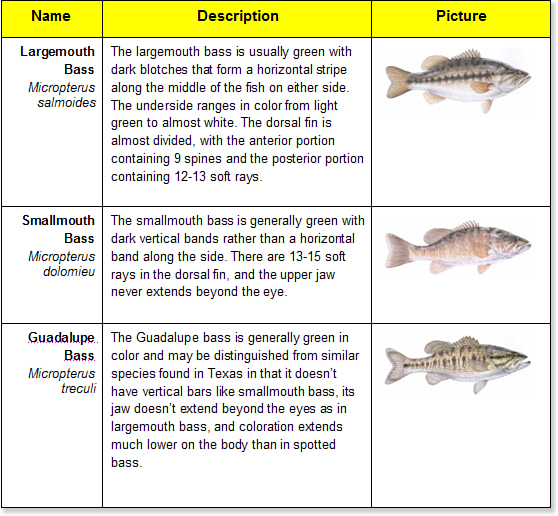
Figure 9.1. Tables are commonly used for organizing multicolumn data.
You can also use tables for page layout, a technique popular in web page design. In Figure 9.2, a table has been used to structure a newsletter layout, as an alternative to newspaper-style columns or text boxes. Word facilitates tabular layout by enabling you to merge and split certain cells, creating uneven numbers of rows and columns to accommodate nonstandard designs.

Figure 9.2. You can use tables to create multicolumn page layouts.
![]() To find out why using tables for layout can impede readability for someone with disabilities, see “Creating Accessible Word Documents,” p. 920.
To find out why using tables for layout can impede readability for someone with disabilities, see “Creating Accessible Word Documents,” p. 920.
Creating a Table
You can insert a table in a document in three ways: the Table menu, the Insert Table dialog box, and the Table Drawing tool. The following sections look at each of these methods.
Inserting a Table from the Table Menu
To access the Table menu, click the Table button on the Insert tab. The main feature of the Table menu is a grid of squares, as shown in Figure 9.3. Drag across the grid to select the number of rows and columns desired; when you release the mouse button, Word places a new table in the document with those specifications.
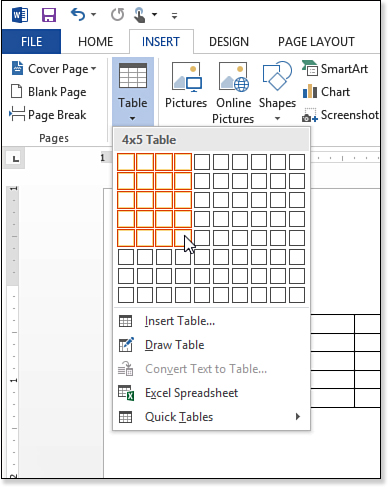
Figure 9.3. Create a table by dragging across the squares on the Table menu’s grid.
The tables inserted via this method have their cell widths set to Auto. The table itself occupies the full width of the page (between the margins), and the cells are equally sized to use that space. But, when you start typing text into a cell, the cell begins expanding to hold that text, and all the other cells decrease in size to pick up the slack.
If you want some other type of cell-sizing behavior, use the following method of table creation instead.
Inserting a Table via the Insert Table Dialog Box
The dialog box method of table creation takes longer, but it enables you to specify how you want the text and the cell width to interact. Three AutoFit settings are available:
• Fixed Column Width—This can be set to Auto, which starts with a fixed column width such that the table fills the width of the page but enables a column to enlarge based on the text you enter. It can alternatively be set to a specific value in inches (at increments as small as 1/100).
• AutoFit to Contents—This setting changes the cell widths so that whatever text you place in them fits on a single row. If a column contains nothing, it appears very narrow.
• AutoFit to Window—The table width changes depending on the size of the window in which it is being viewed. This setting is great for tables that will be displayed on web pages, because one never knows the size of the browser window a web page visitor will be using.
To use the dialog box method, follow these steps:
1. On the Insert tab, click Table and then choose Insert Table from the menu. The Insert Table dialog box opens (see Figure 9.4).

Figure 9.4. Use the Insert Table dialog box to create a new table.
2. Enter the number of rows and columns desired in their respective boxes.
3. Select an AutoFit behavior setting.
4. (Optional) Mark the Remember Dimensions for New Tables check box to preserve these settings.
5. Click OK to create the table.
Drawing a Table
Drawing a table is useful when you want unequal-sized rows and columns or a different number of rows in some columns than in others (or vice versa). This method turns your mouse pointer into a pencil, which you can use to create the table’s overall borders and individual row and column dividers.
To draw the table, follow these steps:
1. On the Insert tab, click Table and then choose Draw Table. The mouse pointer turns into a pencil.
2. Drag to draw a box representing the outer borders of the table. When you release the mouse button, the cursor remains a pencil.
![]() Note
Note
To draw additional lines later, click inside the table and then click the Draw Table button on the Table Tools Layout tab to reenter drawing mode.
3. Drag to draw the rows and columns within the box you just drew (see Figure 9.5).

Figure 9.5. Use the mouse pointer as a “pencil” to draw the table.
To draw row and column dividers, draw straight lines. To draw a table within a table, draw a rectangle within a cell.
4. (Optional) If you need to erase a line you drew, click Eraser on the Table Tools Layout tab and then click the line to erase. To go back to drawing mode, click Draw Table on the Table Tools Layout tab.
5. When you have finished drawing lines, press Esc or click the Draw Table button again to toggle drawing mode off.
![]() To find out why drawing a table with varying numbers of columns or rows can impede readability for someone with disabilities, see “Creating Accessible Word Documents,” p. 920.
To find out why drawing a table with varying numbers of columns or rows can impede readability for someone with disabilities, see “Creating Accessible Word Documents,” p. 920.
Entering Data in a Table
To type data into a cell, click in the cell and type. To move to the next cell, press Tab; to move to the previous cell, press Shift+Tab.
![]() Tip
Tip
The Tab key doesn’t work normally in a table cell because it’s used to move around in the table, but there’s a workaround. To create a tab character in a table cell, press Ctrl+Tab.
Depending on the AutoFit setting of the table, as you type text into a cell, one of two things will happen:
• The text will wrap to additional lines, and the cell will get taller.
• The cell will try to widen itself as much as possible, taking space away from other cells as it is able, before it starts wrapping to additional lines.
![]() To learn about column and row sizing, see “Sizing a Table,” p. 346.
To learn about column and row sizing, see “Sizing a Table,” p. 346.
Table 9.1 summarizes the keyboard shortcuts available for moving around in a table.
Table 9.1. Keyboard Shortcuts for Table Navigation

Editing a Table
Tables are flexible; you can add and remove rows and columns, merge and split cells, move pieces around, and more.
Selecting Cells
As in most areas of Word, before you can format or modify a cell (or something within a cell), you must select it.
When a cell is selected, the entire cell appears highlighted, even if it is empty. To select a cell, position the mouse pointer at the bottom-left corner of the cell so that the mouse pointer turns into a black diagonally pointing arrow, and then click (see Figure 9.6). Any formatting you apply when the entire cell is selected affects all the content within it.
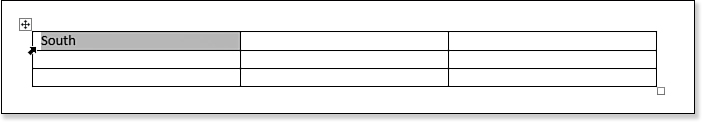
Figure 9.6. A selected cell.
There is also a keyboard method for selecting the entire cell: Position the insertion point at the end of any content within the cell and then press Shift+right arrow.
One other method for selecting a cell is found on the Table Tools Layout tab. Open the Select menu and choose Select Cell (see Figure 9.7).

Figure 9.7. The Select menu enables you to quickly select various portions of the table.
Holding down the Shift key and pressing an arrow key extends the selection area by one character or line in the arrow direction, so why is it that pressing Shift+right arrow at the end of a cell selects the entire cell?
It happens because of a hidden end-of-cell marker that appears at the end of each cell’s content. To see these markers, toggle on the Show/Hide (¶) feature on the Home tab (see Figure 9.8). When the insertion point is at the end of the cell content, and you extend the selection one character to the right, you select the end-of-cell marker, which in turn selects the entire cell.
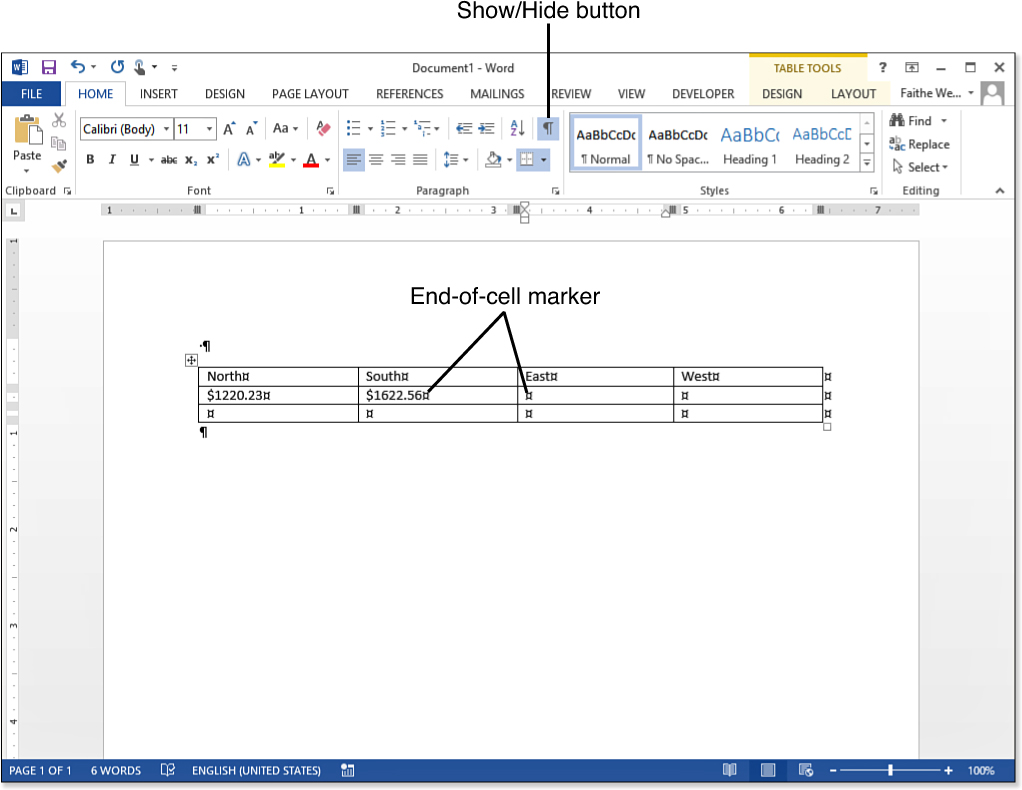
Figure 9.8. Nonprinting end-of-cell markers appear in each cell.
In contrast, when the content of the text is selected, only the content is highlighted; a portion of the cell background appears behind it in an unhighlighted state. You do not have to select all the content in the cell; this makes it possible to apply different formatting to certain characters or objects within the cell, but not others. To select text in a cell, drag across the text. To select a graphic or other object in a cell, click that object.
Dragging across cell content selects only the content, not the cell—until you drag to include more than one cell. When you drag across multiple cells, the cells themselves become selected.
To select noncontiguous cells, hold down the Ctrl key as you select each of the cells or ranges to include.
Selecting Rows, Columns, or Tables
To select a row (or multiple rows), do one of the following:
• Click anywhere in the row. On the Table Tools Layout tab, open the Select menu and choose Select Row.
• Drag across all the cells in the row, including the end-of-row marker to the far right of the row. This marker is another nonprinting character; it looks just like the end-of-cell markers (refer to Figure 9.8), but it is outside the rightmost cell in the row. Drag up or down to select additional rows.
• Position the mouse pointer to the left of the row so that the mouse pointer changes to a white arrow, and then click to select the entire row. Drag up or down to select additional rows (see Figure 9.9).

Figure 9.9. Select a row by clicking to its left or dragging across all its cells.
• Click in the first (leftmost) cell in the row and hold down the Shift key as you press the right-arrow key repeatedly until the entire row is selected. Press the up- or down-arrow key to select additional rows.
To select a column (or multiple columns), do one of these:
• Click anywhere in the column. On the Table Tools Layout tab, open the Select menu and choose Select Column.
• Drag across all the cells in the column. There is no end-of-column marker to worry about. Drag to the right or left to select additional columns.
• Position the mouse pointer above the column so that the mouse pointer changes to a black down-pointing arrow, and then click to select the entire column (see Figure 9.10). Drag right or left to select additional columns.

Figure 9.10. Select a column by clicking above it or dragging across its cells.
• Click in the first (topmost) cell in the column and hold down the Shift key as you press the down arrow repeatedly until the entire column is selected. Use the left- or right-arrow key to select additional columns.
To select the entire table, click the table selector icon, shown in Figure 9.10, or press Alt+5 (using the 5 on the numeric keypad with Num Lock turned off). As another alternative, you can open the Select menu on the Table Tools Layout tab and choose Select Table.
![]() Tip
Tip
Another way to select is by turning on the Extend Selection feature (Ctrl+Shift+F8). When it is on, you can then use the arrow keys to extend a selection in any direction. (You don’t have to hold down Shift with the arrows.) To turn off Extend Selection, press Esc.
Inserting Rows, Columns, or Cells
To insert a single row or column, position the mouse pointer near the border between the cells you want the new row or column to be inserted. A white line with a plus sign appears between them, as shown in Figure 9.11. Click the plus sign to add a new row or column. (This feature is new in Word 2013.)

Figure 9.11. Insert a row or column by clicking the plus sign.
You can insert rows and columns in many other ways, too. For example, you can right-click a cell within a row or column adjacent to where you want the insertion to appear, and then point to Insert and click the option that best describes what you want (see Figure 9.12). Buttons on the Table Tools Layout tab also enable you to insert rows and columns.
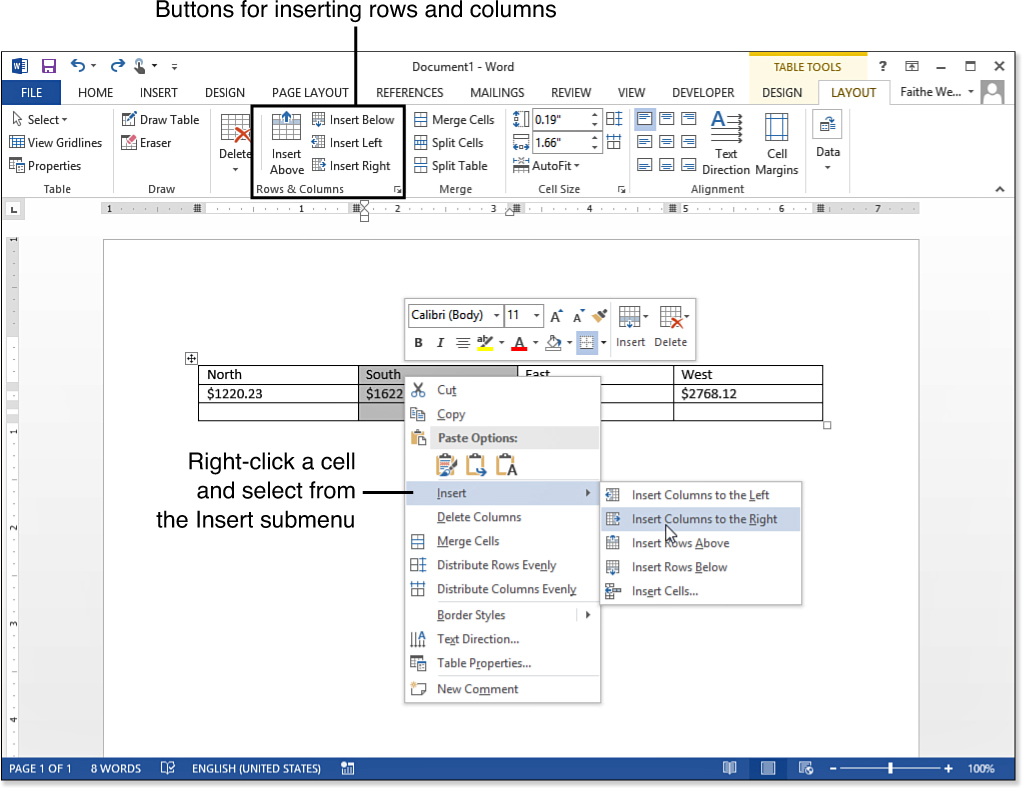
Figure 9.12. Insert a row or column by right-clicking and selecting from the Insert submenu.
You can also insert individual cells, shifting the existing cells down or to the right. To do this, follow these steps:
1. Right-click the cell where you want to insert a new cell and choose Insert, Insert Cells.
Alternatively, move the insertion point into the cell where you want to insert a new cell and click the dialog box launcher for the Rows & Columns group on the Table Tools Layout tab.
2. In the Insert Cells dialog box, shown in Figure 9.13, click the insertion type you want. You can choose to shift the existing cells either down or to the right. (You can also use this dialog box to insert an entire row or column, although it’s somewhat of a long way around for that.)
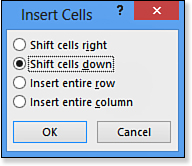
Figure 9.13. Choose what should happen to the existing cells to make room for the new cell.
3. Click OK.
Inserting a new cell adds another row or column to the table if needed to hold the shifted content; if there is already an extra row at the bottom or column at the right, the content simply shifts into it and no new rows or columns are created.
Deleting Rows, Columns, or Cells
A lot of people are surprised that the Delete key on the keyboard does not work to delete rows, columns, and cells. That’s because Delete is not really a removal tool; it’s a clearing tool. It clears whatever content is there, but it leaves the structure in place. Therefore, if you select a cell and press Delete, all of the cell’s content is deleted, but the cell remains.
The Table Tools Layout tab’s Delete button opens a menu of deletion choices. Move the insertion point into the row, column, or cell to affect and then click the Delete button’s arrow and select your preferred deletion command from the menu, as shown in Figure 9.14.

Figure 9.14. Choose the portion of the table to delete.
If you choose Delete Cells, a Delete Cells dialog box opens, in which you can choose whether the remaining cells should be shifted to the left or up. (It’s just like the Insert Cells dialog box from Figure 9.13, except it’s deleting instead of inserting.)
![]() Note
Note
Cutting isn’t really deleting, but if you cut something and then never paste it, the effect is the same.
You can also use the Cut feature of the Clipboard to remove entire rows or columns. (It doesn’t work for individual cells; it just clears them.) To delete an entire row or column, select it and then press Ctrl+X or click the Cut button on the Home tab.
Deleting an Entire Table
To delete an entire table, click any cell within the table, display the Table Tools Layout tab, click the Delete button, and choose Delete Table (refer to Figure 9.14).
There are also some less-direct methods. Just like with individual rows, columns, and cells, you can’t delete an entire table with the Delete key; selecting the entire table and pressing Delete simply clears all the content out of the table. An exception applies to that, however. If you select a larger block of the document than just the table—for example, the table plus the end-of-paragraph marker before or after it—and then press Delete, Word deletes the entire block, including the table structure.
The Cut feature of the Clipboard also works on entire tables. Select the entire table and press Ctrl+X or click the Cut button on the Home tab. (You can also right-click the table selector icon and choose Cut to cut the entire table.) You can then paste the entire table from the Clipboard to another location in the document, if you want.
Moving and Copying Rows and Columns
To move or copy a row or column, you have a choice of two techniques: using a drag-and-drop operation or using the Clipboard (Cut/Copy/Paste).
Here’s the drag-and-drop method:
1. Select the rows or columns to move or copy.
2. Position the mouse pointer over the selection, so that the pointer becomes a white arrow.
3. (Optional) Hold down the Ctrl key if you want to copy (rather than move).
![]() Tip
Tip
When moving a row, position the mouse pointer over the leftmost cell in the row.
4. Drag to the left or right for columns, or drag up or down for rows, to move the selection to a new position.
Here’s the Clipboard method:
1. Select the rows or columns to move or copy.
2. Cut or copy the selection to the Clipboard using one of these methods:
• Ribbon method—Click Cut or Copy on the Home tab.
• Keyboard method—Press Ctrl+X for Cut or Ctrl+C for Copy.
• Right-click method—Right-click the selection and choose Cut or Copy.
3. Click where you want the selection to go. If you’re moving/copying a row, click in the leftmost cell of the row that should appear below the selection. If you’re moving/copying a column, click in the column that should appear to the right.
Individual cells cannot be moved in the same sense as a row or column is moved, but you can move the cell content with either a drag-and-drop or cut-and-paste operation. Be careful, though, that you do not overwrite existing content. If the destination cells are not empty, the previous content is deleted, not moved over. (You’re not working with cells here, but with cell content.)
4. Paste the selection from the Clipboard using one of these methods:
• Ribbon method—Click Paste on the Home tab.
• Keyboard method—Press Ctrl+V.
• Right-click method—Right-click and choose Paste.
Merging and Splitting Cells
Merging cells erases the dividers between them; splitting a cell adds a divider, creating two cells out of one. Using merging or splitting, you can create all sorts of interesting tables with unequal numbers of rows and columns, much like in the drawn tables you learned about at the beginning of the chapter. (In fact, the table-drawing tools provide one method of merging and splitting.)
![]() To learn why merging and splitting cells can cause readability problems for people who use a screen reading program, see “Creating Accessible Word Documents,” p. 920.
To learn why merging and splitting cells can cause readability problems for people who use a screen reading program, see “Creating Accessible Word Documents,” p. 920.
To merge two or more cells, select the cells and click the Merge Cells button on the Table Tools Layout tab (see Figure 9.15), or right-click the selection and choose Merge Cells.

Figure 9.15. Merge the selected cells.
When you’re merging multiple nonempty cells, the resulting merged cell contains all the content from all the merged cells, separated by paragraph breaks.
When you’re merging cells that contain different formatting settings, the resulting merged cell takes on the cell formatting from the leftmost or topmost cell in the merged range. This rule applies only to cell-wide formatting, though, not character formatting. For example, text that’s bold will continue to be bold after the merge.
Another way to merge cells is to use the Eraser feature, found on the Table Tools Layout tab. Click Eraser, and the mouse pointer becomes an eraser. Then, click the divider line between any two cells to merge them (see Figure 9.16).

Figure 9.16. Use the Eraser tool to merge cells.
Merging cells is simple because there are no options involved; cells are either merged or they are not. With splitting, however, you must specify how many pieces you want the cell split into vertically or horizontally.
To split a cell, follow these steps:
1. Click in the cell to be split and then click the Split Cells button on the Table Tools Layout tab. Alternatively, you can right-click the cell and choose Split Cells.
2. Enter the number of columns and rows in which to split the selected cell. For example, to split it into four columns, enter 4 as the number of columns and 1 as the number of rows (see Figure 9.17).

Figure 9.17. Enter information about the desired split.
3. Click OK to perform the split.
You can also split using the table-drawing tools. This works just like it did when you were drawing the table initially (if you used that method to create the table). To split a table by drawing, follow these steps:
1. On the Table Tools Layout tab, click Draw Table. The mouse pointer turns into a pencil.
2. Drag to draw divider lines where you want splits to occur.
3. Click the Draw Table button again, or press Esc, to turn drawing mode off.
Splitting a Table
Splitting a table adds a blank paragraph (nontable) between two rows. To split a table, click in the row that should become the first row in the second table and then click the Split Table button on the Table Tools Layout tab.
To rejoin a table that has been split, delete the paragraph marker between the tables.
Creating a Nested Table
A nested table is a table within a table. Nested tables can be useful when you are using a table for page layout and then want to use a table for data organization within the layout. For example, in Figure 9.18, a table-based newsletter contains a mini-calendar table within its right column.

Figure 9.18. A table can be nested within another table.
To create a nested table, click inside a cell and then insert a new table as you would normally, using any method you learned earlier in this chapter.
![]() Tip
Tip
If you have a table such as the nested calendar in Figure 9.18 that you might want to reuse, consider saving it as a building block. To do so, select the table, display the Insert tab, and click Quick Parts. On the menu that appears, click Save Selection to Quick Part Gallery. Set up a building block entry for it in the Quick Parts gallery; you can then access it from the Quick Parts menu for reuse.
If the table to be nested already exists, you can paste it into a cell. Don’t use a regular paste operation for this, though, because Word will assume you want to merge the two tables. Instead, follow these steps to paste one table into another:
1. Cut or copy the table to be nested onto the Clipboard.
2. Place the insertion point in the cell in which you want to paste the table.
3. Right-click at the insertion point and choose Paste as Nested Table.
Sizing a Table
By default, a newly inserted table is as wide as possible, given the margin and indent settings at the location where it is placed. So, for example, if you place it on an 8.5-inch × 11-inch page with 1-inch margins on each size, the table will be 6.5 inches wide. The columns are equal in size, so in an eight-column table that’s 6.5 inches wide, for example, each cell is 0.83 inches (approximately 13/16 inches) wide.
The default height of a table is determined by the number of rows, with a single-height line for text in each row. For example, if the default font size is 11-point, each row’s height will be such that one line of 11-point text can fit into it.
Changing the AutoFit Setting
The AutoFit setting determines how (or whether) the table’s size will change as the content is added to it.
A table has three possible AutoFit settings, and you can switch between them from the AutoFit button on the Table Tools Layout tab, as in Figure 9.19, or by right-clicking the table and choosing AutoFit:
• AutoFit Contents—Each cell is as wide as it needs to be to hold its content. Empty columns are very small (one character wide). Text wraps to additional lines in a cell, but only after the cell has expanded as much as it can, given the widths of the other columns and the overall table size.
• AutoFit Window—The table resizes itself depending on the size of the page on which it is displayed. This is useful for web pages and also for nested tables. For example, the calendar in Figure 9.18 would dynamically change its width as the column in which it resides changes width if you set it to AutoFit to Window.
• Fixed Column Width—Each cell stays at its current size until you manually change it.

Figure 9.19. Choose an AutoFit setting to govern the table’s sizing.
The table’s AutoFit setting forms the basis of its initial width settings, but there are numerous ways of manually adjusting those widths.
Resizing by Dragging
The easiest way to resize a row or column is simply by dragging; position the mouse pointer over the right border (for width) or bottom border (for height) and drag (see Figure 9.20). To change the width of the entire column or the height of the entire row, make sure that nothing is selected in the table when you begin dragging.

Figure 9.20. Resize a column by dragging.
Dragging a column border changes the spacing between the cells it lies between, but no other cells are affected, nor is the overall size of the table. If you want all the other cells to stay the same size, and the overall size of the table to change with the resizing, hold down the Shift key as you drag.
If a cell is selected in the table when you drag, the resizing affects only the row containing the selected cell. The adjustment affects only the two cells that the border lies between. To resize the whole row, hold down Shift.
Specifying an Exact Size
If you need precise sizes for rows or columns, click in a cell and then use the Height and Width boxes on the Table Tools Layout tab. The Height value affects the entire row; the Width value affects the entire column (see Figure 9.21).

Figure 9.21. Enter height and width values for the row and column of the current cell.
You can also change row and column sizes from the Table Properties dialog box. Follow these steps:
1. Right-click the row or column to affect and choose Table Properties.
Alternatively, you can click in the row or column to affect and then either click the dialog box launcher for the Cell Size group or click the Properties button in the Table group (both on the Table Tools Layout tab).
2. In the Table Properties dialog box, click the Column tab. The width information for the selected column appears (see Figure 9.22).

Figure 9.22. Set a specific size for each column.
3. Change the column width if needed.
4. To change another column, click the Next Column or Previous Column button and change the width for it. Do this for all the columns you need to change.
5. Click the Row tab. The height information for the current row appears. By default, the Specify Height check box is not marked, which enables the row to dynamically resize itself depending on its content.
6. If you want to specify an exact height for the row, mark the Specify Height check box and enter a value.
7. Set the Row Height Is value to either At Least or Exactly. At Least allows the height to grow larger than the specified value but not smaller. Exactly forces the row to be exactly the specified value, even if the text is truncated (see Figure 9.23).

Figure 9.23. Set a specific size for each row, or allow the rows to auto-size.
8. Mark or clear the Allow Row to Break Across Pages check box as desired.
9. To change another row, click the Next Row or Previous Row button and then change the height for it. Repeat until you have set all rows.
10. Click OK.
Distributing Column Widths Evenly
Tables start out with uniform-sized rows and columns, but as you have seen, you can make changes to those values. To go back to even spacing, click the Distribute Columns or Distribute Rows button on the Table Tools Layout tab (see Figure 9.24). As an alternative method, you can select the entire table and then right-click the table and choose Distribute Rows Evenly or Distribute Columns Evenly from the shortcut menu.

Figure 9.24. Set row heights or column widths to use the available space equally.
Resizing the Entire Table
To resize the table as a whole, drag one of its outside borders. You’ll get different results, though, depending on where you drag:
• Left border—Changes the width of the leftmost column
• Right border—Changes the width of the rightmost column
• Bottom border—Changes the height of the bottom row
• Bottom-right corner—Changes the height and width of the table overall, with all rows and columns adjusted proportionally
![]() Tip
Tip
Holding down Shift while dragging the bottom-right corner constrains the resizing so that the table’s aspect ratio (height-to-width ratio) is maintained.
Formatting a Table
Now that you’ve learned about the structural aspects of table creation and editing, let’s look at some ways of making the table more attractive and readable.
Applying Table Styles
Table styles are similar to the character and paragraph styles you learned about in Chapter 6, “Creating and Applying Styles and Themes.” They quickly apply named sets of formatting. The main difference is that a table style contains table-specific features such as cell border formatting, cell shading, and special designations for the first and last row and column.
![]() To learn more about styles, see “Understanding Styles,” p. 213.
To learn more about styles, see “Understanding Styles,” p. 213.
To apply a table style, click anywhere in the table and then select one of the table styles from the Table Tools Design tab (see Figure 9.25). For more choices, click the down-arrow button to open a larger menu.

Figure 9.25. Select a table style.
After applying a table style, use the check boxes in the Table Style Options group of the Table Tools Design tab to turn on/off certain formatting extras. Each of these designates certain rows or columns to receive different formatting. For example, Header Row formats the first row differently; Total Row formats the last row differently. The Banded options make every other row or column different, for easier reading.
![]() Note
Note
When you apply a table style, any direct (manual) formatting applied to the table is wiped away. This is by design. To change styles but keep the manual formatting, instead of clicking a style on the Table Styles list, right-click the style to display a menu. Then, on that menu, choose Apply and Maintain Formatting.
Not all styles support banded rows and columns. If nothing seems to be happening when you turn on Banded Rows or Banded Columns, try selecting a different table style.
If you’re happy with the current table style except for wanting bands, modify the style. To do so, open the Table Styles list (from the Table Tools Design tab) and choose Modify Table Style. Assign a new name in the Name box, and then open the Apply Formatting To menu and choose one of the band options (such as Banded Rows or Banded Columns). Change the formatting as desired, and then click OK.
Setting the Default Table Style
To set a style as the default for new tables, right-click the desired style on the Table Styles list and choose Set As Default. In the Microsoft Word dialog box that appears, choose either This Document Only or All Documents Based on the Normal.dotm Template to specify the scope of the setting. Then, click OK to make the style the new default.
Creating or Modifying Table Styles
To create a table style, you can either start with an existing one and give it a new name, or start from scratch with a new definition. It is better in most cases to create a new style than overwrite the definition of an existing one, and in some cases Word will not let you modify a built-in style.
To create or modify a table style, follow these steps:
1. Open the Table Styles list on the Table Tools Design tab and select the style that is closest to the one you want.
2. Open the Table Styles list again and choose New Table Style (to create a new one) or Modify Table Style (to modify the existing one). The Create New Style from Formatting or Modify Style dialog box opens, depending on which you chose.
3. If you are creating a new style, type a new name in the Name box.
4. To make whole-table changes, set the Apply Formatting To value to Whole Table and then make formatting changes using the controls provided. You can choose a different font, size, and color; change the borders; change the cell shading and alignment; and more (see Figure 9.26). You learn more about these formatting types in upcoming sections of this chapter.
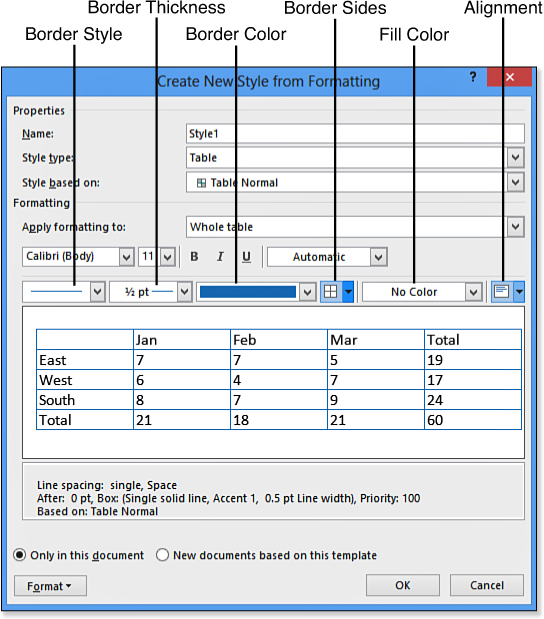
Figure 9.26. Create your own table style definition.
5. To make changes to only certain rows or columns, select the desired scope from the Apply Formatting To list (for example, Header Row), and then make formatting changes.
6. (Optional) To store the style in the template (for reuse in other documents), click New Documents Based on This Template.
7. Click OK. The new custom table style is created, or the existing style is modified.
![]() Note
Note
If the formatting you want to apply does not appear in the dialog box, click the Format button to open a menu of more choices. For example, from the Format button’s menu you can choose Banding to fine-tune the bands to include more than one row or column per band.
Custom table styles, when they exist, appear at the top of the Table Styles list in the Custom section (see Figure 9.27). If you modified an existing style, it appears in its normal position in the Table Styles list, but appears with the different formatting you applied.

Figure 9.27. You can access custom styles from the Styles list on the Design tab.
To better understand the formatting controls in the Create New Style from Formatting (or Modify Style) dialog box, review the information in the following sections. The formatting can be applied manually, as explained in these sections, or integrated into the style.
Changing the Cell Background Color
To apply a solid-color background (fill color) to one or more cells, use the Shading drop-down list on the Table Tools Design tab (see Figure 9.28). As in other areas of Word, you can choose between theme colors, tints, or shades of the theme colors, standard colors, or More Colors (to open a color selection dialog box).

Figure 9.28. Select a solid-color shading.
![]() To learn more about how Word uses colors, see “Changing Font Color,” p. 150.
To learn more about how Word uses colors, see “Changing Font Color,” p. 150.
To apply a patterned background to a cell, you must use the Borders and Shading dialog box, as follows:
1. Select the cells to affect.
2. On the Table Tools Design tab, click the dialog box launcher in the Borders group. The Borders and Shading dialog box opens.
3. Click the Shading tab.
4. Open the Style list and select the pattern to apply to the background.
5. Open the Color list and select the basic color for the background.
6. Open the Fill list and select the color for the pattern (see Figure 9.29).
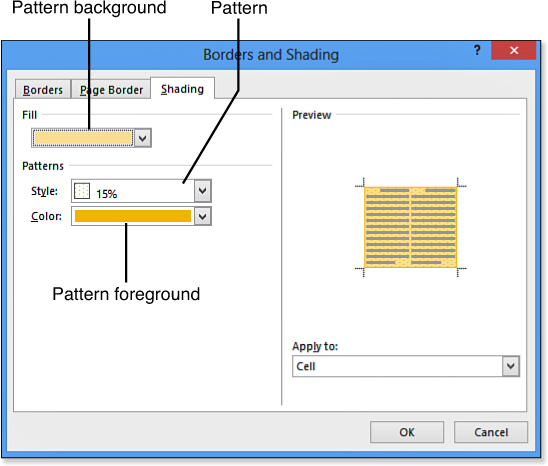
Figure 9.29. To apply a patterned background, use the Borders and Shading dialog box.
7. Click OK to apply the patterned background to the selected cells.
You can also use the Borders and Shading dialog box method to apply a solid-color background if you prefer it to the Ribbon method. For a solid-color background, set the Style setting to Solid (100 percent).
Avoid strongly contrasting patterns as backgrounds for cells containing text, because it makes the text difficult to read. A patterned background would be more appropriate for an empty row that separates two rows of text, for example, or as a background for a cell that contains a picture.
Working with Cell Borders
The term border in the context of a table has two subtly different meanings. In one definition, the border is the visible line around one or more sides of a cell. When you set a cell to No Border, you are setting the lines around it to not be visible when printed. This is the definition generally adhered to when formatting tables with the Design tab, and in this section of the chapter, border has that meaning.
Another definition of border is the boundary around the four sides of the cell, whether or not it is visible. Using this definition, every cell has a border on every side. It’s convenient to talk about cell borders this way when discussing resizing a cell by dragging, for example, because the ability to drag a border is not dependent on its having a visible line.
Nearly everything you learned about paragraph borders in Chapter 5, “Formatting Paragraphs and Lists,” also applies to table cells. The same attributes apply to both paragraph and table borders: line style, line thickness, and line color.
![]() To learn more about how borders work with paragraphs, see “Applying Paragraph Borders,” p. 203.
To learn more about how borders work with paragraphs, see “Applying Paragraph Borders,” p. 203.
One easy way to apply borders—that is, visible lines—to a table (or parts of a table) is to use the tools on the Table Tools Design tab, as shown in Figure 9.30. You can choose a line style, line weight, and pen color, and choose the sides of the selection to which you want the choices to apply from the Borders button’s drop-down list.

Figure 9.30. Tools for formatting table borders.
Select the border style, width, and color, and then apply the border sides. If you apply the sides first, the settings you later choose for style, width, and color will not be automatically applied; you will need to reapply the sides to put them into effect.
The Borders button opens a list of various border sides, shown in Figure 9.31. (Look back at Table 5.1 in Chapter 5 for a review of these.) Keep in mind that in a table, the borders refer to the selected cells as a group, not to the individual cells. For example, Outside Borders places the border around the selection, not around each cell, and Top Border places the border across the top of the selection, not at the top of each cell.

Figure 9.31. Select the border sides to apply to the table.
New in Word 2013, the Border Painter feature, on the Table Tools Design tab, turns your mouse pointer into an ink pen that “paints” the currently selected border onto individual lines in your table as you click them. Press Esc to turn the feature off again when finished with it.
Another new feature is Border Styles. You can select a border style from the Border Styles button’s drop-down list instead of selecting separate settings for pen color, line style, and line weight. The pen colors come from the document’s theme colors. After you select from the Border Styles button’s list, the Border Painter feature is turned on; the mouse pointer becomes a pen, and you can click the individual border lines on the table that you want to format. Alternatively, you can open the Borders button’s list and select the sides to apply the choice to.
Also new in Word 2013 is the Border Sampler feature, found on the Border Styles button’s menu. This is like Format Painter, except it picks up the formatting of existing borders and then allows you to apply it to other borders by clicking on them.
You can also use the Borders and Shading dialog box to apply borders, just as you did for paragraphs in Chapter 5. Follow these steps:
1. Select the cells to affect.
2. On the Table Tools Design tab, click the dialog box launcher in the Borders group. The Borders and Shading dialog box opens.
3. Click the Borders tab if does not already appear (see Figure 9.32).

Figure 9.32. You can format cell borders from the Borders tab of the Borders and Shading dialog box.
4. Select a border type from the Setting icons along the left side of the dialog box:
• None—Turns off all borders.
• Box—Places an outside border in which all sides are the same thickness.
• All—Places the same border around all sides of all cells in the selected range.
• Grid—Places a thicker outside border and a thinner inside border.
• Custom—Enables you to select and format each side individually. (You can start with any of the other settings; then, when you start to change individual sizes, the setting changes to Custom automatically.)
5. On the Style list, select a line style.
6. On the Color list, select a line color. (Color selection works the same here as with any other colored object.)
![]() For an explanation of Word’s color choices, see “Changing Font Color,” p. 150.
For an explanation of Word’s color choices, see “Changing Font Color,” p. 150.
7. On the Width list, select a line thickness.
8. (Optional) If you want to remove the border on certain sides, click the corresponding button in the Preview area. (There is a button for each of the four sides.)
9. Click OK to accept the new border.
Setting Cell Margins
Each cell has internal margins—that is, an amount of space between the border on each side and the text you type into the cell. In this sense, a cell is very much like a text box.
![]() For an explanation of text boxes and their internal margin settings, see “Creating Text Box Layouts,” p. 303.
For an explanation of text boxes and their internal margin settings, see “Creating Text Box Layouts,” p. 303.
You can set the internal margins for all cells at once, or for individual cells.
Setting Overall Internal Margins for the Table
The overall internal margins for the table provide a baseline; you can then make changes for individual cells later.
To set the overall internal margins for the table, follow these steps:
1. On the Table Tools Layout tab, click Cell Margins. The Table Options dialog box opens.
2. Enter margin settings in the Default Cell Margins section for each side (see Figure 9.33).

Figure 9.33. Set cell margins from the Table Options dialog box.
3. (Optional) To place spacing between cells, mark the Allow Spacing Between Cells check box and enter an amount of space.
This setting enables you to add extra space for the margins where two cells meet. The extra spacing is contextual; although it applies to the entire table, it applies to certain cells depending on their position. For example, with overall margin settings of 0.1 inches on all sides but an Allow Spacing Between Cells setting of 0.1 inch, the topmost, leftmost cell in the table would have a top and left internal margin of 0.1 inch and a bottom and right internal margin of 0.2 inches.
4. Mark or clear the Automatically Resize to Fit Contents check box.
When selected, the table cells can resize as you type to accommodate long text entries or large graphics.
5. Click OK.
Setting Internal Margins for an Individual Cell
Depending on a cell’s content, you might need for it to have different internal margins than the rest of the table. To customize the internal margins for a certain cell, or a range of cells, follow these steps:
1. Select the cells to affect.
2. On the Table Tools Layout tab, click the Properties button. The Table Properties dialog box opens.
3. Click the Cell tab and then click the Options button. The Cell Options dialog box opens.
4. Clear the Same as the Whole Table check box. Individual internal margin settings become available for Top, Bottom, Left, and Right (see Figure 9.34).

Figure 9.34. Change the internal margins for individual cells.
5. Mark or clear the check boxes as desired:
• Wrap Text—If needed, this option allows text to wrap to additional lines in the cell.
• Fit Text—If needed, this option reduces the size of the font to fit the text in the cell.
6. Click OK.
Setting Text Alignment Within a Cell
Regular paragraphs in a document have only one dimension in which they can be aligned: horizontally. Table cells, on the other hand, have both a vertical and horizontal alignment setting. There are nine combinations possible in all, and each is represented by a button in the Alignment group of the Table Tools Layout tab. Select the cells to affect and then click one of those buttons (see Figure 9.35).
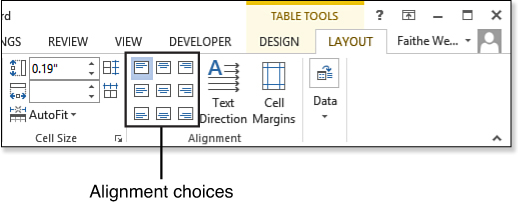
Figure 9.35. Choose a vertical and horizontal alignment for selected cells.
Changing Text Direction
Text in a table cell can be oriented in any of three directions: horizontal (left to right), vertical (top to bottom), or vertical (bottom to top), just like in a text box. To toggle between these orientations, click the Text Direction button on the Table Tools Layout tab.
![]() Caution
Caution
Changing the text direction to a vertical one increases the height of the rows, and when you go back to horizontal orientation, the rows don’t automatically go back to their earlier, smaller heights. To put the rows back to their original sizes, drag the bottom-right corner of the table frame up, or set the Height size to the original height. (With 11-point text, the original height is approximately 0.19 inches.)
Repeating Headings on Each Page
When a table runs more than one page in a document, it can be a challenge to keep track of what each column represents when looking at the later pages. One solution to that is to repeat the heading row on each page by manually copying it, but then when you edit the table so that it contains more or fewer rows, that repeated heading row gets thrown out of place.
To solve this problem, Word enables you to set the header to be repeated on subsequent pages automatically whenever a table crosses a page break. To set this up, follow these steps:
1. Click in the header row.
2. On the Table Tools Layout tab, click Properties. The Table Properties dialog box opens.
3. Click the Row tab, and then mark the Repeat As Header Row at the Top of Each Page check box.
4. Click OK.
Preventing a Row from Breaking Across Pages
When a row contains multiple lines of text, and it falls at the bottom of a page, part of the row may appear on the next page. This can be confusing for the reader, especially if not all the cells in that row contain the same number of lines.
To prevent rows from breaking, select the rows and then on the Table Tools Layout tab, click Properties. On the Row tab, clear the Allow Row to Break Across Pages check box and then click OK.
Orienting the Table on the Page
So far in this chapter, we’ve been working inside a table, but now let’s consider how the table interacts with the rest of the document. By default, a table takes up the full width of the page (or the full width of whatever you place it into), but you can resize it to a smaller width. When a table is less than full width, it can interact with the rest of the document as a graphic object would. It can be set for a certain horizontal alignment (like a paragraph), and text can be set to wrap around it in various ways.
Setting Table Alignment
The paragraph’s alignment does not have an effect unless the paragraph is narrower than the space available to it. Because by default it exactly fills the available space, and most people don’t change that, table alignment is not that important for most users.
If you need to set the table alignment, however, it’s fairly easy to do so. Follow these steps:
1. Click anywhere in the table.
2. On the Table Tools Layout tab, click Properties. The Table Properties dialog box opens.
3. Click the Table tab, and in the Alignment section, click Left, Center, or Right (see Figure 9.36).

Figure 9.36. Set alignment for the table as a whole.
4. (Optional) If you chose Left as the alignment, enter an amount of indentation from the left. (This is like the left indent for a paragraph.)
5. Click OK.
Setting Table Text Wrap
Table text wrap allows the regular paragraphs of the document to wrap around the table if the table is narrower than the maximum document width. It is somewhat like the text wrapping around graphic objects or text boxes.
![]() To set text wrapping around a photo or other graphic, see “Setting Text Wrap,” p. 388.
To set text wrapping around a photo or other graphic, see “Setting Text Wrap,” p. 388.
To set the text wrap for a table, follow these steps:
1. Click anywhere in the table.
2. On the Table Tools Layout tab, click Properties. The Table Properties dialog box opens.
3. Click the Table tab, and in the Text Wrapping section, click Around (refer to Figure 9.36).
4. (Optional) Click Positioning, opening the Table Positioning dialog box (see Figure 9.37).

Figure 9.37. Fine-tune the positioning setting.
5. Set the horizontal position for the table. You can choose a setting from the drop-down list (Left, Right, Center, Inside, or Outside) or type a number representing an amount of offset in inches, in which case Left positioning is assumed.
![]() Note
Note
Inside and Outside are special settings that float the table to the left or right depending on whether the page is odd numbered or even numbered. It’s designed to facilitate two-sided layouts. On an odd-numbered page, Inside aligns to the left and Outside to the right; on an even-numbered page, it’s the opposite.
6. In the Horizontal section, set the Relative To setting to define what that setting is in relation to (Column, Margin, or Page).
7. In the Vertical section, set the Position and Relative To settings. As with the Horizontal section, you can either choose a relative amount from the drop-down list or type a numeric value in inches. The measurement can be in relation to Paragraph, Margin, or Page.
![]() Note
Note
When working with a relative setting such as Left or Right, no real difference exists between Margin and Page, but when using specific numeric values, the difference is apparent; 1 inch from the margin is very different from 1 inch from the edge of the page.
8. In the Distance from Surrounding Text area, enter spacing amounts to separate the edge of the table from the text that wraps around it.
9. If the table should be anchored to the surrounding text, mark the Move with Text check box; if it should remain fixed on the page and the text should be able to move past it, clear that check box.
10. If the table should be allowed to overlap other content on the page, mark the Allow Overlap check box.
11. Click OK twice to close both dialog boxes.
Creating a Table Caption
Long, complex reports often have multiple tables in them, numbered for reference. You can manually number the tables and create your own captions for them, but it is much easier to allow Word to manage the table-captioning process. That way, if you insert a new table earlier in the document, the tables that follow it are automatically renumbered. Table captioning also makes for better accessibility for people using screen reading programs because it helps them determine the purpose and content of the table without having to read the whole table.
To add a caption to a table, follow these steps:
1. Select the entire table, and then right-click the table and choose Insert Caption. The Caption dialog box opens (see Figure 9.38).

Figure 9.38. Set up a caption for tables in the document.
Alternatively, you can click the Insert Caption button on the References tab.
2. Leave the Label setting at Table.
3. In the Position list, choose where you want the captions to appear for tables. (Usually, tables have captions above them.)
![]() Note
Note
The Caption text box in the Caption dialog box shows you a sample of the caption that will appear based on the other settings in the dialog box.
4. The caption will read Table 1. If you want some other word than Table, click New Label and specify another word instead.
Alternatively, to omit using a word at all before the number, mark the Exclude Label from Caption check box.
5. Click the Numbering button. The Caption Numbering dialog box opens (see Figure 9.39).
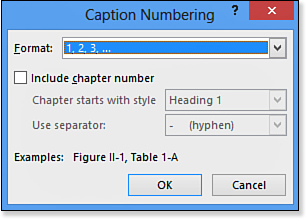
Figure 9.39. Control the numbering style for table captions.
6. Select a format from the Format list.
7. (Optional) To include a chapter number with the caption, mark the Include Chapter Number check box, and then choose what style designates a chapter and what separator character should be used.
8. Click OK to return to the Caption dialog box.
9. Click OK. The caption appears in the document, immediately above (or below) the table.
10. Click to the right of the caption and type a text description if desired. For example, after Table 1, you might type a colon (:) and then Regional Management Team, as in Figure 9.40.

Figure 9.40. A completed table caption with a manually typed description.
Sorting Tabular Data
One reason people like to store data in table format is that it makes the data easier to search and sort. Word’s Sort feature works with regular paragraphs too, but when it’s used with a table or other delimited data it has some additional functionality, such as the ability to sort by multiple columns simultaneously.
![]() Note
Note
Delimited data is text that is separated into columns. For example, comma-delimited data consists of regular paragraphs (one per row) in which the data for each column is separated by commas, like this: data1,data2,data3. Data can also be tab-delimited (as with the columns created via tab stops in Chapter 5), or it can be delimited using some other character.
![]() For information about delimited data, see “Converting Text to a Table,” p. 373.
For information about delimited data, see “Converting Text to a Table,” p. 373.
Sorts can be either ascending (0 to 9, then A to Z) or descending (Z to A, then 9 to 0).
Sorts can be performed assuming a particular column contains text, numbers, or dates. This distinction helps you sort based on meaning rather than based purely on the first character:
• Text sort—No meaning assigned; sort is based purely on the first digit. For example, a list of 1, 5, and 10 would be listed in this order: 1, 10, 5.
• Number sort—Sort is alphabetical, except when numbers are involved; then it is based on the number chronology. For example, a list of 1, 5, 10 is sorted in that same order.
• Date sort—Sort is alphabetical except when dates are involved; then it is based on date chronology. For example, a list of 10/1/11, 10/2/10, and 12/2/09 is sorted from earliest to latest date.
To sort the data in a table, follow these steps:
1. Click anywhere in the table and then, on the Table Tools Layout tab, click Sort. (If you don’t see the Sort command, the Data group may be collapsed because your application window is not wide enough. Click Data, and then click Sort.) The Sort dialog box opens, as shown in Figure 9.41.

Figure 9.41. Set up a sort specification for the table.
2. If the first row contains header labels, select the Header Row option button; otherwise, click No Header Row.
3. In the Sort By list, select the column by which to sort. If you chose Header Row in step 2, the text from that row appears as labels here; otherwise, generic names appear (Column 1, Column 2, and so on).
4. Open the Type list and select Text, Number, or Date.
5. Click Ascending or Descending.
6. (Optional) Set up a secondary sort in the Then By section. The secondary sort takes effect only in the event of a tie in the primary column. You can also enter a third level in the subsequent Then By section.
7. (Optional) To make the sort case sensitive, click the Options button, mark the Case Sensitive check box, and click OK.
8. Click OK to perform the sort.
Performing Math Calculations in a Table
Word is no substitute for a powerful spreadsheet program such as Excel, but it does have some basic math functions built in to it. You can use these to perform operations such as sum, average, count, and round. You can also type your own math formulas for the cells, with or without functions.
One little hiccup in using math in a Word table is that the cells don’t have names, at least not in the same sense as in Excel. There are no visible letters designating columns or numbers designating rows.
There’s a secret to that, though; they actually do respond to those same names as in Excel. The columns have names starting with A at the left, and the rows have numbers starting with 1 at the top. So, for example, the second cell in the second row is B2. Those labels don’t appear anywhere in Word, though, so you have to count across or down to determine how many positions away from A1 a particular cell lies and then reference its name accordingly. You can also refer to all the cells in a certain direction with ABOVE, BELOW, LEFT, and RIGHT. For example, =AVERAGE(LEFT) averages everything to the left of the current cell.
Math formulas in a Word table begin with equal signs, just like in Excel. They can use the traditional math operators:
• Addition (+)
• Subtraction (–)
• Multiplication (*)
• Division (/)
Table 9.2 includes some examples.
Table 9.2. Basic Math Formulas for Word Tables

You can’t just type a formula into a cell; you must use the Formula dialog box to set it up. Follow these steps to do so:
1. Position the insertion point in the cell where you want to place the formula.
![]() Tip
Tip
You can use the Paste Function list to select from among the available functions. The chosen function is added to the current content of the Formula text box.
2. Click Formula on the Table Tools Layout tab to open the Formula dialog box (see Figure 9.42). If you don’t see the Formula command, the Data group may be collapsed; click the Data button, and then click Formula.
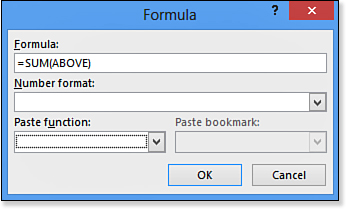
Figure 9.42. Create a math formula.
3. In the Formula box, a default function might appear, depending on the position of the cell within the table. Accept it, modify it, or delete it and type a different formula or function entirely. Table 9.3 lists the available functions and their syntax. Table 9.4 lists the valid comparison operators you can use for logical functions such as IF, NOT, and AND.
Table 9.3. Math Functions for Word Tables


Table 9.4. Comparison Operators

4. (Optional) Choose a number format from the Number Format list. A number of currency, percentage, and other numeric formats are available.
5. Click OK.
Setting the Order of Operations
When including multiple math operators in a formula, keep in mind the default order of operation. Word processes multiplication and division first, followed by addition and subtraction. If you need to change that order, enclose the portions to be calculated first in parentheses.
For example, in the formula
=A1+A2*5
the A2*5 portion is calculated first, and then the result is added to A1. If you want the addition done first, write it this way:
=(A1+A2)*5
Referencing Values Outside the Table
Formulas and functions can include references to numbers that exist elsewhere in the document, not just in cells within that table. To reference a number, set up that number as a bookmark and then reference the bookmark.
![]() For more information about bookmarks, see “Working with Bookmarks,” p. 601.
For more information about bookmarks, see “Working with Bookmarks,” p. 601.
To create a bookmark and then reference it in a formula, follow these steps:
1. Select the number to be bookmarked in the document.
2. On the Insert tab, click Bookmark. The Bookmark dialog box opens. If you don’t see a Bookmark command, the Links group might be collapsed; click Links, and then click Bookmark.
3. In the Bookmark name box, type a name (keep it short, with no spaces) and click Add. The Bookmark dialog box closes.
4. In the table, begin creating the formula as you normally would. In the Formula text box in the Formula dialog box, with the insertion point at the spot where you want the bookmark to be referenced, open the Paste Bookmark list and select the bookmark (see Figure 9.43).
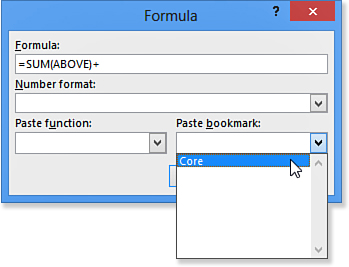
Figure 9.43. Reference a bookmark in a formula.
5. Finish creating the formula as you normally would.
Getting Data Into or Out of Tabular Format
As you’ve seen so far in this chapter, one way of creating a table is to insert it from scratch and then type your data into it. But, you can place tabular data into your document in other ways, too, as you learn in the next several sections.
Converting Text to a Table
Any text can be converted to a table in Word. The key question is, how many columns will it have?
When you convert regular paragraphs to a table, the table consists of a single column only, and each paragraph is in its own row. If you want more columns, you must make sure that the text is properly delimited before the conversion.
Delimited text is text that is broken into sections by some consistently used symbol. The most common delimiter characters are tabs and commas. For example, if you have set up a multicolumn layout with tab stops, those paragraphs are tab-delimited.
Data exported from a database program is usually in comma-delimited format. For example, the following is a comma-delimited data table consisting of four rows and four columns:
First Name,Last Name,City,State
Chuck,Perkins,Decatur,IL
Mildred,Perryman,Moweaqua,IL
Francis,Zindel,Moweaqua,IL
Word recognizes common delimiter characters; so when you convert delimited text to a table, Word can create the appropriate number of columns to hold it. If there is an inconsistent number of delimiters in the various rows you’ve selected for inclusion in the table, Word goes with the largest number. So, for example, if you accidentally type two commas between two values rather than the customary one comma, Word takes that as an invitation to insert two columns, and all the other rows become off by one. That’s the most common mistake people make when creating delimited text for table conversion, so pay sharp attention to the delimiter usage.
After preparing the data with delimiters, follow these steps to convert it to a table:
1. Select the text to include in the table.
2. On the Insert tab, click Table and then click Convert Text to Table. The Convert Text to Table dialog box opens (see Figure 9.44).

Figure 9.44. Convert the selected text to a table.
3. Confirm that the number of columns is what you expected. If it is not, your delimiters are off; click Cancel and fix them.
4. Set an AutoFit behavior for the new table. The options here are the same as when creating a table via Insert Table.
![]() For more information about AutoFit options, see “Inserting a Table via the Insert Table Dialog Box,” p. 333.
For more information about AutoFit options, see “Inserting a Table via the Insert Table Dialog Box,” p. 333.
5. Select the delimiter character. Word has probably already made the correct choice, but confirm that it is accurate.
6. Click OK. The text is converted to a Word table.
Converting a Table to Regular Text
You can also go the opposite direction: convert a table to regular text paragraphs. Again, you’re faced with a delimiter character: What character will substitute for the column breaks? The traditional choice is tabs or commas, but you can use any character that you want.
To convert a table to text, follow these steps:
1. Select the entire table.
2. On the Table Tools Layout tab, click Convert to Text. The Convert Table to Text dialog box opens (see Figure 9.45).

Figure 9.45. Convert the table back to regular text.
3. Select the delimiter character to be used.
4. If there are nested tables in the selected table, mark or clear the Convert Nested Tables check box to decide their disposition.
5. Click OK to convert the table to text.
Pasting Tables from Other Office Applications
Several other Office applications utilize row-and-column data organization in various ways. For example, PowerPoint has its own custom table format (similar to that of Word), and Excel has spreadsheets.
Using the Office Clipboard, you can copy and paste data between Office applications seamlessly, creating new Word tables on-the-fly to hold the new data.
To paste from Excel, follow these steps:
1. In Excel, select the cells to be copied and then press Ctrl+C (or click Copy on the Home tab) to copy them to the Clipboard.
2. Switch to Word, position the insertion point in the desired location, and press Ctrl+V (or click Paste on the Home tab) to paste the selection into Word.
3. A Paste Options icon appears next to the pasted selection; click it to open the Paste Options menu (see Figure 9.46).

Figure 9.46. Choose paste options after pasting the selection.
4. Click the desired paste option. You can choose to retain the original formatting, match the document’s formatting, paste as a picture or text only, or create a dynamic link to the original data, with or without formatting.
For even more pasting options, instead of step 2, click the down arrow on the Paste button and choose Paste Special. A Paste Special dialog box opens; from here you can choose to paste in a variety of formats. One of these options, Microsoft Excel Worksheet Object, keeps the data in actual Excel cells, so you can edit it later using Excel’s own commands. This is called embedding (see Figure 9.47).

Figure 9.47. Pasting as a Microsoft Excel Worksheet Object creates an embedded worksheet in Word.
![]() For more information about pasting and linking, see “Linking to Data in Other Files,” p. 612.
For more information about pasting and linking, see “Linking to Data in Other Files,” p. 612.
The procedure is basically the same to paste from PowerPoint (and other applications). Select the table in PowerPoint, copy it to the Clipboard, paste it into Word, and then set any paste options desired.
Embedding Excel Worksheets as Tables
Word’s table feature enables you to perform some basic calculations with formulas and functions, as you saw earlier in this chapter. However, it isn’t as robust as Excel in this regard. If you want the full Excel functionality, consider embedding an Excel worksheet into the document.
One way to embed an Excel worksheet is to copy data from an existing Excel file and then paste it with Paste Special, choosing Microsoft Excel Worksheet Object as the type. (See the preceding section for help with that.)
If the file does not already exist, however, you might find it easier to embed a new blank worksheet in the Word document. Follow these steps to do that:
1. Click in the Word document where you want the embedded worksheet to appear.
2. On the Insert tab, click Table and then click Excel Spreadsheet. A blank spreadsheet appears in the document, and Excel’s commands and tabs appear.
3. Create the worksheet as you would in Excel; when you are done, click outside the worksheet’s area to return to Word.
The resulting Excel object can be formatted, aligned, and otherwise handled like any other object. Right-click it and choose Format Object to open a dialog box with controls for size, layout, border, and other formatting options.