
Web monitoring in Zabbix happens through scenarios that, in turn, consist of steps. Each step consists of a URL and things to check on it. This allows both the checking of a single page and verifying that several pages work properly in succession. The web-monitoring scenarios in Zabbix are assigned to hosts, and they can also be templated.
To see how this works, we could monitor a couple of pages from the open mapping project, OpenStreetMap.
While we could attach a web-monitoring scenario to any of the existing hosts, that wouldn't correctly depict what the scenario is monitoring, so we will create a dedicated host. As there's only one OpenStreetMap website, we won't use templates for this:
- Navigate to Configuration | Hosts, click on Create host, and fill in these values:
-
- Name: OpenStreetMap
- Groups: Web pages
We don't have to change any other values here, so click on the Add button at the bottom.
- We're now ready to create the scenario itself—in the list of hosts, click on Web next to OpenStreetMap and then click on Create web scenario. In the scenario properties, enter these values:
-
- Name: Main page
- New application: Webpage
- Update interval: 300
Now on to the individual steps. The steps for web monitoring are the actual queries performed on the web server; each step has a URL. Switch to the Steps tab and click on Add in the Steps section. Fill in these values in the new popup:
- Name: First page.
- URL: http://www.openstreetmap.org/.
- Required string: Enter OpenStreetMap is a map of the world, created by people like you. This field will search for a particular string in the returned page, and this step will fail if such a string is not found. We can use PCRE regular expressions here, but not global regular expressions, as discussed in Chapter 11, Automating Configuration.
- Required status codes: Enter 200. Here, acceptable HTTP return codes can be specified, separated by commas. Again, if the return code doesn't match, this step will be considered a failure. A status code of 200 means OK.
The form should look like this:

If it does, click on the Add button. Let's also check whether the GPS traces page can be accessed.
Again, click on Add in the Steps section, and enter these values:
- Name: Traces
- URL: http://www.openstreetmap.org/traces/
- Required string: Public GPS traces
- Required status codes: 200
In the Required string field, we entered the text that should be present on the traces page. When done, click on Add.
The final step of the configuration should look like this:

If everything looks fine, click on the Add button at the bottom. Let's see what web monitoring visually looks like. Open Monitoring | Web and click on Main page next to OpenStreetMap. It looks as if all the steps were completed successfully, so we can consider the monitored website to be operating correctly as the Status column happily says OK, or at least the parts that we are monitoring. As with plain items, we can see when the last check was performed:

We also have an overview of how many steps each scenario contains, but that's all very vague. Click on Main page in the Name column—maybe there's more information. Indeed, there is! Here, we can see statistics for each step, such as Speed, Response time, and Response code. And, if that's not enough, there are predefined pretty graphs for Speed and Response time. Note that these are stacked graphs, so we can identify the moments when all of the steps together take more time.
Above the graphs, we can see those familiar timescale controls, the new time selector controls, so these graphs provide the same functionality as anywhere else, including clicking and dragging to zoom in or selecting by time, months, or years:

We can see the relative time each step took and how fast it was compared to the others. In this case, both operations together, on average, take slightly less than a second.
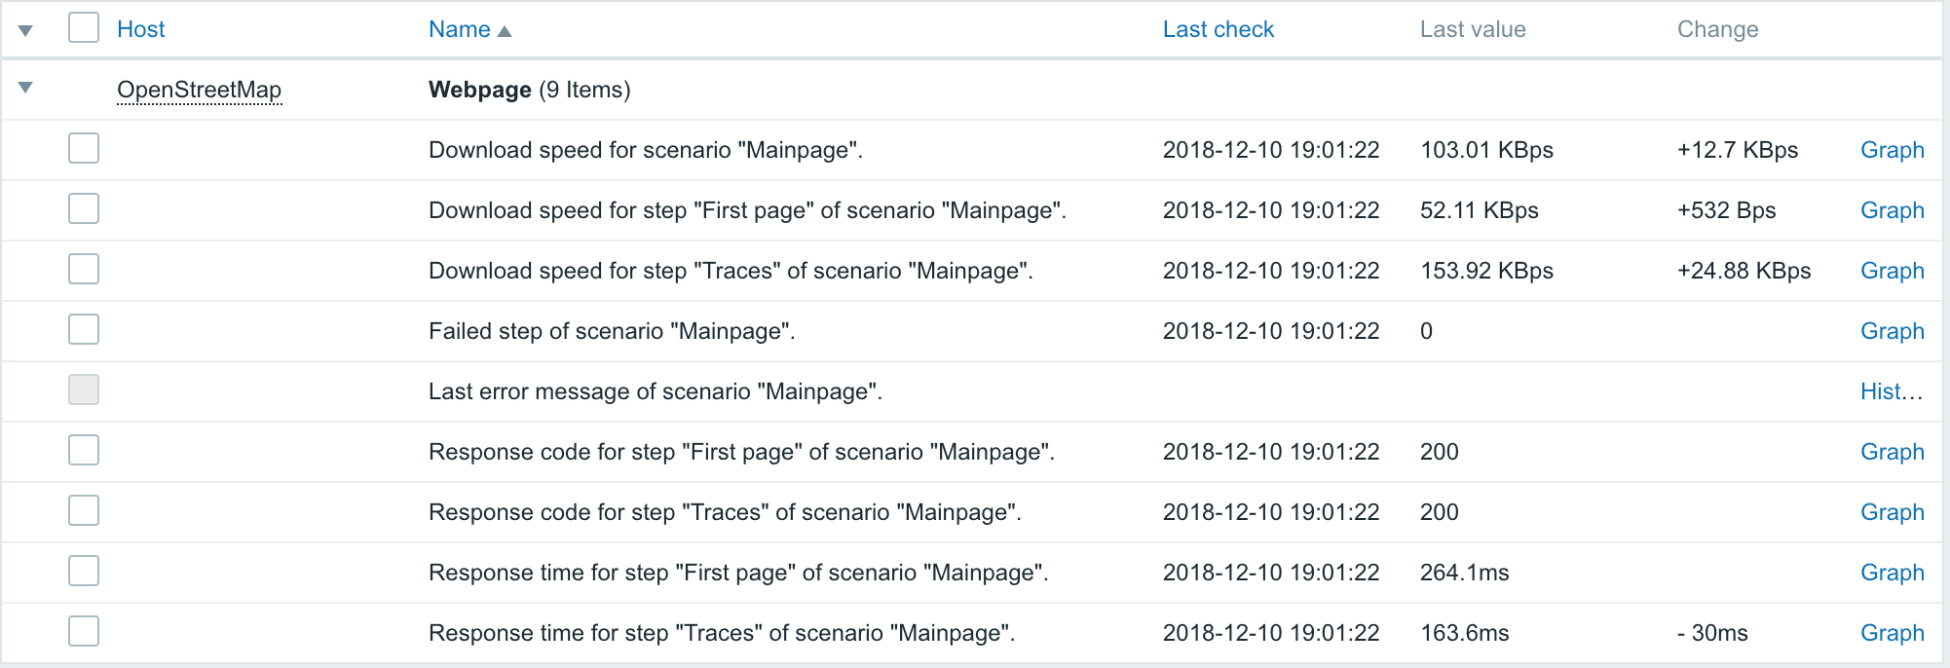
While this view is very nice, it isn't very flexible. Can we have direct access to underlying data, perhaps? Let's visit Monitoring | Latest data to find out. Choose Webpages in the Host groups field, and click on Apply. Items within the Webpage application will show up.
Take a look at the data, all of the collected values are accessible as individual items, including download Speed, Response time, Response code, and even the last error message per scenario.
We can reuse these items, creating whatever graphs we please. If we want we could create a pie chart of response times for each step or a non-stacked graph of download speeds. Of course, as with all items, we get simple graphs without any additional configuration:
There's also a failed step item, which returns 0 if none of the steps failed. As that value is 0 when everything is fine, we can check for it not being 0 in a trigger, and alert based on that.