
The item we created before was a so-called passive item, which means that the Zabbix server initiates a connection to the agent every time a value has to be collected. In most locations, they are simply referred to as being of the Zabbix agent type.
An easy way to remember what's passive or active in Zabbix is to think from the agent's perspective. If the agent connects to the server, it's active. If not, it's passive:

Let's create another passive item to check for the remote host:
- Go to Configuration | Hosts.
- Click on Items next to the host you just created.
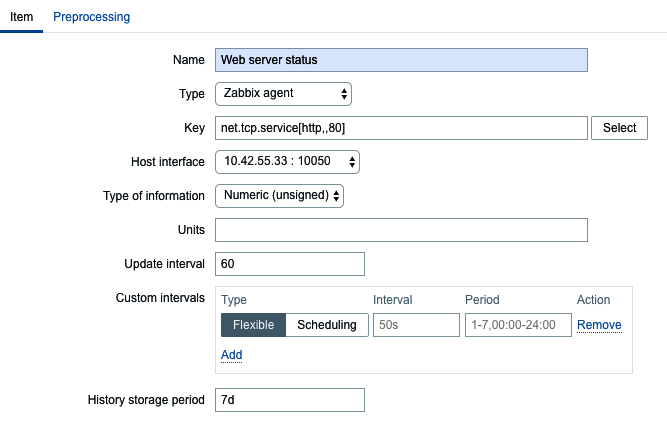
- Click on the Create item button, and fill in the following values. This will create our passive item, so make sure you copy it exact as it is written here. In this item, we will try to monitor our web server status as it runs for the frontend already on port 80:
- Name: Enter Web server status
- Key: Enter net.tcp.service[http,,80] (that's two subsequent commas preceding 80)
- Update interval: Change to 60 from the default (30)—once a minute should be more than enough for our needs
- History storage period: Change to 7 from the default (90)—that's still a whole week of exact per-minute service status records kept
The end result should be as shown in the following screenshot:
But what's up with that ,,80 added to the service name? Click on the Select button next to the Key field. This opens a window with a nice list of keys to choose from, along with a short description of each:

The Type drop-down menu in the upper-right corner will allow you to switch between several item types—we'll discuss the other types later. For now, find net.tcp.service in the list and look at the description. There are two things to learn here:
- Firstly, we didn't actually have to add that 80—it's a port, and given that the default is already 80, adding it was redundant. However, it is useful if you have a service running on a nonstandard port.
- Secondly, there's a key list just one click away to give you a quick hint in case you have forgotten a particular key or what its parameters should be like.
This key, net.tcp.service, is a bit special: it tries to verify that the corresponding service actually does respond in a standard manner, which means the service must be explicitly supported. As of the time of writing, Zabbix supports the following services for the net.tcp.service key:
- FTP
- HTTP
- HTTPS
- IMAP
- LDAP
- NNTP
- POP
- SMTP
- SSH
- TCP
- Telnet
- NTP
The TCP service is a bit special in its own way. While others perform service-specific checks, TCP is not really a service; it just checks the TCP connection. It's closer to a key you can see a couple of rows above in the item list, net.tcp.port. As the description says, this one just tries to open a TCP connection to any arbitrary port without performing any service-specific checks on the returned value. If you try to use an arbitrary service string that is not supported, you would simply get an error message saying that such an item key is not supported.
Feel free to look at the other available keys—we will use a couple of them later as well—then close this popup and click on the Add button at the bottom. You have probably already noticed the green strip at the top of the screen when some operation successfully completes. In older versions there was a control called Details available. Since Zabbix 4.0 this has changed and we will not see any details, only that the item was added:

Now, we could go over to Monitoring | Latest data and wait for the values appearing there, but that would be useless. Instead, after a couple of minutes, you should visit Configuration | Hosts. Depending on your network configuration, you might see a red ZBX marker next to this host. This icon represents errors that have occurred when attempting to gather data from a passive Zabbix agent.
To see the actual error message, move your mouse cursor over the icon, and a tooltip will open. Clicking on the error icon will make the tooltip permanent and allow you to copy the error message:

If you see an error message similar to Get value from agent failed: cannot connect to [[192.168.1.100]:10050]: [111] Connection refused (most likely with a different IP address), it means that the Zabbix server was unable to connect to the agent daemon port. This can happen because of a variety of reasons, the most common being a firewall—either a network one between the Zabbix server and the remote host or a local one on the remote host. Make sure to allow connections from the Zabbix server to the monitored machine on port 10050. If you see something like what was displayed in the previous screenshot with no route to host then you probably made a configuration mistake and the Zabbix server cannot connect to the host with the Zabbix agent.
If you did this correctly (or if you did not have a firewall blocking the connection), you could again go to Monitoring | Latest data—only that would be pointless, again. To see why, refresh the host list. Soon, you should see the Zabbix agent status icon turn red again, and moving your mouse cursor over it will reveal another error message, Received empty response from Zabbix Agent at [192.168.1.100], assuming that the agent dropped the connection because of access permissions. Now that's different. What access permissions is it talking about, and why did they work for our first host?
From the Zabbix server, execute this (replace the IP address with the correct one from your host):
$ telnet 192.168.1.100 10050
Replace the IP address with your remote host's address. You should see the following output, and the connection should immediately be closed:
Trying 192.168.1.100...
Connected to 192.168.1.100.
Escape character is '^]'.
Connection closed by foreign host.
Now, try the same with localhost:
$ telnet localhost 10050
Trying 127.0.0.1...
Connected to localhost.
Escape character is '^]'.
Notice how, this time, the connection is not closed immediately, so there's a difference in the configuration. The connection will most likely be closed a bit later—three seconds later, to be more specific. If this does not happen for some reason, press Ctrl + ], as instructed, then enter quit—this should close the connection:
^]
telnet> quit
Connection closed.
It turns out that configuring the Zabbix agent daemon on another machine is going to be a tiny bit harder than before.
As opposed to the installation on the Zabbix server, we have to edit the agent daemon configuration file on the remote machine. Open zabbix_agentd.conf as root in your favorite editor and take a look at the Server parameter. It is currently set to 127.0.0.1, which is the reason we didn't have to touch it on the Zabbix server. As the comment states, this parameter should contain the Zabbix server IP address, so replace 127.0.0.1 with the correct server address here.
Save the file and restart the agent daemon. How exactly this is done depends on the installation method, again. If you installed from the distribution packages, the following will most likely work:
# systemctl restart zabbix-agentd
If you installed from the source and did not create or adapt some init scripts, you will have to manually stop and start the agent process:
# killall -15 zabbix_agentd; sleep 3; zabbix_agentd
The preceding command will stop all processes called zabbix_agentd on the system. This should not be used if multiple agents are running on the system. Additionally, the delay of 3 seconds should be more than enough in most cases, but if the agent does not start up after this, check its log file for potential reasons. It is also possible that you have to specify the location of the zabbix_agentd binary if this file is not in a location that is in your path, for example, /usr/bin/zabbix_agentd.
To verify the change, try Telnetting to the remote machine again:
$ telnet 192.168.1.100 10050
This time, the outcome should be the same as we had with the localhost—the connection should be opened and then closed approximately three seconds later.
Finally, it should be worth opening Monitoring | Latest data. We will only see our previously created item, though; the reason is the same filter we changed earlier. We explicitly filtered for one host; hence, the second host we created does not show up at all.
In the filter, which should still be expanded, clear the host field and select Linux servers in the Host groups field, and then click on Apply.
In many filter fields in Zabbix, we can either start typing and get a list of matching entries or click on the Select button to see a list of all available entities. Typing in is a very convenient way when we know at least part of the name. Being able to see the list is helpful when working in an environment we are less familiar with.
We should see two monitored hosts now, each having a single item:

Notice how we can click the triangle icon next to each entry or in the header to collapse and expand either an individual entry or all of the entries.