
Aging of lithium-ion batteries for electric vehicles
M.A. Danzer1; V. Liebau2; F. Maglia2 1 Zentrum für Sonnenenergie- und Wasserstoff-Forschung Baden-Württemberg, Ulm, Germany;
2 BMW Group, Munich, Germany
Abstract
The lifetime of Li-ion batteries is of the highest importance for electric vehicles for their reliability, for their economic competitiveness, and finally for customer satisfaction. This chapter introduces the effects of aging in automotive batteries. Mechanisms and root causes on different levels—material, cell, and pack—are discussed. Overviews of test methods and field data, modeling and simulation approaches, and diagnostic methods are given. Finally, ways and means to reach and exceed the lifetime goals of automotive batteries are proposed.
14.1 Introduction
In a discussion about the aging of automotive batteries, it is worthwhile to look back at the history of mobility. When the rise of the automobile started in the early twentieth century, two drivetrain concepts competed with each other for predominance: the internal combustion engine and the electric motor together with a battery (see Figure 14.1). Reasons that electro mobility did not prevail at the time (even though electric vehicles (EVs) were perceived as cleaner, quieter, and easier to drive) were short driving ranges and high costs as well as long charging times, fast degradation, and short lifetimes of the batteries.
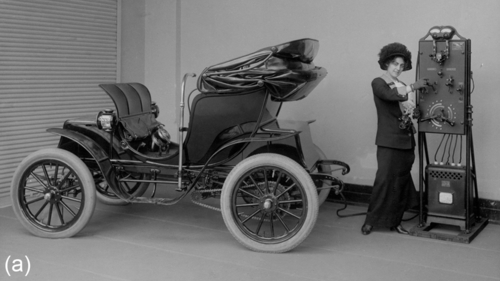

At the beginning of the twenty-first century, electro mobility is making a second attempt at the mass market, offering a quiet and often dynamic driving experience without local emissions (see Figure 14.1). The expectations are high, from politics, original equipment manufacturers (OEMs), and customers. But the challenges for market introduction and penetration still remain the same: range, cost, safety, and lifetime of the battery. EVs need to last at least 8 years without experiencing a significant reduction of power and range with the same availability and reliability we are used to in our automobiles.
14.2 Aging effects
Although less rapid than in other battery technologies, Li-ion batteries show a deterioration of their performance over time. From the point of view of vehicle applications, this produces a detrimental effect on several operating parameters including reduction of efficiency (originating from the increase in charging losses), reduction in the driving range, and reduction of power for acceleration and recuperation.
The degradation of lithium-ion battery performance can be described either in terms of loss of available energy or power. Available energy is lost, when the active material inside the battery has been transformed into inactive phases, and thus the capacity is decreased. Power (i.e., rate capability), on the other hand, is mainly reduced as an effect of the increase of the battery internal resistance (Bandhauer et al., 2011). The decrease of energy and/or power under nonoperating conditions is typically referred to as calendar aging, whereas cycle aging refers to the same effects when applied to charging and discharging.
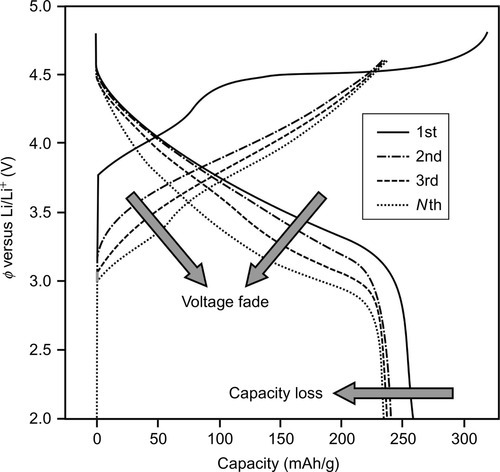
The battery state of health (SOH) identifies the battery's ability to store energy and deliver power relative to the beginning of life (BOL) conditions, that is, after the manufacturing of a battery, which has its maximum utility for a specified application (Lu et al., 2013). SOH is typically evaluated on the basis of the experimental determination of the battery capacity C and/or internal resistance R. One should remember that voltage fade strongly contributes to energy decrease, in particular for cells containing layered–layered (LL) cathode materials (e.g., xLi2MnO3(1 − x)LiMn0.33Ni0.33Co0.33O2). Figure 14.2 shows typical charge/discharge curves, measured at a constant current rate between 2.0 and 4.6 cutoff voltage limits, for a cell containing an LL cathode. As an effect of cycling, not only the maximum capacity value decreases, but also a sharp lowering of the overall voltage profile (voltage fade) can be observed.
Equations (14.1) and (14.2) show a definition of SOH based on R and C, respectively:

where Ri and Ci refer to the ith resistance and capacity measurement, respectively, and R0 and C0 refer to the BOL value.1
In general terms, the end of a battery's life (EOL) is considered to be reached when the battery has lost its utility for the specified application. Practically, EOL is defined when the energy or the power is reduced below a certain percentage (typically 80%) of the BOL performance (Lu et al., 2013). The EOL condition of high-energy batteries, such as those employed in EV, is typically expressed in terms of the capacity fade, whereas that of high-power batteries, such as those employed in hybrid electric vehicles (HEVs), by the increase of the internal resistance. For batteries used in plug-in hybrid electric vehicles (PHEVs), which require both sufficient energy and power, both capacity and internal resistance should be considered (Figure 14.3).

Although the definition of the SOH and EOL for a lithium-ion battery can appear rather trivial, their experimental determination is a complex task. Several different methods for the SOH determination have been described in the literature. Comparisons between SOH estimates strongly depend on the test equipment and the methods employed (Lu et al., 2013; Zhang and Lee, 2011).
In the information to follow, we survey the processes responsible for the capacity, impedance, and voltage variations that concur to the degradation of the battery performance. These originate not only from the chemical and electrochemical processes that take place at cell components (electrodes, electrolyte, separator, etc.), but also from the degradation of auxiliary cell and battery elements as well as from the lack of uniformity that unavoidably occurs in battery modules and packs. The investigation of the aging mechanisms, at both the cell- and battery-pack levels, is further complicated by the fact that, if we exclude extreme or abusive conditions where the overall degradation process can be addressed to a single root cause, several processes take place at the same time, with some of them being highly coupled.
Moreover, different from other applications (e.g., for electronic devices), lithium-ion batteries for vehicle applications will experience a variable combination of usage and rest periods over a broad range of current densities, temperatures, and states of charge.
14.3 Aging mechanisms and root causes
The fundamental aging mechanisms, originating from physicochemical transformations occurring within the electrode, the electrolyte, and the interfaces between them, have been the focus of countless investigations, and the main results have been published in several valuable review papers (Arora et al., 1998; Sarre et al., 2004; Wohlfahrt-Mehrens et al., 2004; Vetter et al., 2005; Marom et al., 2011). A detailed description of all the possible aging processes that can take place within a lithium-ion cell (Figure 14.4) is beyond the scope of this chapter. The following discussion will therefore be limited to the aspects that are expected to be more relevant for the cell chemistries employed in EV, PHEV, and HEV. Particular attention will be paid to the role of aging stressors such as high and low temperatures, state of charge (SOC), cycling rate, depth of discharge (DOD), as they are known to play a key role in automotive applications.

The aging mechanisms exemplified in Figure 14.4 can be broadly grouped into four categories: (1) surface film formation, including anodic and cathodic solid electrolyte interphase (SEI) and lithium plating; (2) structural (bulk) changes, including cation disorder, phase transitions, and the like; (3) mechanical changes, including particle cracking, electromechanical grinding, gas formation, and more; and (4) parasitic reactions including current collector corrosion as well as binder degradation.
Loss of cyclable lithium due to anodic SEI formation, phase transformations inside the bulk of the cathode materials, transition metals dissolution, and loss of contact between particles can be considered as the main processes that contribute to capacity loss (Arora et al., 1998; Vetter et al., 2005). On the other hand, impedance rise is mainly promoted by the formation of surface films showing poor transport properties. Although the formation of surface films typically occurs on both the anode and cathode particles, as well as on the binder materials, the cathode surface films are generally held responsible for the largest amount of the cell impedance, owing to their higher resistivity (Wohlfahrt-Mehrens et al., 2004; Vetter et al., 2005).
If we consider the lithium-ion cells typically employed in vehicle applications, we can observe that, apart from differences in the amount and nature of binders and additives, the compositions of the anode (graphite) and the electrolyte (LiPF6 in mixed carbonate solution) are almost identical for all the battery producers and the corresponding aging mechanisms are therefore expected to be similar.
On the contrary, at least four different cathode materials have been employed in recent years: LiFePO4 (LFP), Li(NixMnyCoz)O2 (NMC), Li(Ni0.8Co0.15AlO.05)O2 (NCA), and LiMn2O4 (LMO). In addition, the use of slightly different cathode compositions, as well as the blending of different cathodic materials (typically NMC–LMO blends), has been reported (Lu et al., 2013).
The impact of the individual aging mechanisms shown in Figure 14.4 varies considerably when different cathode materials are considered. As a consequence, the relative balance of anode and cathode on the overall degradation process can also drastically change. As an example, the aging of cells employing the fairly stable lithium iron phosphate (LFP) cathode generally points to the loss of cyclable lithium at the anodic side as the main aging process (Striebel et al., 2003). On the contrary, cells employing nickel manganese cobalt (NMC) oxides are characterized by a large impedance rise at the cathode side, due to the reactivity between NMC and the electrolyte (Martha et al., 2009).
Another example of the large differences that arise from the use of different cathode materials concerns transition metal dissolution. This degradation mechanism is considered particularly detrimental because it not only decreases the amount of cathode active material, but also contributes to the degradation of the anodic SEI due to the deposition of transition metals at low anode potentials. Although this affects to some extent the performance of all the cell chemistries, it was shown to be particularly severe for lithium manganese oxide (LMO) and LFP, which makes LFP- and LMO-based cells prone to calendar aging (Vetter et al., 2005; Koltypin et al., 2007). On the other hand, aging mechanisms that primarily involve bulk processes are critical for those cathodes that undergo phase transitions at specific voltages (e.g., LMO, NMC, and NCA) or that are prone to antisite cation defects (NCA and NMC; Manthiram et al., 2006).
Although the present discussion exclusively concerns the materials currently employed in lithium batteries, it is important to emphasize that whenever new electrodes or electrolytes will be considered in the future, changes of the aforementioned picture should be expected and even different, new aging mechanisms might have to be taken into account.
Before considering in more detail the accelerating effect that the battery operating parameters have on the aging kinetic, we briefly mention that one aging stressor (e.g., chemical impurities) is always present in all cell chemistries. In particular, the presence of humidity is considered highly detrimental as water reacts with most of the common electrolyte containing LiPF6 (Lux et al., 2012) according to the following reaction:
Reaction (14.3) not only degrades the electrolyte and reduces its concentration, but also produces acidic species (HF in this example) that enormously increase the transition metals dissolution rate at the cathode side and negatively interact with the SEI formation at the anode. Moreover, water reduction at the anode contributes to the pressure buildup inside the cell. As a consequence, batteries characterized by high levels of water impurities show poorer performance, in particular for what concerns capacity fade (Li and Lucht, 2007). It should therefore always be considered that a trustworthy comparison between the aging properties of different cells or chemistries can only be done when comparable water contents (as well as of other impurities that might be present in significant amounts) are taken into account (Aurbach et al., 2007; Chen and Dahn, 2004).
14.3.1 Effect of temperature on cell aging
According to the US Department of Energy FreedomCAR and Vehicle Technologies Program, an operation temperature range between − 30 and 52 °C and a survival temperature range between − 46 and 66 °C should be achieved for car batteries (Bandhauer et al., 2011). Such large temperature range clearly represents a critical factor that contributes to the shortening of battery lifetime.
If the understanding of the aging mechanisms can be sometimes puzzling due to the difficulties to develop a coherent picture of the aging processes, especially when different chemistries are considered, the negative influence that high temperatures exert on aging is similar for all the electrode and electrolyte combinations (Vetter et al., 2005). Almost all aging mechanisms, under both cycling and storage conditions, are accelerated at high temperatures, including (1) self-discharge of the anode compartment during storage conditions, (2) loss of cyclable lithium due to SEI dissolution– reconstruction as well as phase changes within the SEI, (3) surface film formation at the cathode, (4) electrolyte oxidation, and (5) transition metal dissolution from the cathode. Taking into account that the above processes are thermally activated chemical reactions, it is not surprising that both resistance increase and capacity loss show Arrhenius behavior (Fleckenstein et al., 2011; Bloom et al., 2001; Ramadass et al., 2003).
In the lower temperature regime, on the other hand, the reduced elasticity of the electrode structures, in particular of the cathode, leads to integrity disruption during prolonged charging–discharging cycles. Moreover, lithium plating can lead to irreversible losses (together with safety issues) when fast charging is performed below 20 °C (Arora et al., 1998; Vetter et al., 2005).
The evaluation of the effect of temperature on aging is a complex task, since both external heat sources (Figure 14.5) (e.g., ambient temperature and radiative heating due to prolonged parking in the sun) and internal heat generation (and dissipation) must be taken into account (Bandhauer et al., 2011). For what concerns internal heat generation, activation (interfacial kinetic), concentration (species transport), and ohmic sources play a fundamental role. Moreover, it should also be considered, that the contribution of the internal heat sources is not only dependent on the transport properties of the individual materials employed (conductivities, diffusion coefficients, etc.), but also dependent on the specific working conditions, in particular, the charge and discharge rates (Bandhauer et al., 2011).

14.3.2 Effect of SOC and SOC variation on cell aging
Also the battery SOC has been reported to greatly influence the cell aging, both under cycle and storage conditions (Arora et al., 1998). This is particularly relevant for battery vehicle applications where a large variety of cycling and charging strategies are employed. Cycling an HEV battery at a lower average SOC, as an example, impacts on the battery lifetime less than cycling at a higher average SOC, while minimizing rest periods at high SOCs in an EV battery should also positively impact on its lifetime (Lunz et al., 2012).
High SOC values reduce the stability of both electrodes (including the binder) and the electrolyte. The latter decomposes at high SOC values at the contact surface with the electrodes, leading to lithium consumption and to the growth of insulating layers on the electrode particle surfaces. As a consequence both capacity loss and impedance rise are accelerated. Decomposition of the binder causing degradation of the electrode mass has also been observed. Current collector corrosion has been, on the other hand, reported as the main detrimental effect at low SOC values (Arora et al., 1998).
Although the cycling conditions are typically controlled so that the voltage limits dictated by the stability of the cell components are not exceeded, it is of fundamental importance for the preservation of the battery lifetime to avoid overcharge conditions that could originate, for example, from thermal and/or electrochemical inhomogeneities within the cell itself or within the battery pack, as described below. When such voltage limits are exceeded, the aging kinetic is generally enormously accelerated. Particularly critical in this respect is the cathode stability. It has been reported that an overcharge of only few tens of mV could lead to dramatic consequences on the cathode lifetime (Arora et al., 1998; Vetter et al., 2005; Manthiram et al., 2006). Both structural and chemical instabilities concur to the cathode degradation. Almost all the cathode materials undergo phase transitions above or below some voltage limits with severe consequences on their performance due to the formation of inactive phases, in some cases coupled with transition metal ion dissolution. The chemical instabilities, on the other hand, result in the oxidation of O2 − leading to oxygen loss toward the electrolyte (Manthiram et al., 2006). For what concerns the anode side, overcharge could lead to solvent intercalation and gas evolution with the consequent degradation of the graphite particle integrity (Arora et al., 1998).
Not only the absolute value of the SOC affects the battery lifetime, but also the extent of its variation during the battery operation (ΔSOC or DOD), in particular for HEV applications where a large number of cycles in a narrow SOC (e.g., 45–55%) range is required. It has been reported that, for most cell chemistries, battery lifetime increases exponentially with a reduction of ΔSOC (Bloom et al., 2001).
14.3.3 Effect of charge–discharge rate on cell aging
The use of high charging and discharging rates has been observed to produce both an increase of the internal resistance and a decrease of the cell capacity. High currents produce a localized temperature that can lead to modification and disruption of the electrode surface layers (Vetter et al., 2005; Bloom et al., 2001; Ramadass et al., 2003). Moreover, as the charging/discharging rate is increased, the chemical transformation required at the electrodes (at the cathode in particular) cannot keep pace with the current drawn. This may result in the onset of steep concentration gradients, unwanted chemical reactions, as well as changes in the morphology of the electrodes that might compromise their integrity, this affecting both the internal impedance and the capacity of the cell. During excessively fast charging in particular at low temperatures, lithium plating at the anode has to be expected. At the same time, the operation at high voltages as a consequence of polarization effects at fast charging will also accelerate aging, as we have discussed.
14.4 Cell design and cell integrity
In addition to materials and cell chemistry other factors such as cell design, cell size, inhomogeneities, and cell integrity influence cell aging and system reliability. Relatively little information is available on the impact of cell design on aging as most of the available literature discusses the aging process in terms of mean values of the cell states and operating conditions (e.g., temperature, current density, and SOC), neglecting the role of gradients within the cell's jelly roll (Fleckenstein et al., 2011; Gerschler et al., 2009).
This scenario is clearly oversimplified inasmuch as heat is produced inside the cell during cycling due to Joule heating and entropy changes. Temperature gradients thereby build up between the warmer inside region of the jelly roll and the cell surface, where heat dissipation takes place (Fleckenstein et al., 2011).
Based on thermal–electrical coupling, we can also expect that the warmer inner regions will exhibit lower electric impedance, leading to higher current densities and an even higher heat generation (Fleckenstein et al., 2011). Also SOC differences will develop, due to both temperature gradients and charge/discharge load imbalances. As previously discussed, high temperature, current density, and SOC are all factors that accelerate aging, leading to a higher degradation rate in the inner region of the jelly roll and therewith different states of health across the cell. As a consequence, an overall faster aging behavior for the entire cell will occur compared to a hypothetical cell with uniform conditions throughout the cell equal to the averaged properties (Fleckenstein et al., 2011). In the end, the lifetime of the full cell will be determined by its weakest part.
Figure 14.6 shows snapshots of the simulated temperature, current density, and SOC during cycling inside a cylindrical cell. Such distributions will indeed not only depend on the cell chemistry, material property, and operating conditions, but also depend on the cell design and the cell size. In particular, different aging behavior can be expected for the different battery types and designs used in vehicle batteries: different formats (cylindrical, pouch, and prismatic), number of jelly rolls, and jelly roll geometry, just to mention the most obvious ones.

Energy density requirements on a cell level are another example of an extremely important factor influencing battery aging that has been long overlooked. The more demanding requirement in terms of mileage for EV has shown that an increase of specific energy is typically associated with a dramatic decrease in the battery lifetime. Energy density can typically be increased for a given cell chemistry by increasing the electrode thickness, by decreasing its porosity, or by reducing the content of inactive components (binder and conductive carbon; Zheng et al., 2012; Lu et al., 2011). Highly tortuous transport paths in thick and dense electrodes can lead to severe transport losses, which not only negatively affect the cell performance, but also reduce its lifetime. Among these two causes, thickness was reported to have a more pronounced negative effect on aging compared to density (Choi et al., 2013).
Two factors are considered to be the main reasons for an increased aging rate in high-energy electrodes: (1) the higher internal resistance, in particular, for lithium-ion transport in the liquid phase (i.e., tortuosity and diffusion lengths), causes an increase of concentration gradients and a shift of electrode potentials that ultimately lead to higher rates of side reactions during electrochemical cycles, including electrolyte oxidation and irreversible phase transformation within the solid phase (Manthiram et al., 2006; Choi and Lim, 2002) and (2) the loss of mechanical integrity of the electrode. Stress accumulation from volume changes during lithium insertion and extraction is believed to be more difficult to be released as the electrodes become thicker. The stress accumulation in thicker electrodes leads to cracks or fractures of the electrode laminate (Park et al., 2011), causing particle isolation and ultimately leading to capacity loss and impedance growth of the electrode.
Cell integrity issues are seldom the focus of scientific publications, and any nonproprietary information on this topic is rather scanty. Nonetheless, within the battery cells numerous components are present that may undergo aging and contribute to lifetime shortening. These include cell housing, seals, gaskets, valves, vents, insulation foils, and the like. When discussing the impact of these elements on a battery lifetime, a distinction should be made between true aging processes, occurring upon time during prolonged use and/or storage conditions, and failure modes caused by poor mechanical design, low-quality materials, or inadequately specified tolerances. The latter failure modes are frequently responsible for early cell failure, more commonly indicated as “infant mortality.” Rupture plates (or vents), as an example, are expected to face corrosion issues with time since their thickness is typically only in the range of 200 μm, or to rip as an effect of prolonged mechanical stress due to vibrations. They have been observed to open earlier than specified due to tolerances in the manufacturing process. Particle contamination, particle intrusion during the assembly (possibly leading to internal short circuits), and cracks in the cell case are other examples of infant mortality causes.
Long-term aging effects, on the other hand, include (1) the embrittlement of the seals closing the cells, due to both thermal effects and chemical reactions that can eventually lead to electrolyte loss over time; (2) the corrosion of the welding seams, especially the Al–Cu contact area of the friction welding seam in the cathode terminal, corrosion of pouch foils due to a polarization of the Al layer to the negative potential of the cell; and (3) the occurrence of leakage current due to thermal shrinkage (in the case of insulation foils) and loss of electrochemical stability of the insulation foils' materials.
14.5 Aging of battery packs
The typical operating voltage of Li-ion cells ranges between 2.7 and 4.2 V, depending on the specific anode and cathode materials employed (Goodenough and Kim, 2010). To reach the practical voltages (typically between 200 and 400 V) and capacities required for vehicle applications, cells are connected in series and parallel to form battery modules and the battery pack (Wu et al., 2013).
The multicell nature of battery systems is not without consequences to lifetime and aging. Upon failure of a single cell, the replacement of the entire module or pack might be necessary. The replacement of one individual cell is, in many cases, not considered a viable option since the lack of uniformity introduced by a fresh cell in an aged battery pack may lead to premature failure.
Predicting lifetime and understanding the aging processes occurring within a battery module or pack are extremely complex tasks that require knowledge that goes beyond understanding aging at the cell level (Wu et al., 2013). The most relevant aspect that differentiates aging of a battery system from that of a single cell is cell-to-cell inhomogeneity (Wu et al., 2013; Bandhauer et al., 2011; Dubarry and Liaw, 2009; Dubarry et al., 2009; Paul et al., 2013; Lu et al., 2013; Offer et al., 2012; Verbrugge, 1995).
Differences between the cells can have dramatic consequences on the expectation of a battery's lifetime, since the capacity of a battery system consisting of cells in a series connection is determined by the capacity of the weakest cell. The EOL criterion based on residual capacity (C = 80% C0), for example, will be met earlier than for an ideal uniform pack (Paul et al., 2013; Lu et al., 2013). In other words, no matter how efficiently the battery management system (BMS) operates, the lifetime of a multicell battery will always be shorter than that quoted for a single cell.
14.5.1 Cell-to-cell inhomogeneities at BOL
The simplest source of inhomogeneity, or lack of uniformity, in battery systems stems from cell-to-cell variations already present at the BOL, as a consequence of the tolerances of the production line. These differences can cover a large range of properties including capacity, impedance, weight, volume, and the like. Differences in the amount of active material, possibly caused by either inhomogeneities in ink mixing and calendaring or to deviations in the electrode footprint during cell fabrication, have been reported to be particularly common (Dubarry and Liaw, 2009; Dubarry et al., 2009).
14.5.2 Cell-to-cell inhomogeneities during calendar aging
In addition to the variance already present at BOL, a spreading of capacity and internal resistance values between the cells always occurs, both under calendar and cycling aging conditions (Figure 14.7; Paul et al., 2013; Lu et al., 2013).
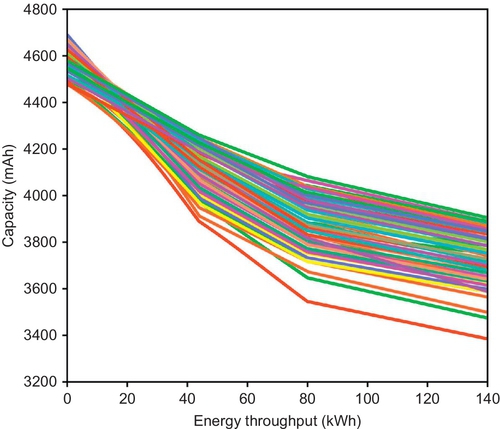
The origin of this spreading can be identified in the thermal and electrical gradients within the battery pack (Paul et al., 2013; Lu et al., 2013). Although the presence of such gradients can be, to a certain extent, controlled and minimized by an optimized selection of the battery pack geometry, efficient cooling systems, low-resistance interconnects, and the like, it cannot be completely removed.
During nonoperating conditions (calendar aging), differences in self-discharge rates among different cells have the largest impact (Lu et al., 2013). As discussed previously, calendar aging is highly dependent on both temperature and SOC. We can therefore expect that the spreading rate will be increased by a higher variation in the cell-to-cell initial capacity (and hence SOC). Moreover a poor location and/or thermal insulation of the battery pack inside the vehicle will contribute to the buildup of temperature gradients, in particular, under sunlight irradiation.
14.5.3 Cell-to-cell inhomogeneities during cycle aging
During cycle aging, further complications will arise due to the coupling between electrical and heat balances (Wu et al., 2013; Dubarry and Liaw, 2009; Dubarry et al., 2009; Paul et al., 2013; Lu et al., 2013; Verbrugge, 1995). On the one hand, the temperature gradients among the cells will make the hotter cells discharge and charge faster than the colder ones. On the other hand, temperature gradients will build up as a consequence of the differences in the internal and external (with respect to the cell) resistances and loads (Wu et al., 2013; Bandhauer et al., 2011; Dubarry and Liaw, 2009; Dubarry et al., 2009; Paul et al., 2013; Lu et al., 2013; Offer et al., 2012; Verbrugge, 1995).
Although differences exist between different cell chemistries, the internal heat generation is generally strongly dependent on current and SOC, with a dramatic increase in the heat rate production near the end of discharge and charge processes (Bandhauer et al., 2011). Cell-to-cell SOC variations are therefore expected to cause uneven heat generation within the battery system.
External losses have often been overlooked in the scientific literature even though the heat introduced into the cell through Joule heating at interconnect resistance can be of the same magnitude of that generated by internal processes. Due to interconnect resistances, the load of a cell in a large battery pack will depend on the cell position relative to the point at which the external load is applied, with cells nearer the pack terminals experiencing a greater load; those further away from load terminal experience higher interconnect resistance and thereby provide less current (Wu et al., 2013). For poor electrode–collector connections (Taheri et al., 2011) and large battery packs, large load imbalances should therefore be expected, ultimately leading to inhomogeneous heat generation within the battery pack, and to the acceleration of capacity and power fade of the hotter cells (Wu et al., 2013; Taheri et al., 2011). For what concerns vehicle applications, cell-to-cell differences will be particularly detrimental when the cells are subject to rapid charge and discharge cycles, as in batteries employed for HEV applications.
14.6 Testing
The validation of lithium-ion cells, which are designated for the use in pure electric, hybrid, and plug-in hybrid vehicles, is an important approach for the suitability and operation requirements of the electric power train. A comprehensive qualification not only of single cells but also for modules and battery packs is necessary to evaluate performance, lifetime, and also safety aspects of this technology.
For testing not only a variety of battery characteristics (stress parameters) and the intended operating range has to be considered, but also the comparability of the specified test conditions, and as a consequence, also the comparability of the generated data. Ideally this should be effective for every single component (as cell, module, or battery pack) and also among one another for a specific test. For this reason intermediate tests are helpful where capacity and internal resistance are checked periodically under identical experimental conditions.
The main objective of validation is a general understanding of performance and lifetime behavior of lithium-ion cells with respect to time, temperature, and SOC (safety aspects are not being considered here). Therefore a variety of specifications are available for automotive applications.
The test specifications for automotive battery applications were developed in collaboration with automotive organizations, such as VDA, EUCAR, SAE, and USCAR, with test institutes and standardization organisations (EN 62660-1, 2011; FreedomCar, US Department of Energy, 2010; ISO, 12405-1, 2011; ISO, 12405-2, 2012; SAE J2288, 2008). Further, there are characteristic test manuals of OEMs, suppliers, and users.
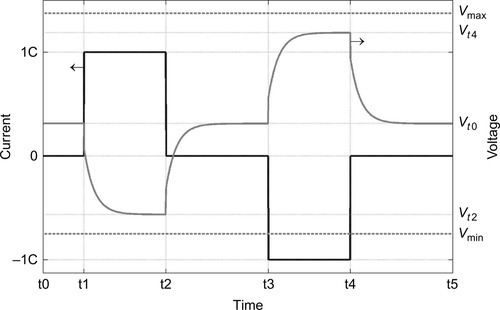
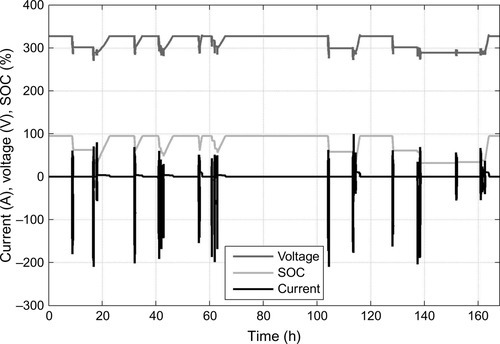
In addition to the lifetime validation consisting of simple cycling experiments (full charge and discharge cycles), pulse power experiments (see Figure 14.8), resistance, and capacity checkups of cells and modules are carried out at different temperatures and various states of charge with different current pulses for a certain time interval. Further, defined (synthetic) load profiles (see Figure 14.9), which mimic customer behavior, are integral parts of the validation program and also storage tests with respect to temperature and SOC to evaluate calendar aging are performed. Tests are carried out in the intended operating range within cell specifications until an end-of-life criterion is reached. These characteristics are, for example, maximum and minimum voltage, pulse and continuous current, operating and safety cutoff temperature, as well as assigned values for SOC ranges depending on the vehicle application. In general, the end-of-life criterion of lithium-ion batteries in automotive applications is defined as 80% of its original capacity. Therefore, the aim for testing should be at least the loss of 20% capacity.
In additional to tests of single cells, the validation of battery modules and the whole battery system is necessary to investigate the interaction of all components and the functionality within the electric power train. Furthermore, different test sites and integration levels have to be considered. In addition to cell and module tests in the lab, drivetrain and vehicle tests on dynamometers, and real-world test drives are conducted. Thereby customer-oriented driving profiles can be investigated in consideration of the interplay of the whole electrified power train (see Section 14.7 on field data).
Battery testing is time- and cost-consuming, especially lifetime testing, which occupies test channels for several months. For vehicle applications aging projections according to the lifetime expectation of up to 10 years are requested. Therefore, accelerated tests are of special interest for lifetime validation. Acceleration factors include higher temperature and SOC, as well as shortened load profiles by reducing rest times. Acceleration of aging tests has to be done carefully to prevent the activation of different aging mechanisms.
One approach taken to testing to encompass the complexity of aging and at the same time to limit the test expenses is the use of statistical methods as design of experiment. With respect to the analysis of interactions of stress parameters, test plans can be generated based on the statistical experimental design; by generating a test matrix, the combination of different load parameters and their interactions are taken into account. The aim of this method is to perform as few experiments as possible to reduce cost and time but nevertheless to preserve the ability to evaluate the role of single factors as well as their interactions (Ronniger, 2013).
By means of defined stress tests, degradation processes and their cause-and-effect relationships in the cells, reliable aging and lifetime models on cell and storage level should be generated. This allows the specification of new and well-defined accelerating test methods for fast quality testing of the batteries and makes the validation of EV possible.
In addition to accelerating testing, the challenges of validation are the interpretation of the results and the explanation of the influence of single stress factors, respectively, because of the interactions of load parameters. The dependencies of the main influencing variables can be displayed within a cause-and-effect diagram. Figure 14.10 shows the combination and complexity of the interactions of lifetime-influencing parameters. Even if the focus of testing is on a single (stress) parameter there are effects related to this investigated parameter; for example, a higher current implicates a temperature increase through self-heating in the cell, which, in effect, influences the internal resistance.

For the automotive industry it is an urgent need to understand the root causes of lithium-ion battery aging and failures, especially with respect to customer satisfaction and prognosis of warranty and goodwill costs. Therefore, the validation of lithium-ion cells and packs is indispensable.
14.7 Field data
The real-world behavior of electrified vehicles and their battery is of great interest to several areas of automotive development. Vehicles on the road can provide a large number of helpful information on battery aging. Collecting field data gives important information on the state of the battery system and its aging behavior as an effect of real-world usage and of customer-specific driving characteristics.
Variables gathered can be vehicle specific such as mileage and consumption or battery specific such as charge and energy throughput, DOD, capacity, internal resistance, SOC, and SOH, temperature (spread), or max/min voltages. Data can be stored as single variable time series, as histograms, as number of events (e.g., violation of voltage limits) or in aggregated form (e.g., total charge time at temperature below 0 °C). Submission of vehicle- and battery system-related data is possible in different ways, such as by radio at defined transfer campaigns or reading the data during car service.
Field data in the context of battery aging allows for an analysis of EV operation modes (e.g., charge depleting and charge sustaining), for path dependencies with respect to calendar and cycle life, for the effects of ambient conditions (e.g., temperature, solar irradiation, and humidity), for the influence of charging strategies, and for driving behavior (e.g., aggressiveness).
Collected field data is used for the optimization of operation strategies and to review power capabilities and operation limits. The analysis of battery temperatures and ambient conditions helps to refine cooling requirements. Additionally, field data can be used to further develop lab test procedures, that is, to enhance load profiles (Neubauer and Wood, 2013; Peterson et al., 2010). Using field data, lifetime models can be adapted or trained, and the predictability can be improved (Liaw and Dubarry, 2007). Hence, quality assurance, prognosis of warranty and goodwill costs for the high voltage storage, and the EV itself can be supported.
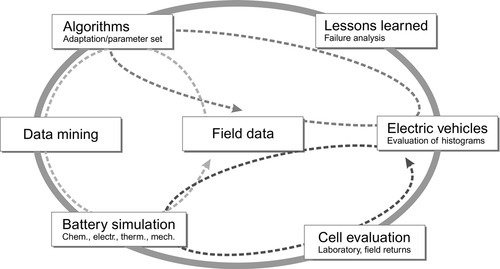
Challenges to collecting and analyzing field data are the high data quantity and almost no constant measurement conditions for battery characteristics, such as capacity and internal resistance. Also the interactions of the different stress and ambient parameters cannot be easily disentangled to single effects. That is why transferability and comparability of different testing methods, data from the field, from the dynamometer, and from the test bench is a challenge (see Figure 14.11). But using these different data sources and analyzing the interactions will lead to a more sophisticated level of understanding of vehicle battery aging, to detailed knowledge about (additional) aging effects, and finally to a better comprehension of the strongest aging causes.
14.8 Modeling and simulation
In principle, there are two approaches for modeling battery aging: (1) fundamental physical-based, first-principle models of degradation mechanisms and processes and (2) phenomenological, descriptive models of aging effects that mostly reproduce and extrapolate the capacity fade and resistance rise of conducted aging tests.
14.8.1 Phenomenological models
As discussed previously, the aging of a lithium-ion battery depends on a great variety of operational and ambient conditions. Most phenomenological aging models try to describe the aging effects of capacity fade and resistance rise as a mathematical function
of the main input variables that are time, temperature, SOC, DOD, current, charge throughput, energy throughput, and the like. Aging is a scalar value and, as shown above, directly linked to the SOH.
In general, two contributions to the overall aging of a battery are distinguished: calendar aging and cycle aging
Calendar aging describes degradation effects that occur without usage, that are independent of current and energy throughput, and that only depend on time, temperature, and SOC
Cycle aging refers to the degradation effects with use and charge exchange with the environment that besides temperature and SOC depend on DOD, current, charge throughput, and energy throughput. Cycle aging incorporates many different aging mechanisms, comprises many input variables, and is very specific for different load profiles in each application. It therewith poses the greatest challenge to aging modeling. For the combination of both aging contributions the assumption is made that calendar and cycle aging can be additively superposed
If aging tests according to statistical designs of experiments were conducted (see Section 14.6) aging models are derived through linear or nonlinear regression analysis such that statistically significant first- and second-order effects are reproduced. A typical aging model of a first-order effect is the calendar life at different states of charge (Bloom et al., 2001). Hence, the second-order effect would be dwelling time at different cell potentials at different temperatures. An example of cycle aging is the DOD at different average states of charge (Takei et al., 2001).
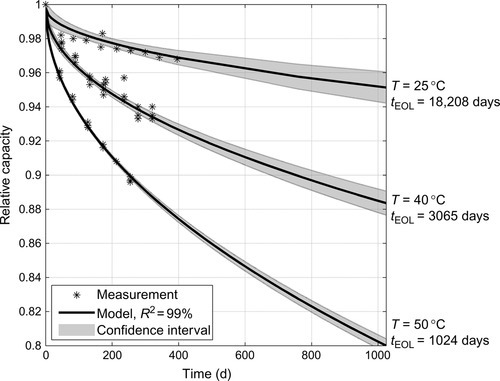
Beyond data-driven regression analysis, physical models can be used for aging modeling. For calendar aging it is shown that it follows an Arrhenius behavior, i.e., that the dominant aging process has an activation energy and is exponentially accelerated with temperature (Liaw et al., 2003). As a rule of thumb a doubling of lifetime can be expected with 10 K lower temperature. If the growth of the SEI layer is the dominant degradation mechanism, Ploehn et al. (2004) have shown that aging proceeds with the square root of time. Combining these two dependencies shows that the relative capacity
of a calendar life test follows an Arrhenius equation with the square root of time (Figure 14.12).
For cycle life, similar dependencies have been published (e.g., Wang et al., 2011).
Where the above equations describe aging under constant conditions the question arises how aging proceeds if the conditions change over the lifetime of a battery, for example, due to varying ambient temperatures or usage profiles. Answers are given by path dependency studies (e.g., Gering et al., 2011).
All models discussed are used not only to fit collected measurement data but also to extrapolate the aging to a defined EOL criterion to estimate the battery lifetime that can be expected under the observed conditions. To include uncertainties and cell-to-cell variations for each model confidence intervals need to be calculated as shown in Figure 14.13.
A retrospective approach of aging modeling is taken when field data of real-world load profiles or drive cycles are analyzed, as discussed in the previous section.
14.8.2 Physical-based models
Several physically based simulation approaches have been applied to the study of battery aging. They range from battery to cell level, down to the investigation of individual degradation mechanisms, with the expected increase in computational cost as the description of the system becomes increasingly detailed (Ramadesigan et al., 2012).
At the atomistic level, the Kinetic Monte Carlo method has been used to investigate lithium diffusion in the presence of activation barriers, or to simulate the SEI growth process (Van der Ven and Ceder, 2000; Methekar et al., 2011). SEI-related aging mechanisms have been also modeled by molecular dynamics (Leung and Budzien, 2010), whereas the more computationally expensive density functional theory method has been typically applied to the study of the thermodynamic stability of the electrode materials during lithium intercalation/deintercalation, as well as to the reactivity of the electrolyte component at the electrode surfaces (Qi et al., 2010; Tasaki et al., 2003).
At the single-cell level, pseudo-two-dimensional (P2D) models have been, by far, the most popular approach for performance and aging investigations. Originally developed by Newman's research group (Doyle et al., 1993), P2D models are based on the concentration solution theory and adopt the porous electrolyte theory to describe composite electrodes, consisting of interpenetrating active material and electrolyte. Diffusion in solid and liquid media is explicitly accounted for, whereas the reaction rates for lithium insertion and extraction are described using the Butler–Volmer kinetic. Because of the flexibility of this simulation approach, several similar models have been developed (Ramadesigan et al., 2012), which comprise a more detailed description of some internal processes and variables; transport of charged and neutral species by convection in the liquid phase induced by electrolyte flow due to volume changes in the electrode, or variations in the size and shape distribution of the active phase are examples of such improvements.
The largest step toward a more reliable simulation of aging in high-power/high-energy batteries for vehicle application has been achieved by the inclusion of temperature via the modeling of coupled thermal–electrochemical effects (Srinivasan and Wang, 2003; Gu and Wang, 2000; Smith and Wang, 2006). Moreover, thermal–electrochemical P2D models have been recently further expanded in the direction of aging simulation, by introduction of submodels to explicitly include individual degradation mechanisms such as anodic and cathodic SEI growth, Li plating, and Mn2 + dissolution (Lin et al., 2013).
Future directions in this field are the incorporation of temperature inhomogeneities within the cell, 3D thermal models, and modeling of battery modules and stacks. Although examples have been reported in the literature, computational cost issues have so far greatly limited the possibility to extend these simulations to investigate aging (Ramadesigan et al., 2012).
14.8.3 Summary of aging modeling and simulation
In conclusion, it has to be noted that the significance of phenomenological models is limited to the measurement range; predictions beyond the test conditions are not valid. Battery tests are expensive, specific for each battery type and generation tested, and in general not transferable. But phenomenological models are precise, application oriented, mathematically reduced, and hence suited for lifetime calculation as well as for onboard BMS algorithms. Model parameters are easy to receive through data fitting.
First-principle models, on the other hand, are computationally expensive. They allow predictions, are transferable, and hence suited for battery design and improvement. Their precision heavily relies on the possibility to collect reliable model parameters. Tests on material level needed to determine model parameters are time and money consuming.
14.9 Diagnostic methods
Lithium-ion batteries are hermetically sealed against the environment with no direct access to learn what happens inside. What can be measured through testing from the outside are the aging effects of internal resistance rise and capacity fade. The increments of resistance increase and capacity loss between two measurements are the cumulation of all aging processes that took place in all components of a cell.
The first goal of diagnostic methods is to reveal different contributions to the overall performance loss. In case of capacity fade, it is about to distinguish between the loss of active anode material, the loss of active cathode material, and the loss of cyclable lithium. In case of internal resistance rise, the possible polarization contributions are increases of ohmic resistances of electron conductivity and ionic migration, interface resistances, diffusion resistances, and charge throughput resistances. Beyond that, the second objective of diagnostic methods in the context of aging is to reveal structural changes of active electrode materials that present themselves through changes in the phase behavior, for example, staging phenomena of graphite or phase transition of positive electrode materials.
14.9.1 Polarization and internal resistance
The analysis of polarization effects and internal resistances is based on monitoring the voltage response of a cell to a current excitation. In case of current steps or pulses as excitation signals in time domain the instantaneous voltage response due to ohmic resistances is followed by a transient voltage response with an exponential behavior that is ascribed to charge transfer processes through interphases and diffusion processes, both with their specific time constants. The time constants of the voltage response to a current pulse and of voltage relaxation to a current interrupt are specific for the reaction kinetics and therewith also indicators of aging processes.
In a technical context often two characteristic values are measured. First, RAC, the resistance measured in frequency domain at a sinusoidal current excitation with a frequency of 1 kHz that leads to a resistance value that is almost equal to the pure ohmic resistance. Second, RDC, the resistance measured in time domain using the voltage difference at a current pulse of a defined length, for example, 15 s that cumulates the ohmic, charge transfer, and diffusion polarization effects.
The measured resistance of a battery is only valid at the current working point. All polarization effects have their individual dependencies on the battery state variables SOC, current, temperature, and hysteresis. Due to these sensitivities aging effects can only be extracted and interpreted when resistance measurements are conducted over the lifetime of a battery always at the same measurement conditions.
The transient behavior of the voltage response can be used to fit impedance models, in most cases resistor–capacitor-equivalent circuits, to the data. The evolution of the fitted model parameters over the lifetime of a battery is ultimately used to discuss the different contributions to the risen internal resistance and the power fade in batteries (Bloom et al., 2002).
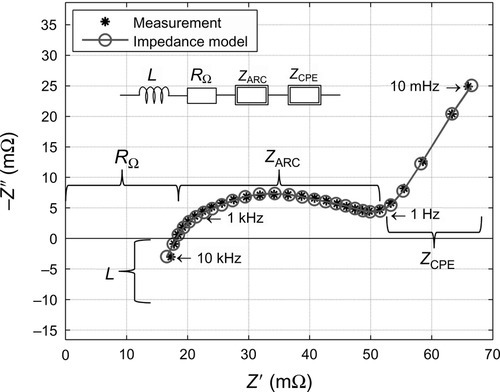
For a closer look into the different electrochemical and physical processes taking place inside the cell, electrochemical impedance spectroscopy (EIS) is applied. This method works in frequency domain where a sinusoidal signal with a logarithmic frequency sweep is used as system excitation. To limit the current, batteries are in most cases measured in galvanostatic mode, where the current is the controlled input signal. A frequency analyzer reads out the magnitude and phase of voltage and current and therewith calculates the impedance spectrum, also known as complex frequency- dependent internal resistance. Modeling and parameter identification are integral components of EIS. Its goal is to ascribe different models of physical and electrochemical processes to different parts of the impedance spectrum (Macdonald, 2005). As discussed above, the evolution of model parameters over the lifetime is used to discuss the aging behavior of a battery (Tröltzsch et al., 2006).
Another approach is taken when impedance spectra are transformed into distributions of relaxation times (DRT) using deconvolution techniques (Tuncer and Macdonald, 2006). Therewith modeling of impedance spectra is avoided, allowing for direct interpretation of polarization processes. DRT help to disentangle electrode processes and their contributions to the overall polarization through a separation of characteristic ranges of time constants (Schmidt et al., 2011).
14.9.2 Capacity and voltage profiles
Every battery technology with its specific active materials has a characteristic voltage profile across the whole range of SOC. The voltage behavior versus charge throughput presents specific features such as slopes, plateaus, steep transition areas, or inflection points. Voltage profiles are measured via charge or discharge using a continuous low current between an upper and a lower voltage limit or incremental SOC steps with sufficient time for voltage relaxation so that for both cases polarization effects are minimized or abated. As discussed in the following, signal processing is used to amplify the characteristic features.
Incremental capacity analysis (ICA) is the discrete derivative of charge throughput with respect to voltage dQ/dV in Ah/V (Bloom et al., 2002; Figure 14.14). It presents peaks and valleys as characteristic features, where especially the position, height, and shape of the peaks as well as the potential difference between peaks carry valuable information. In reverse, incremental voltage analysis (IVA) is the discrete derivative of the voltage profile with respect to charge throughput dV/dQ in V/Ah. Here especially the charge throughput between peaks discloses relevant information (Safari and Delacourt, 2011).
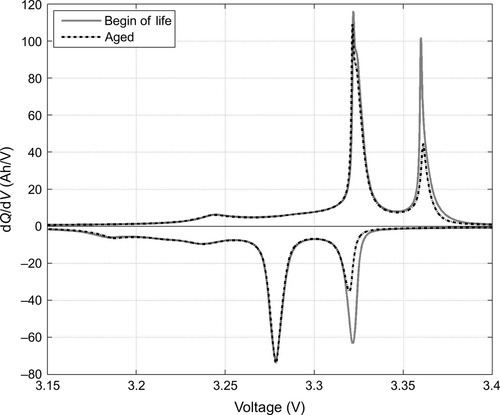
Voltage profiles with their more pronounced variations ICA and IVA reveal the phase behavior of active electrode materials, for example, staging phenomena of graphite or phase transition of positive electrode materials. Changes in the characteristic features in terms of shifted, lowered, or deformed peaks tell about degradation processes and phase changes that took place between two measurements. Tracking these changes enables us to disentangle contributions to the overall capacity fade: the loss of active anode material, the loss of active cathode material, and the loss of cyclable lithium (Dubarry and Liaw, 2009; Dubarry et al., 2009).
If the goal is to monitor aging effects in situ (i.e., in a single cycle), instead of cumulative over many cycles or longer periods of time, battery conditions have to be well controlled and measurement precisions have to be extraordinarily high. In this way, as an example the measurement of coulombic efficiency can be directly correlated to SEI growth as one major aging mechanism in lithium-ion batteries (Smith et al., 2011).
All diagnostic methods we have introduced are applied in laboratory environments with well-controlled battery and ambient conditions. Usually they require specific test protocols, expensive measurement and signal processing equipment, and computationally expensive algorithms that are typically not implemented in high-volume vehicles. Hence, onboard diagnostics can only partially analyze battery aging. Diagnostic methods are better suited to checkups in the after-sale service. What gets implemented in BMSs are test protocols and estimation algorithms (observers) for capacity and internal resistance to determine the SOH of automotive batteries (Li et al., 2014).
14.10 Extension of battery lifetime
There are two major preconditions for a slow degradation of the performance and a long battery life. On the one hand, longevity requires the selection and synthesis of stable materials that match and are fitted to each other, well-balanced electrodes, a good cell design, and a high production quality. On the other hand, a long service life calls for the knowledge of degradation root causes and processes, detrimental states (e.g., charging at low temperatures, dwelling at high voltages and high temperatures) and, as a consequence, well-defined operation limits.
Of the means to preserve life and to prevent (fast) degradation, battery management is most important. With the functions of data acquisition and state estimation, its first task is the complete monitoring of the battery states (current, SOC, temperature, voltage) and the compliance of operation limits, at best for every single cell. Beyond monitoring, the BMS needs to be able to take action, for example, to control temperature, to limit power, and ultimately to interrupt the current flow. Thus, stress can be reduced, and cells can be operated within their comfort zone. Furthermore, the BMS takes care of the homogeneity of the cells in a module through cell balancing and cooling. To detect detrimental states early and to adapt operational limits, BMSs need to be provided with more intelligence and with better diagnostic methods.
There are many ways and means to extend the lifetime of a battery system. On material level, great effort is made on material aids such as the development of electrolyte additives and electrode coating to reduce degradation and to stabilize the electrode structure. On system level, the first approach is pack dimensioning and oversizing. Implementing more cells, or cells with a higher capacity, results in a higher overall capacity, leading to lower depths of discharge, lower currents, and therewith lower self-heating, and finally enabling to operate the system at lower average states of charge. The second means is the definition of more rigorous or conservative operation limits (e.g., to strictly prohibit charging at low temperatures). The third approach is to control the battery system such that the average voltage, SOC, and temperature are lowered and their dwell time at extreme values is minimized.
14.11 Summary
Batteries have their maximum utility for their specified application after production and formation. Over time and with usage they continuously lose this utility, noticeable mainly by a reduced power capability and a loss of usable energy. These aging results are ascribed to an increase of the internal resistance and a loss of capacity. And at the bottom, these aging effects can be traced back to a whole variety of aging mechanisms on all levels of a battery system: active and inactive materials of the cell, components in the cell and the pack.
The current status of understanding of lithium-ion battery aging is described here. To further increase the knowledge of automotive battery aging, sophisticated analyses have to be developed and conducted, more tests have to be designed and run, models have to be developed and validated, and field data has to be collected and analyzed.
For the safe application of lithium-ion batteries in electric road and off-road vehicles, BMSs are available. Further development and refining of strategies and diagnostic methods will extend the lifetime of batteries and therewith improve the economics of EV.
Lithium-ion batteries are still a young technology. For lithium-ion automotive batteries, we have reached a production quality, gathered knowledge on battery aging, and developed algorithms to operate battery systems that, with improvements and refinement, should enable the success of electro mobility.