
Carbon dioxide and consumption reduction through electric vehicles
H. Helms; C. Kämper; U. Lambrecht IFEU—Institut für Energie- und Umweltforschung Heidelberg GmbH, Heidelberg, Germany
Abstract
Electric vehicles are embraced as a key technology for sustainable transport because they have quiet engines, zero local emissions, and the potential for using different (also renewable) energy sources in road traffic, which so far could not be integrated. Large shares of the current European electricity supply, however, are still being generated using fossil energy carriers. Therefore, considerable life-cycle greenhouse gas emissions are still caused by electricity generation in Europe (EU27 mix), which limits the advantage of electric vehicles over modern vehicles with combustion engines. The full potential for climate protection will thus be tapped only when additional renewable electricity is used. In the long-term perspective, the impact of the increasing power demand from electric vehicles on power generation and the European emissions trading scheme have to be considered also and are discussed in this chapter.
2.1 Introduction
2.1.1 Energy consumption and CO2 emissions of transport in Europe
Mobility is an important basis for many economic and private activities and thus is a crucial part of our life. However, mobility is also energy consuming and leads to substantial environmental problems. In 2010, the transport sector was responsible for over 30% of the final energy consumption of the EU27 (see Figure 2.1). Furthermore, transport makes more than a 20% contribution to the EU27 CO2 emissions (international bunker fuels not included; EEA, 2013).
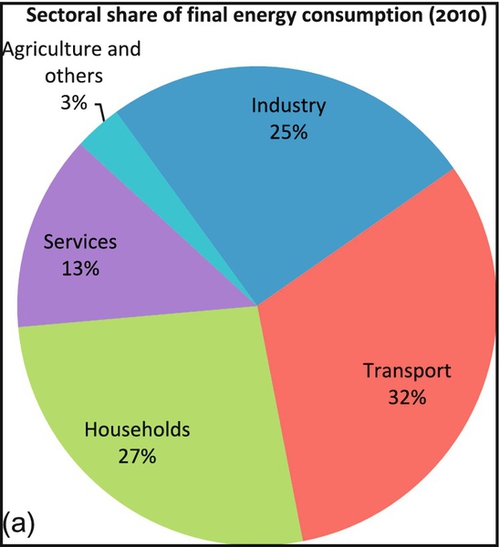
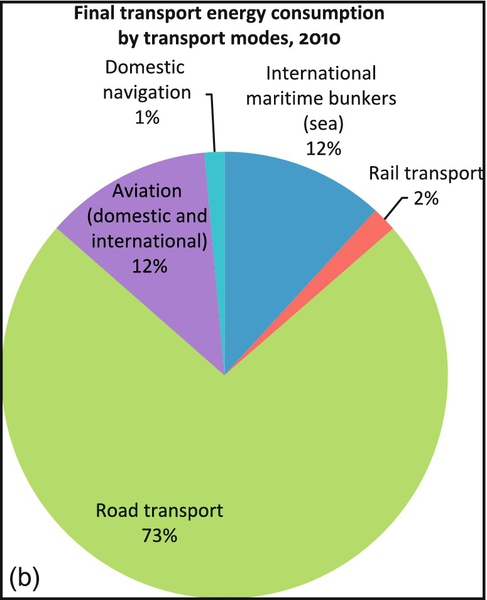

In many industrialized countries, the demand for mobility is mostly covered by road traffic. Modern vehicles and a broad network of roads allow for a high degree of individual mobility. More than 70% of the transport energy consumption in the EU27 (2010) is thus consumed by road traffic (see Figure 2.1, middle), and more than 90% of this energy consumption is based on the use of fossil fuels (see Figure 2.1, right). Various measures therefore have been introduced to reduce CO2 emissions of road vehicles. In the European Union, regulation 443/2009 limits the average CO2 emissions of new passenger cars to 130 g CO2/km to take effect from 2015 (EU, 2009a). A further limit value of 95 g CO2/km has been suggested for 2020. Nevertheless, the reduction in road transport CO2 emissions shows only slow progress, and the strong dependence of the transport sector on fossil resources not only contributes significantly to climate-relevant CO2 emissions but also faces limited natural resources and leads to political dependencies.
The use of biofuels has been supported in the EU first as an alleged climate-friendly alternative by a range of political measures: The EU Biofuels Directive (2003/30/EC) (EU, 2003) set an energy-based biofuel target of 5.75% of all fuels in the market to be reached by 2010. In 2009, the EU Biofuels Directive was replaced by the Renewable Energy Directive (2009/28/EC) (EU, 2009b), which in turn set an energy-based target of 10% of renewable energy in the transport sector to be reached by 2020. But biofuels have also been criticized more recently because of the competition between the use of biomass for food or fuels and also for the potentially unfavorable life-cycle balance owing to direct and indirect land use changes. The current Renewable Energy Directive therefore already promotes the use of electricity in transport by weighting the use of renewable electricity with a factor of 2.5 toward the target.
Besides energy consumption and greenhouse gas (GHG) emissions, road transport in the European Union is also contributing to current air pollution in urban areas. Air quality limits set by EU directive 2008/50 are frequently exceeded at many roadside hot spots. The directive sets an annual mean concentration limit of 40 μg/m3 for NO2 and PM10 (EU, 2008). Further, a PM10 concentration of over 50 μg/m3 may also not be exceeded on more than 35 days every year. According to EEA (2013), however, in 2010 over 6% of the EU population had been impacted by an annual mean NO2 concentration of over 40 μg, and 21.3% of the EU population had been impacted by PM10 concentrations of over 50 μg for more than 35 days. Further measures are therefore necessary to comply with the air quality standard and are currently defined as a part of local clean air plans.
These current challenges of road transport, energy security, climate protection, and air quality create demand for new technologies in transport beyond improvements of the conventional combustion engines. This sets the stage for alternative drivetrain concepts such as electric vehicles.
2.1.2 Electric drivetrain concepts and their technical characteristics
Electric mobility has always been the first choice wherever electricity has been available: for long distances in trains, for short distances in trams or subways, and even within buildings in elevators and escalators. For road traffic, however, there has long been the problem of mobile storage of electricity. Batteries have been heavy and had a low energy density; electric vehicles thus had a very short driving range. New technological developments, introduced by consumer electronics such as laptops and mobile phones, have led to a considerable improvement in the performance of batteries. Electric vehicles are now considered as a serious alternative to conventional vehicles.
Electric vehicles are also embraced as a key technology for sustainable transport: efficient hybrid vehicles are already established and regarded as the new clean vehicles. Full electric vehicles are also entering the market and have the additional advantage of quiet engines, zero local emissions, and the potential for the use of different (also renewable) energy sources in road traffic, which so far could not be used.
Several stages of vehicle electrification can be identified between the conventional combustion engine and the full electric vehicle (see Figure 2.2). So-called micro hybrids only have a start-stop-function to save fuel and thus do not really qualify as hybrid vehicles, owing to the absence of an electric motor. In mild hybrids, an electric motor supports the propulsion of the combustion engine during starts, and a generator with a small battery allows for regenerative breaking. Full hybrid electric vehicles (HEVs) possess even larger batteries and can drive with the electric motor only for short distances. The combination of electric and combustion engines allows the choice of the most efficient drivetrain for every given situation. Hybrid concepts, however, still rely on fuels as a primary energy source. All electricity is generated inside the vehicle.
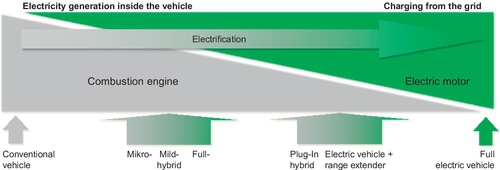
A plug-in hybrid electric vehicle (PHEV) in contrast is the next step toward electric mobility because it also allows for the use of electricity from the grid. PHEVs (and similar “range extender” concepts) are thus situated between hybrids and full battery electric vehicles (BEVs). The battery can be smaller than it is for full electric vehicles because a small combustion engine used as a range extender is available. This can lead to benefits in terms of weight and costs. The larger battery compared to hybrids, however, allows for larger distances of full electric driving. Depending on the individual use pattern, high shares of electric driving of around 80% are possible (IFEU, 2013). At the end of the electrification process, the full BEV only has an electric motor with an even larger battery compared to the PHEV. Such BEVs, however, currently have a limited driving range compared to the other concepts that still include a combustion engine.
2.1.3 Methodology of vehicle comparisons
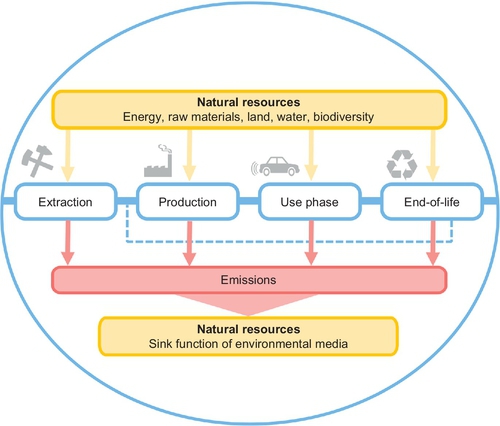
BEVs in particular are discussed in this section as electric vehicles in terms of their energy consumption and GHG emissions compared to conventional vehicles with combustion engines. For a comparison of the two drivetrain concepts, not only should we consider the different energy consumption and GHG emissions of vehicle use but also energy provision and vehicle production. This calls for a life-cycle approach that covers the full vehicle life from material extraction and vehicle production over the use phase considering vehicle emissions (if applicable) as well as associated energy generation and distribution to the end-of-life aspects of the vehicle (see Figure 2.3).
This section first briefly discusses the differences in energy consumption and CO2 emissions of vehicle production. Afterward the use phase energy consumption of electric vehicles is discussed in detail. A full comparison of energy consumption and CO2 emissions is finally presented in a life-cycle perspective, considering the average EU27, selected national electricity splits and potential use of renewable electricity. Finally, potential future interactions of electric vehicles in a mass market on power generation are discussed, giving an outlook on market forces and future trends.
2.2 Energy consumption and CO2 emissions of vehicle production
The production of different drivetrain concepts leads to a different energy consumption and CO2 emissions—even before the vehicle use phase starts. Although, in principle, the same vehicle body can be used for electric vehicles as for conventional vehicles, the main difference is in the propulsion technology (an electric motor is used instead of a combustion engine) and energy storage (battery instead of fuel tank) (see Figure 2.4). Furthermore, several additional components are needed, including high-voltage cables, battery recharger, smartmeter, generator, power electronics, and additional heating, whereas other components can be omitted, such as the exhaust gas system (and after treatment), lighting dynamo, and (partly) conventional gear transmission.

In addition to raw material extraction and processing, the vehicle assembly and transport processes also have to be considered. Results from a production inventory show that the difference in CO2 emissions and energy consumption between a conventional vehicle and an electric vehicle is considerable: Whereas the production of a conventional gasoline compact car produces about 5 metric tons of CO2 emissions and is associated with an energy consumption of about 100 GJ, the production of a BEV (24 kWh battery assumed) produces over 8 metric tons of CO2 emissions and consumes about 180 GJ energy (see Figure 2.5). The main difference between the vehicle concepts is in the lithium-ion battery production, which alone is assessed to be responsible for about 3 metric tons of CO2 emissions. Especially extraction and processing of cell materials and the energy-intensive cell manufacturing process are main contributors of emissions (IFEU, 2011, 2013). Also the concept-specific components of an electric vehicle lead to higher CO2 emissions, mainly owing to the extensive use of copper in electric components such as high-voltage cables.
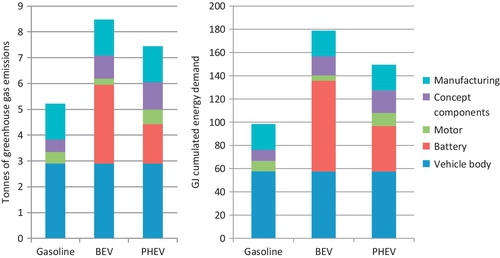
The additional emissions and energy consumption are somewhat lower for the PHEV, even though the concept-specific components lead to higher emissions from the two drivetrains. The reason is the assumed halved battery capacity (12 kWh), which does not limit the driving range due to the combustion engine. This aspect demonstrates the significantly higher impact of the battery size, which even compensates for the additional drivetrain in a PHEV.
Production impacts for electric vehicles may decrease in the future with mass markets and from the dynamic development in battery technology research. Such reductions may lead to a better life-cycle impact compared to conventional vehicles. On the other hand, it is possible that new approaches such as light-weighting may cause more emissions in the upstream chain of production.
2.3 Energy consumption of electric vehicles
Until now, only very few electric vehicles from mass production are actually available on the market. In 2011, 8702 electric vehicles were newly registered in the EU27, which is a small share of 0.07% from all registered cars in the same year (EEA, 2012). Therefore, only few reliable data on electric vehicles’ energy consumption is available, mostly from scientific sources or from manufacturers. Manufacturer data has mostly been measured in the New European Driving Cycle (NEDC), a standardized profile with low dynamics that does not consider auxiliary consumers such as heating and cooling of vehicles. Such profiles are therefore not considered to represent a realistic use profile and thereby do not produce realistic consumption values (Table 2.1).
Table 2.1
Consumption data of current electric vehicles (NEDC)
| Manufacturer | Model | Consumption (kWh/100 km) |
| Smart | For two electric drive | 15.1 |
| Peugeot | iOn | 12.6 |
| Mitsubishi | i-MiEV | 13.5 |
| Citroen | C-Zero | 12.6 |
| Nissan | Leaf | 15.0 |
| BMW | i3 | 12.9 |
| Ford | Focus Electric | 15.4 |
| Volkswagen | e-up! | 11.7 |
| Renault | Zoe | 14.6 |
Sources: ADAC (2013) and VCD (2013).
Some studies (e.g., IFEU, 2011) therefore use a modeling approach to assess a realistic energy consumption for electric vehicles. Results from such realistic modeling including auxiliary consumers suggest the energy consumption of an electronic compact car (Volkswagen Golf type) in the range of above 20 kWh per 100 km (see Figure 2.6). Energy consumption accordingly is strongly dependent on the vehicles’ speed profile and increases sharply at high speeds on highways to about 30 kWh/100 km. The main reason for this large difference when compared to vehicles with combustion engines is the higher efficiency of the electric motor, which is especially noticeable in urban traffic. Although for combustion engines the increasing energy demand at the wheel at higher speeds is somewhat compensated by the increasing engine efficiency at higher loads, electric motor efficiency remains in the same range. Nevertheless, the energy consumption of auxiliary consumers per kilometer decreases with high vehicle speeds, as most such consumers have a steady power demand independent of the vehicle speed.

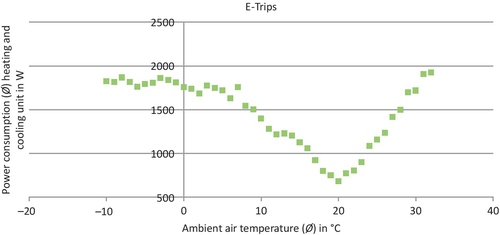
The ambient air temperature is another factor that strongly influences electric vehicle energy consumption. Figure 2.7 shows the power demand for heating and cooling depending on ambient air temperature. Values have been measured in a recent Volkswagen field test with 20 PHEVs (IFEU, 2013). Power demand was the lowest at about 20 C (about 600 W) owing to the fact that at this temperature heating and cooling are rarely required. Consequently, this demand sharply increases at higher and lower temperatures to almost 2000 W. Power demand is especially high for electric vehicles since heat from the combustion engine is not available.
For PHEVs, energy consumption generally consists of two energy carriers and is thus only adequately described by stating both values: fuel consumption and electricity consumption. The vehicle use and charging pattern of the driver have a strong influence on the share of different energy carriers used. Consumption values, however, follow a linear dependence between almost only electric driving and driving with preferred use of the combustion engine. Most users of the assessed field test sample are arranged close to that linear regression line (Figure 2.8).

Further factors of influence on electric vehicle energy consumption are the general resistance factors of the vehicle, mainly determined by the vehicle weight and its aerodynamic characteristics and tire rolling resistance. While the tire resistance and aerodynamic characteristics are largely independent of the drivetrain concept, the additional battery weight considerably increases the vehicle energy consumption and thus limits the driving range, mainly depending on the battery capacity. Energy consumption and vehicle driving range are thus interdependent and should be considered in vehicle design.
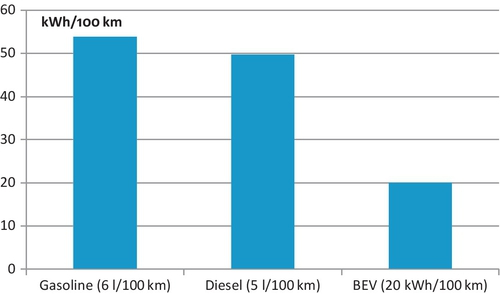
In general, electric vehicles have an efficiency advantage compared to vehicles with a conventional combustion engine (see Figure 2.9). From 100% electricity from the grid, roughly 70% can be used at the wheel for vehicle propulsion. The combustion engine efficiency is usually lower than 30%. In terms of final energy consumption, the advantage is considerable (see Figure 2.10). Final energy consumption of electric vehicles thereby accounts generally to less than half compared to vehicles with combustion engines. However, power generation also has to be taken into account and will be discussed in the life-cycle results in the following chapter.

2.4 Life-cycle energy consumption and CO2 emissions compared
As previously discussed, the initial production of an electric vehicle leads to higher environmental impacts, which have to be compensated by the higher efficiency in the use phase. However, power generation also has to be considered. Though electric vehicles in principle allow for the use of renewable electricity, large shares of the current European electricity are also generated by coal power plants, for example, electric vehicles in the European Union, however, shift a share of overall CO2 emissions from the transport sector, which is not covered by the EU emissions trading scheme to the electricity sector in which total CO2 emissions are capped. In theory this will lead to rising certificate prices and thus emission reductions (e.g., by installing new capacities for renewable electricity generation). In practice, however, certificate prices are very low and the impact on the electricity sector is questionable. Also, there is no instrument preventing an adjustment of the CO2 cap because of the additional electricity demand from the transport sector after 2020. Furthermore, projects of the “Clean Development Mechanism,” which can be credited toward the CO2-cap, are questionable, as they are debated in their impact on GHG emission reductions. Therefore, electricity for electric vehicles cannot be generally counted as emission free. The whole life cycle of a vehicle—including electricity generation—has to be considered to provide a comprehensive environmental analysis.
Figure 2.11 compares the lifetime GHG emissions of a compact car with different drivetrain concepts and different electricity splits, assuming a lifetime mileage of 150,000 km. Although a PHEV using only its combustion engine leads to higher emissions than a comparable compact car owing to the higher vehicle weight, the life-cycle emissions are significantly better driving electric and using the EU27 grid mix. The life-cycle emissions of a PHEV therefore strongly depend on the share of electric driving.
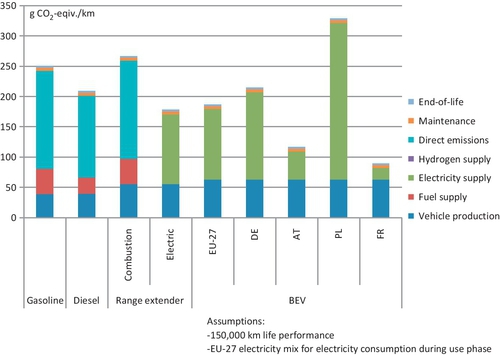
The full electric vehicle already today shows a slightly better GHG impact balance in comparison to the diesel vehicle if the EU27 grid mix is used. But life-cycle impacts also strongly differ by country: for example, impacts in Germany, with a mix of coal, nuclear, and renewable power, are somewhat similar to the EU27 mix, associated emissions will be much higher in Poland due to extensive use of coal power. On the contrary, emissions are considerably lower in Austria (owing to extensive use of hydro power) and France (due to large shares of nuclear power).
The increasing power demand from electric vehicles, however, can be expected to have an impact on electricity generation in the future. An important question is which existing power plants will be needed to generate additional electricity for electric vehicles and what additional power capacities will be installed. This will be discussed for the case of Germany in the following section.
2.5 Potential interactions of electric vehicles with power generation: a case study from Germany
The introduction of electric mobility is connected to a reduction of final energy consumption within the transport sector. But the shift of the energy supply of vehicles to the electricity sector has to be considered in this context. The generated additional energy demand of the future may lead to significant interactions between the transport and the electricity sectors. In the short term this will influence the specific charging energy mix, and in the long term the future structure of power plants serving the grid will also be affected by the transport sector.
There is no direct physical connection between the generated and consumed electricity. The analysis of a specific electricity mix for charging vehicles is therefore a question of allocation in terms of cause and effect. Electric vehicles are new electricity consumers which will generate additional demand. If these vehicles continue to play a minor role within the vehicle fleet, the impact on the electricity sector can be neglected. However, if electric mobility is gaining more significance in the future, electricity consumption will rise accordingly. To serve this additional demand either new power plants have to be built or the existing infrastructure has to be used to a higher capacity, which could reintroduce discarded power plants to the grid. These so-called marginal power plants could be older coal-fired power plants or new and efficient gas-fired power plants. Further, the charging patterns have a strong impact on the type of utilized power plants.
To illustrate the potential effects, a “marginal approach” has to be adopted, which investigates the average electricity split as well as the specific electricity mix of the additional energy demand generated by electric vehicles. The results of such an approach are discussed in this chapter along the lines of a case study from Germany1: the combination of the two models allowed the analysis of long-term impacts (e.g., structural changes in the power plant infrastructure) as well as short-term market impacts.
2.5.1 Case study Germany: additional electricity demand and impacts on the power plant structure
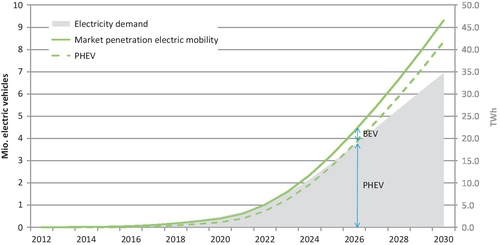
The additional energy demand caused by electric mobility in Germany is estimated to rise considerably after 2020. In 2030, the additional electricity demand in the analyzed scenario will account for 34 TWh in absolute numbers, which is about 6% of the total production of 550 TWh in Germany today (UBA, 2013). The impact of electric mobility on investment decisions within the power plant structure was calculated with the model PERSEUS by the Institute for Industrial Production (Karlsruhe Institute of Technology). An additional electricity demand by electric mobility of about 400 TWh was calculated for Europe. This would account for 10% of gross electricity demand within the European Union.
Fuel prices are defined in accordance with the World Energy Outlook 2010 (IEA, 2010). Following these assumptions, gas-fired power plants and renewable energy (RE) plants will be built in Europe until 2030 (IIP, 2012). However, to serve the additional demand, nuclear and coal-fired power plants will also be built in Europe. Figure 2.12 demonstrates the assessed market penetration of electric vehicles until 2030 and the corresponding energy demand in Germany.
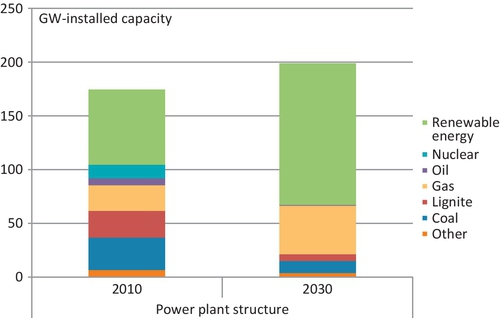
The power plant structure in Germany is generally expected to have a stronger bias toward renewable energy in 2030. New fossil capacity is primarily served by gas-fired power plants since the German government signed a contract to exit the use of nuclear energy, and power from coal-fired power plants is supposed to be reduced in the future. Especially, the installed capacity of wind turbines (onshore and offshore) is going to rise from 30 GW to about 100 GW in 2030.
Another important impact on the electricity mix is attributed to the CO2 certificate prices that are calculated by the PERSEUS model. The calculations consider the European climate change targets (EU-Directive 2009/29/EC) as well as the German nuclear phase out. The certificate price will rise under these assumption up to 60 EUR per ton CO2 until 2030 (IIP, 2012). Electric mobility has in general a limited impact on the development of certificate prices, but the impact on the energy mix is significant (IIP, 2012). In times of currently low CO2 certificate prices and an uncertain political positioning, a sensitivity approach has been adopted which assumes a low certificate price of 45 EUR per ton CO2.
2.5.2 Impact of electric mobility on the operation of the power plant structure
Based on the renewable energy development targets by the German government and assumptions on the future power plant structure calculated by PERSEUS, the next step is to further analyze the power plant operation and load factor triggered by additional energy demand of electric mobility. To get a precise time-resolved result, the model PowerACE (Sensfuss, 2008) was used. Two different charging patterns are analyses in scenarios that consider a marginal cost analysis of the power plant structure and the supply of renewable energy (resolution hourly):
![]() Charging after the last trip: vehicles are charged directly after the last trip with no management system. For example, in the evening after the last trip back home from the workplace (scenario: “last trip”).
Charging after the last trip: vehicles are charged directly after the last trip with no management system. For example, in the evening after the last trip back home from the workplace (scenario: “last trip”).
![]() Demand side management (DSM): a load management incentive is assumed that is bound to the stock exchange market price of energy. This charging process will be perpetuated continuously and be moved to a period when wind energy, for example, is available and general demand for electricity is low (scenario: “DSM”).
Demand side management (DSM): a load management incentive is assumed that is bound to the stock exchange market price of energy. This charging process will be perpetuated continuously and be moved to a period when wind energy, for example, is available and general demand for electricity is low (scenario: “DSM”).
The results show if electric vehicles are charged directly after the last trip, the share of modern gas power plants is rising within the energy mix at the expense on RE (see Figure 2.13, “last trip”). This is especially obvious if the marginal electricity mix is considered. In this context, the marginal electricity mix is the specific electricity used to charge electric vehicles differentiated by source if they appear under otherwise identical conditions as additional energy consumers. The average electricity mix is defined as the average energy generation mix of the power plants within a year. This average mix does not show significant changes if electric vehicles enter the scene. However, if the marginal mix is analyzed in depth it reveals that 66% of the additional demand is served by modern gas and steam-fired plants if the energy source is directly attributed.
If a high certificate price is assumed (60 EUR), the electricity mix within the DSM will remain approximately the same. The contribution of electricity from gas turbines is reduced in favor of a higher share of modern coal-fired power plants. However, if the certificate price remains at a lower level, the utilization of a DSM system will operate older lignite-fired power plants at high capacity (see DSM-45 in Figure 2.14). Accordingly, the RE share rises in both scenarios from 5% to about 10%. The peak load would be reduced down to 12 GW.

Figure 2.15 demonstrates the global warming potential from energy generation along the four scenarios and also differentiates between the average electricity mix and the specific marginal electricity mix. Although today approximately 600 g CO2 equivalents are associated with the production of 1 kWh in Germany, this amount would be halved in 2030 following the reference scenario. This development is owing to a strong expansion of RE that will account for about 60% of generated electricity in 2030. Accordingly, there will be a shift from coal to gas-fired power plants. Nevertheless, the additional electricity demand for electric mobility will be met primarily by fossil sources (especially gas). This leads to a small rise within the average global warming potential in Germany caused by electric mobility. This is especially obvious if the marginal mix is considered (see Figure 2.15).
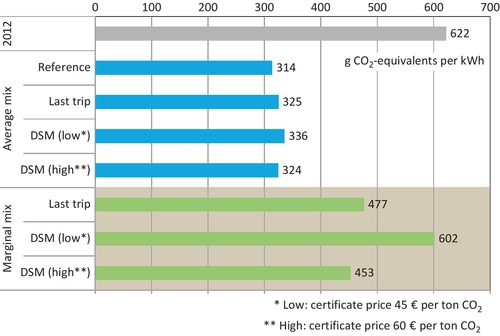
Although surplus RE is integrated in the scenario “DSM,” it can be observed that there is only a minor improvement compared to the scenario “Last trip.” This is due to the fact that at the same time more coal-fired power plants with low variable costs are integrated. If additionally certificate prices are low (scenario “DSM low”), the demand-side management could contribute to even more emissions compared to no management system. This effect is caused by the low certificate prices that favor older lignite-fired power plants. The marginal energy mix in this scenario would generate even a rise to about 600 g CO2 equivalents per kWh, which is close to the German emission value of today.
2.6 Outlook
Today, life-cycle GHG emissions of electric vehicles are caused primarily by electricity generation if the current EU27 mix is used. Electric vehicles, however, shift a share of overall CO2 emissions from the transport sector, which is not covered by the EU emissions trading scheme, to the electricity sector in which total CO2 emissions are capped. In theory this will lead to rising certificate prices and thus emission reductions (e.g., by installing new capacities for renewable electricity generation). In practice, however, certificate prices are currently low, and the impact on the electricity sector is questionable. Also, there is no instrument preventing an adjustment of the CO2 cap because of the additional electricity demand from the transport sector after 2020. Furthermore, the partly considered projects of the “Clean Development Mechanism” are questionable in their impact on GHG emission reductions. Therefore, electricity for electric vehicles cannot be generally counted as emission free.
GHG advantages of electric vehicles in comparison with conventional vehicles with combustion engines are therefore still limited in most countries if average electricity generation today is considered. An improvement of the GHG balance, toward an (in the use phase) almost emission-free mobility calls for further installation of renewable energy capacity covering the additional electricity demand for electric vehicles. Political instruments to foster such a development could be found in the EU CO2 regulation for passenger cars in which electric vehicles are currently counted as emission free. Such advantages could be linked to the installation of (or investment in) renewable power plants. Otherwise, a multiplication of electric vehicles’ energy consumption with the average EU27 CO2 factor would be more appropriate. Further instruments, such as taxation schemes, exist on the national level.
Although the use of renewable electricity is often the focus of the current discussion of the climate impact of electric vehicles, energy efficiency also has to be taken into account. As long as fossil energy resources are also used for electric vehicles, energy efficiency remains a relevant issue for the GHG balance. If it is considered that availability of renewable electricity is still limited, it becomes even more important. Therefore, renewable electricity not required in the transport sector can generally substitute fossil energy resources elsewhere. A further reduction of electric vehicle energy consumption is generally possible, for example, by light-weighting, reduction of battery losses, and energy-efficient auxiliary consumers. Legislative incentives, however, are currently low in the European Union because energy efficiency is regulated via exhaust pipe CO2 emissions. Such an advantage for electric mobility may be politically desirable in an early market phase, but it is not appropriate from a well-to-wheel perspective.
In addition to the focus on GHG emissions, a more comprehensive environmental evaluation would consider other impact categories of life cycle assessment (LCA) such as acidification and eutrophication. The results of other impact categories do not always draw the same picture. In the case of acidification, the advantages of electric vehicles are not evident today but may evolve in the future. In addition, the consumption of natural resources should be considered to take into account respective policies on the European level (e.g., Road Map to a Resource Efficient Europe; EC, 2011). Because of its large battery, the production of electric vehicles consumes a higher absolute mass of raw materials and also contains many raw materials for which the availability is critical. In this context, special attention should be paid to efficient use of primary raw materials and options to reduce their input, such as by recycling the vehicle and battery materials.