
8 Obsolete System Structures
8.1 INTRODUCTION
This chapter looks at the impact that “making do” with limited numbers and sizes of substation sites and sub-transmission rights of way has on the reliability and operation of a power delivery system. As discussed in Chapter 1’s introduction to aging T&D infrastructures, the second of the four interacting aspects of the aging infrastructure issue is the limited facilities which power distribution utilities invariably have in the core of thriving metropolitan areas. Difficulties in getting new sites, in expanding old sites, and in getting rights of way often mean that the utility’s system can not expand in company with the demand of an ever-growing downtown area.
This chapter looks at this problem and the effects that it has on power system performance. Section 8.2 presents the basic problem with some examples. Section 8.3 then examines the impacts that “outdated” or limited system structures have on the engineering decisions that planners must make with regard to the sub-transmission and substation levels of the system, and on the operating characteristics and daily constraints faced by the people managing that part of the system. All of these effects compromise the system’s reliability. Section 8.4 looks at similar impacts on the primary feeder system, which degrade its potential to contribute economy of operation and reliability to the system. Section 8.5 summarizes the various solutions and improvements recommended for the distribution utility faced with this problem. Key points are summarized in Section 8.6.
8.2 OBSOLETE SYSTEM LAYOUTS
Example System
Figures 8.1 and 8.2 depict the plight of a fictional electric distribution utility, Metropolitan Power and Light, which represents the average experience of eight major metropolitan utilities on the east and west coasts and the Midwest United States.
In the period 1965 to 2000, Metropolitan Power and Light saw the peak demand in its central operating district go from 1380 MVA to 3058 MVA, an average annual growth rate of 2.3%. But while the peak load and demand for quality of service have increased greatly, the basic topology of its system did not keep pace. The original (1965) system, shown in Figure 8.1, consisted of 16 substations in the central operating district, with an average capacity of 128 MVA each, for a total installed substation capacity of 2048 MVA. This resulted in a utilization ratio of 67% (1380 MVA/2048 MVA). The majority of these substations were originally fed by 69 kV transmission loops (two, or in some cases, two sets of two), lines along the same right of way, providing a parallel and redundant (contingency backup) feed to each substations.
During the intervening 35 years, Metropolitan added one new substation site and expanded the size of four others. It also upgraded a number of 69 kV sub-transmission lines to 138 kV and completed one “loop” transmission route by adding a right of way to connect two substations (Figure 8.2). In addition, it increased the capacity of the 138 kV circuit lines in the backbone right of way through downtown by re-conductoring and bundling of conductor, and by upgrading part of the route to 345 kV.
Table 8.1 Comparison of Metropolitan Power and Light Downtown Systems in 1965 and 2000
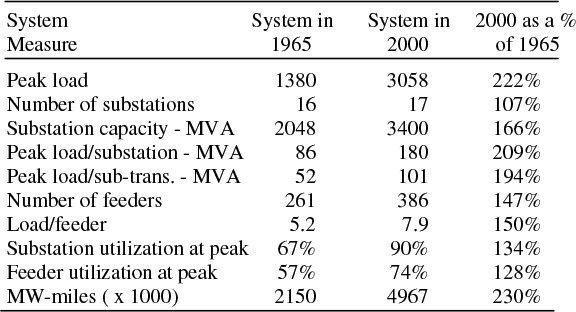
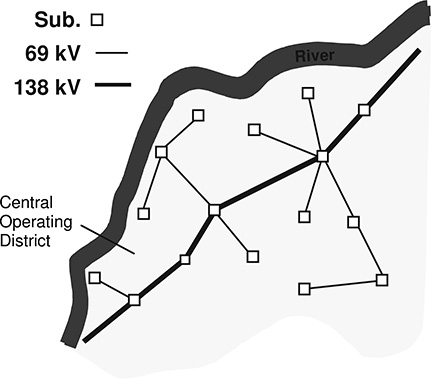
Figure 8.1 In 1965, the central operating district of Metropolitan Power and Light used 16 substations averaging 128 MVA capacity each (total 2,048 MVA capacity) to serve a peak downtown load of 1,380 MVA. This diagram shows only the overall structure of the system. Many of the apparently radial lines feeding substations are in fact loops (two circuits) or double loops (four circuits).

Figure 8.2 (2000) Thirty-five years of slow but steady load growth result in a year-2000 peak demand of 3,058 MVA, more than double 1965’s. In that time, Metropolitan Power and Light has added only one substation site and expanded the area of four others, as well as upgraded various 69 kV lines to 138 kV lines. Total substation capacity now stands at 3,400 MVA, (200 MVA each, a 56% increase), for a utilization ratio of 90%.
However, this system growth did not keep pace with peak load growth. Year 2000 capacity is 3,400 MVA, an average of exactly 200 MVA per substation, giving a utilization ratio against the 3,058 MVA peak load of 90%. Utilization ratio of the transmission lines has similarly increased. Equally indicative are the facilities ratios, load/substation and load/transmission route, as shown in Table 8.1. Metropolitan Power and Light has a lot of eggs in very few baskets.
At first glance it might appear that the system in Figure 8.2 is fully as capable of providing high reliability of service as the system in Figure 8.1. In actuality, the system is more vulnerable to certain types of outages at the sub-transmission and sub-station levels. This increased vulnerability is due to the following factors: 1) higher utilization ratio; 2) “a lot of eggs in one basket and; 3) design choices dictated by limited options for facilities.
Why Did This Happen?
Before turning to a discussion of the impacts these changes had on the cost and reliability of electric service, it is worth looking at why Metropolitan got into this situation. Over a period of three and one half decades, as its peak demand grew, its system did not keep pace in some ways, out of both choice and constraint. This did not occur because the utility planners did not forecast the growth: for the most part they saw it coming. It happened because, incrementally, the utility allowed itself to be backed into the situation. The major reasons were:
No sites available
In 1965, the downtown area served by Metropolitan Power and Light was already fully developed, in the sense that there was no vacant, never-built-upon land. However, much of it was not what would, 35 years later, be considered “downtown development.” There were areas of vacant warehouses, some run down old hotels, a number of gravel-covered parking lots scattered about, an old rail yard about to be redeveloped, and other areas of downtown where land was available, if rather pricey by standards of the time.
Over the next 35 years, this price and availability situation gradually escalated and seemed to stay one step ahead of Metropolitan. As the city and the economic region around it grew the vacant warehouses, old parking lots, available rail yard, and other developable sites in the downtown area gave way to new development, and the various sites that could have become new substations disappeared. Simultaneously, the price of real estate climbed. By year 2000, very few sites suitable for construction of a large capacity (nothing else will help, given the load levels) substation built upon traditional lines exist period. Those that do are very expensive, not just in terms of money, but in time and political capital that the utility might have to expend in order to obtain the site and all permissions and licenses required to built on it.
Political pressure
Any utility has to be cognizant of local community values and try to accommodate the wishes and preferences of local municipal leaders. Metropolitan Power and Light often found itself facing tremendous political opposition, both in city hall and at a local grass roots level, when it attempted to obtain new substation sites or rights of way for sub-transmission lines. Most of this opposition was directed at the overhead line rights of way it preferred to build to any new site it obtained, or at the inconvenience and traffic tie ups that would be caused by the construction required to build UG transmission lines in the central city. In combination with the often-perceived high costs of new sites, this political pressure blocked most moves to obtain new sites.
What really failed, in the authors’ opinion, was communication between utility and municipal authorities on a key point: the utility can easily do without any one of the sites or rights of way it requests, but in the long run it cannot make do if it is denied them all. In this respect, the utility had the responsibility to communicate this issue well to municipal leaders and community alike. It failed to do so. As a result, the incremental, repetitive process of overwhelming opposition on a site-by-site basis led, after three and one half decades, to a poor-performing system.
Financial pressure
Cost was always a major element of every decision made by Metropolitan Power and Light. As a regulated utility, it had an obligation to manage its affairs in a least-cost manner. Management throughout the 35-year period was never incompetent or inattentive; it wanted to make the best decisions regarding cost and system efficiency.
But a new substation site and the new transmission line right of way and the construction required to put those facilities into service always represented a very large budget item. As such, every go/no-go decision regarding a new substation received a great deal of scrutiny. Generally, Metropolitan Power and Light’s management was always pre-disposed to find some other way to bolster the system, some other change or upgrade that would avoid, or defer for a few years, the need for a very expensive new site.
In addition, in the late 1980s and throughout the 1990s, Metropolitan Power and Light, like most large investor-owned utilities, began to respond to the uncertainty created by deregulation, and increasing pressures to raise financial performance, by reducing operating and capital budgets by up to 30%. An executive goal was to see utilization ratio on the system rise – “to get more out of existing equipment.”
This led on several occasions to changes in loading policy, re-rating of transformers, cables, and overhead lines, and adoption of slightly less conservative rules with regard to available contingency margin and operating policy. Not building substations fit right into this push for budget reduction, because it avoided both large outlays of capital, and construction of new facilities whose maintenance would have swelled the O&M budget. In addition, the re-rating of equipment mentioned in the paragraph above “created” a good deal of new capacity at many existing sites, permitting the utility to keep pace with the load growth without adding new facilities, and still meet its engineering criteria.
No additional room available at existing sites
When it was not allowed to gain more sites, Metropolitan Power and Light had no choice but to serve the growing load from the sites it had. Load/site naturally had to go up, and it did, from 86 MVA in 1965 to 200 MVA/substations in year 2000. But this does not imply that utilization ratio had to go up. Metropolitan could have kept utilization ratio constant at 67% by increasing installed capacity at its 17 downtown substations to an average 270 MVA each. It did not do so for a variety of reasons, increasing it only to an average of 200 MVA, and letting peak utilization rate of its downtown substations rise to 90%.
Metropolitan Power and Light made its decision to let utilization ratios rise as a result of several mutually reinforcing trends. First, land adjacent to existing sites, for expansion, was simply not available in many cases, and its price when it was for sale was astronomical compared to what the utility was willing to pay. Secondly, the lengthy period for and uncertainty involved with negotiation and approvals for such special sites made trying to get them risky.
Thirdly, in the late 1980s and early 1990s, Metropolitan’s executive management decided to cut back on capital spending. It wanted to reduce budgets and try to “get more from existing equipment.” It had an inclination to let utilization ratios rise, and the situation in the central operating district played right to that goal. Perhaps Metropolitan would not have let the situation become so extreme had more expansion space been more available, but the fact is that because of its budget-reducing focus it did not fight for expansion room as hard as it otherwise might have.
These effects limited the number of situations where the utility added space to existing sites (it expanded only four of its sixteen original sites during the 35-year period). Thus, while the load grew by 122% during the thirty-five year period, Metropolitan increased capacity of its substations only to an average of 200 MVA/substation, up from 128 MVA, a 56% increase. Section 8.3 will show how this was even more damaging to reliability potential than the lack of new sites.
Other Options
Every time that Metropolitan Power and Light needed a new site, there were always other options available to the utility. Among them were reinforcement re-design and re-configuration of existing facilities, and other means that could provide capacity and contingency capability. Many of these were only “stop-gap” measures to defer the need for new sites for a few years, but in every case they had a lower first cost and met the existing criteria. While a very long-term view would have shown that a few new sites were necessary, the paradigm at work led Metropolitan to take other routes in nearly every case.
A contributing factor to these decisions was the characteristics of the traditional N–1 planning criteria and tools Metropolitan’s planners used to apply it, as will be discussed in Chapter 8. The utility planners’ tools did not alert them to the weaknesses that were developing in their system. The limitations of the “outdated system structure” they were evolving were not completely visible to them. As a result they were expecting better performance from the system than it could actually deliver.
Incremental Mistakes and Boiled Frogs
Traditional anecdotal wisdom holds that if one throws a frog into a bowl of very hot water it will immediately hop out. But, if that same frog is placed in tepid water, which is then slowly heated over a fire, it will float in the water until it boils to death. The authors have not verified that this is true (it seems unusually cruel to the frog and the authors have no desire to have a boiled frog on their hands). However, it is a good analogy to the way many utilities, including Metropolitan, gradually backed into a situation that they never would have accepted had they foreseen it. Certainly the situation with regard to substation sites was very gradual, with no one incremental event ever so dramatic as to trigger concern.
Another example of this is the gradual erosion of feeder system strength seen by many utilities in the 1980s and 1990s. Section 8.4 will discuss in detail the impact that the period 1965 to 2000 saw with respect to Metropolitan Power and Light’s primary feeder system. As the load grew and the number of substation sites did not keep pace, the feeder system had a gradually increasing burden placed on it. From 1965 to 2000, the load it had to distribute out of every substation grew by 109% (86 MVA in 1965, 200 per substation in 2000). At times this necessitated adding new feeders – Table 8.1 shows that the number of feeders grew by 47%. But to a large extent the load growth was accommodated by allowing the loading (utilization rate on feeders) to escalate.
Table 8.1 showed that average feeder loading increased by 50% during the period; an annual compounded growth rate of 1%. Such a small annual increase is easy to lose among the annual fluctuations in loading due to weather and load transfers, and never enough to raise alarm. This gradual increase in utilization of feeders eventually degraded much of the feeder system’s potential to provide high quality customer service, as will be discussed in Section 8.4.
Metropolitan Power and Light’s inability to see fully the impact of increased feeder loading on its system reliability was, as in the cases cited earlier in this section, partly a failure of its planning tools and engineering paradigm. Traditional distribution planing tools focused on “feeder at a time” short range analysis, techniques which cannot fully assess the feeder system impacts that increasing loadings and reduced contingency reach have on the emergency-backup capabilities among feeders.1 These tools fit the engineering and planning paradigm for distribution planning, which was to examine feeders in detail, but usually only on a one-at-at-time or small-area basis. Feeder system studies involving all the feeders in a region, modeled in company with the substations and sub-transmission, were never done. Therefore, Metropolitan's planners never realized that the degradation of feeder-level reliability, amounting to about a 25% increase in contribution to SAIDI, was occurring. Intuition and judgment alone did not alert the planners to the problem largely because of the very slow rate of change.
Poor Planning was a Major Contributor
The discussions above twice cited the limitations of traditional planning tools as a contributing factor in Metropolitan Power and Light’s getting into the outdated system structure situation without fully appreciating its implications with respect to reliability of service. Also cited were Metropolitan Power and Light’s lack of effectively applying long-range planning – of using too short-term a focus and not looking at the long-term implications and costs of a de facto policy of constant deferrals and opposition to any major projects.
A longer-range view of its system, even without modern planning tools, would have revealed that problems were going to occur. Even without the best planning tools, such a perspective would have drawn attention to the issue, at least qualitatively. In addition, a longer planning horizon would have permitted Metropolitan Power and Light to identify potential substation sites farther ahead and perhaps obtain them when they were affordable (or at least, less pricey).
Thus, ineffective planning – done with tools of limited capability, and on too short a timeframe – was a contributing factor in Metropolitan Power and Light getting into the situation that in found itself in as the new century began.
8.3 IMPACTS ON THE SUB-TRANSMISSION – SUBSTATION LEVEL
Section 8.2’s changes in system structure versus load level have a number of profound impacts on the performance of the electric system, not all of which can be appreciated by reference to utilization ratios or facilities counts alone.
1 For a comprehensive discussion of these issues see the Power Distribution Planning Reference Book, Chapters 13 - 15 (Willis, 2004).
Site Congestion
Metropolitan Power and Light was unable to get either as many new substation sites as it needed, or to obtain expansion space it could have used at many of its existing substations. As such, many of the substations in the central operating district became congested, in the sense that space was completely used, and a lack of available space was the limiting factor on installed equipment at most sites. This lack of space caused two interrelated design compromises.
Forced to chose capacity over configuration
Figure 8.3 illustrates a common problem and its solution for many utilities. An existing substation site must be expanded in capacity. While some additional room is available, it is insufficient. Faced with the lack of room for transformers (capacity) Metropolitan’s planners made the change shown at the right of Figure 8.3. Some breakers and buswork were eliminated, reducing switching flexibility, but freeing room for more transformer capacity. This permitted Metropolitan to double the installed capacity at the substation.2
Metropolitan traded switching flexibility during contingencies for more capacity. Lines in the system at the right are “hard wired” to each transformer (UG cable trunk connected). If either a transformer or a sub-transmission line fails, both have to be taken out of service. The failure rate of both is increased to the sum of the failure rates for both. Although this design may meet traditional N–1-planning criteria, reliability has suffered. The expectation of this outage occurring has increased, and the flexibility of switching when it occurs is more limited. (Chapter 8 will discuss this in much greater detail.)
Measures like those shown in Figure 8.3 were common in the evolution of many large metropolitan utility systems throughout the last quarter of the 20th century. Often, recognizing the need for capacity, the utility built the substation originally with a compromise in favor of capacity over configuration. A situation almost exactly like that depicted in Figure 8.3 was a contributory factor in the outages that plagued ComEd of Chicago during the summer of 1999.
Figure 8.3 shows only one possible way that configuration can be compromised in favor of capacity. It is not meant to represent in detail the exact way congestion problems were solved by any particular utility. But it represents fairly the type of compromises forced on utilities by crowded conditions in central-system substations and rights of way. Numerous other types of design compromises are possible, all sacrificing some or all configuration flexibility for capacity increases. The point is: lack of new sites and expansion room at existing sites forces utilities to deal with load growth by making sacrifices which always have consequences similar to the changes shown in Figure 8.4. Capacity increases, but interconnected strength and contingency support capability decreases, and with it the reliability potential of the system.
2 Breakers at the “sending end” of the transmission lines feeding this substation now provide protection for faults on the high side at this substation.
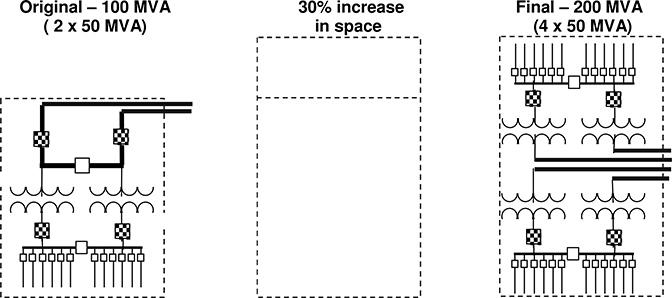
Figure 8.3 An existing site (left) needs to be doubled in capacity. Only a limited amount of expansion space (middle) can be obtained. The only viable solution is to delete high side buses and breakers and simplify the substation’s configuration, so more capacity can be installed (right). The utility chose capacity over configuration.
Higher Equipment Utilization
In spite of the efforts to often choose capacity over configuration, during the last third of the 20th century capacity growth did not keep pace with peak load growth in the Metropolitan Power and Light example given here, or in most large metropolitan systems in the United States. A primary effect of the changes in this case was the increase in utilization ratio, from a ratio of peak load to capacity for substations of 67% in 1965, to 90% in 2000. Again, as discussed in detail in Section 8.2, this occurred primarily because the utility could not get enough new sites, or enough room at existing sites, to provide all the capacity it might like. A contributing factor was management’s commitment to reduced capital spending, which favored increasing utilization of existing equipment anyway.
Regardless, an increase in utilization ratio has a tremendous negative impact on expected reliability of the system, one, which can be completely mitigated by a combination of artful engineering changes to the structure of the system (interconnection and configuration of switching) and operating policies. However, if not accommodated with such changes the increased utilization ratio will typically result in degraded reliability of service to customers.
In 1965, each substation transformer or line was loaded during peak periods to about 66% of its rating. This meant that if a substation transformer, or bus, or breaker fails, that 67% loading can be distributed over two neighbors (of equal capacity) who each take half, raising their loading during the contingency from the normal design peak of 67% to 100%. If brief overloads of equipment to 133% of rating are accepted during a contingency, the failed unit’s load can be fully supported by only one neighboring unit. Peak load occurs only a few hours per year (typically about 350) so this high level of stress is expected to occur rarely (only when peak load and a contingency occur). Off peak, the outage of even two units could often be supported by temporarily overloading only one remaining unit of equipment.
But in a power system with 90% loading, during peak load conditions a failed transformer or line now needs nine neighboring units, not two, to support its outage if contingency loading is limited to 100%. (The 90% loading on the unit has to be distributed among nine neighbors, who each have only 10% capacity margin to aid the situation.)
If equipment overloads are accepted during contingencies, the situation is still worse than before. At a 135% overload, two neighboring units are required to support the outage of the failed unit, not one as before. Table 8.2 shows required “contingency support count” for various combinations of utility utilization ratio (designed peak load/capability ratio) and contingency overload limit. It plots the number of units required for contingency support as a function of utilization ratio, for systems composed of identical capacity units.
High utilization ratios mean more interconnection is needed
Assuming those neighbors required for contingency support are available, they will only provide the required support if they can be connected to the load of the failed unit during the contingency. Thus, in a system loaded to 67% at peak, and permitting 133% overloads during contingencies, every substation transformer, bus, and breaker needs contingency interconnection to only one neighboring substation-bus-breaker combination in order for its load to be served even if it is out of service. But in a system designed to a 90% utilization criterion, even if contingency overloading is raised slightly to 135%, interconnection to two neighbors is required.
A system with a high equipment utilization ratio relies on interconnection capability to provide the measure of the contingency withstand strength not being provided by a healthy capacity margin.
Although it is a generalization and there are rare exceptions, a utility desiring to maintain reliability of service at traditional levels must increase the “strength” of its system structure. It must provide both more static and switchable paths to neighboring equipment (as the case may warrant), and make certain there is sufficient capacity in those interconnections to handle the contingency loading. Ironically, the trends covered in Section 8.2 and the substation space problems depicted in Figure 8.3, forced utilities to do exactly the opposite. Configuration was often reduced as utilization ratio was increased, for two reasons. First, a lack of growth in overall system structure (Figures 8.1 and 8.2) occurred simultaneously with the forced rise in utilization rate. Configuration of the system layout overall did not keep pace with load growth. Second, this capacity-over-configuration approach often compromises the interconnection strength that had been present. In the past, some utilities have failed to recognize the seriousness of the problem they are backing into, due to the limitations of traditional contingency-based design methods they are using to evaluate the situation.
Table 8.2 Contingency Support Count – Number of Neighboring Units Required to “Pick Up” the Load of an Outaged Unit (All Units Same Capacity)
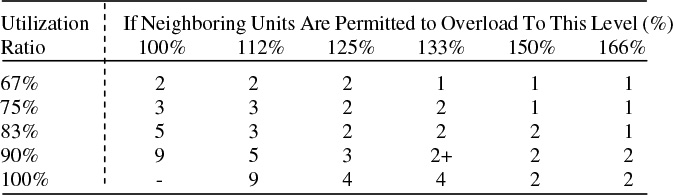
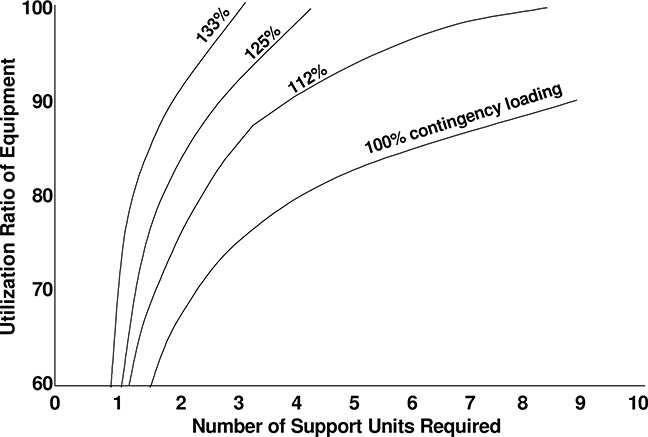
Figure 8.4 Number of contingency support units required to pick up the load of an outaged unit, as a function of designed utilization ratio for the system equipment (i.e., all units).
More frequent and higher periods of equipment stress
Another point worth considering is the impact that the high utilization rate has on the frequency and degree of emergency overload for equipment in the system. In a system with a utilization ratio of 67% and contingency limits of 133%, loading one neighbor of a failed unit to 133% can cover every equipment outage.
In a system loaded to 90%, every failed unit requires two neighboring units to be loaded to 135% of rating. Assuming for the moment that the number of equipment failures is the same in both systems (it would probably be higher in the 90% loaded system), this means that twice as many units are exposed to overloads in the 90% system as in the 67% system. Viewed from the standpoint of the system as a whole, twice as many units are overloaded in any given period of time, and loss of life due to emergency use of units has at least doubled.
Despite this, many utilities responded to the pressures discussed earlier by raising the contingency loading limits for their equipment. For example, one utility in the central United States raised its limits from 115% to 166%. This move was necessitated by the lack of system structure to provide the increased “contingency interconnectiveness” of the system discussed above. The only remaining way to cover the contingencies of many units of its equipment was to accept loading of some equipment to 166% during contingencies.
Chapter 7 discussed equipment loss of life as it remains in service, and the fact that overloads greatly accelerate the loss of life process, so that a unit loaded for several hours at 133% might lose the equivalent of several days or even weeks of normal service lifetime. The change from 67% to 90% loading, a 34% increase, doubles the number of “high stress events” for units like transformers and tie lines. If a utility responds to the increased utilization ratios it desires by increasing contingency loading limits so existing equipment is used at higher loading during contingencies, equipment lifetimes and failure rates suffer.
The result can have a major impact on system performance
Evidence from several large utility systems indicates that the effects covered in this section can cumulatively double the SAIDI contribution made by the substation and sub-transmission levels of the system, producing an increase of 15% - 20% in total system reliability indices.
Utilization Ratio Is Not the Culprit
High utilization ratio, per se, is not necessarily an undesirable element in power systems. Reliable and economical power systems with peak utilization ratios up to 100% can be designed and operated. However, the rise in utilization ratio must be accompanied by changes in the system’s ability to isolate outaged equipment and interconnect during emergencies to available contingency margin. The requirement for interconnection capability and flexibility rises along with system utilization ratio. Configuration must in some sense provide the strength that capacity margin does not. Increasing the utilization ratio without having sufficient configuration flexibility to accommodate it, is a mistake that will lead to deteriorated reliability of service.
8.4 FEEDER SYSTEM IMPACTS
This section examines the impacts the changes discussed in Section 8.2 make on the distribution utility’s primary voltage feeder system. It first provides a background discussion of feeder systems and reliability, then shows how section
8.2’s factors result in a general weakening of the feeder systems ability to provide reliability.
A well-designed and operated feeder system provides reliability of service to energy consumers in two ways, both of which are quite important in maintaining low SAIDI and SAIFI scores:
1. Feeder level reliability. It provides inherently good feeder level reliability by having immunity from outages of feeder system equipment, through switching capability combined with sufficient contingency margin to support reasonably expected outages of equipment in the feeder system itself.
2. Substation – sub-transmission contingency support. A strong feeder system can provide a measure of contingency support for failures of buses, breakers, and transformers at the substations, via load transfers away from the outaged equipment to other feed sources. This materially aids good reliability of service and is often the only viable approach to provide high reliability when utilization rates are high.
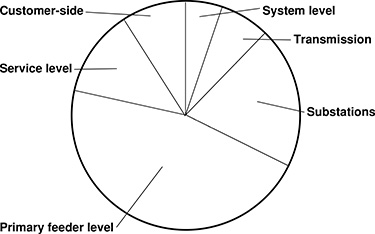
Figure 8.5 Allocation of SAIDI by level of the system for a large investor owned utility in Texas. Results here are based on the average of three years, 1996 – 1998.
Outdated system structure issues impact both areas. This section will examine in turn the impact that outdated system structures make on each of these two reliability aspects of feeder system performance.
Feeder Level Reliability
The primary voltage feeder system plays an essential role in the power system chain, taking the power from the substations to the vicinity of all customers. As such, its ability to perform its function in a reliable manner – to recover from outages of circuit elements and equipment – is essential to a good reliability record for the utility. Aging equipment, cables, and conductors in the feeder system all greatly impact reliability.
In almost all utility systems, the majority of customer service reliability problems is caused by problems on the distribution system, either the primary feeder system or the service-level equipment it feeds. Figure 8.5 shows typical operating results – about 45% of all customer outage minutes are due to problems that occurred on the primary feeder system, nearly twice as much as on the entire system-transmission-substation level.
The fact the feeder system is the major source of service interruptions in a power system is not the least surprising. In fact it seems inevitable. To begin, there is simply more of the primary distribution system than anything else in the power system. It consists of thousands of miles of line and tens of thousands of units of equipment.3 There is simply more equipment to fail. Additionally, in all but very rare cases, the primary feeder is radial in design, consisting of a single serial chain of lines and equipment leading to each customer. Any failure in this type of system will lead to an interruption of service to one or more customers.
3 The authors are counting service transformers as part of the primary feeder system in this example, because they are energized on the high side at the primary voltage level.
And finally, the feeder system is distributed – in fact it is the ultimate distributed resource belonging to any electric utility – a system of many, many units of equipment scattered about the system in roughly the same pattern as its customers. As such, locations of failures and repairs are scattered throughout the system, too. Unlike the substation level, the failed equipment will not be at a few well-identified sites. It often takes time – as much as an hour of searching in some cases – for repair crews to find the location of a failure.
Thus, the feeder system is the source of nearly half of a utility’s service reliability problems, because of its great extent, radial characteristics, and distributed nature. As such it is particularly sensitive to the increasing failure rates of aging equipment. The aging equipment trends (Chapter 6) mean that both “clear weather” and storm-related failure rates on the feeder system tend to increase rapidly with equipment age. Attention to the feeder level is critical just because so many failures occur there during the best of circumstances. So here is the potential for the increasing failure rates of aging equipment to cause very noticeable increases in SAIDI and SAIFI – even a small increase in such a large portion of the system will make a very perceivable difference.
Outdated System Structure Impacts on the Feeder System
Basically, many of the trends discussed in Section 8.2 lead directly or indirectly to changes on the feeder system that limit its ability to transfer loads, both to restore outages that occur in the feeder system, and to provide inter-substation transfer capability to mitigate substation-level outages.
Non-optimal feeder getaways and routes
Section 8.2 alluded to the fact that one consequence of outdated system structures is that existing substations are called upon to serve more loads than would ideally be the case. Figure 8.6 shows one consequence of this. The higher load requires more feeders (Recall that in the example in Section 8.2, the utility added 47% more feeders than originally intended to some of its substations, a typical situation.)
Getting so many more feeders out of a substation than originally designed may create a lot of headaches with regard to routing, configuration, and exposure. Often, feeder getaway constraints – limits in how much space is available above and below ground to run feeder circuits out of a substation – is a limiting factor in its total load. Less than ideal (from the standpoint of economics, esthetics, and reliability) design compromises may be required simply to accommodate the sheer number of separate circuits. Reliability suffers due to a host of secondary effects.
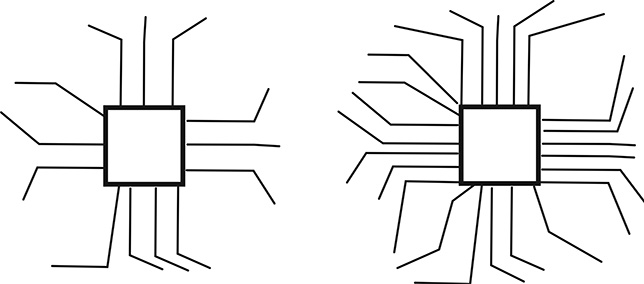
Figure 8.6 Left, as originally planned, one of Metropolitan Power and Light’s substations was intended to serve 86 MVA of peak load with 13 feeders, each loaded to about 6.6 MVA. Right, as eventually operated by the utility due to outdated structure constraints and pressures, the substation served 180 MVA through 23 feeders (7.82 MVA). The additional feeder getaways often represented relatively costly designs compared to feeders planned in the initial layout of the substation, and suffered from compromised esthetics and more importantly, lower reliability than needed.
Non-optimal routing
Similar to the getaway problem, a utility may find that additional circuits it has to “work into” an area beyond the number originally planned forces it to use routes and layouts that normally would not have been acceptable. Otherwise, more circuits and higher level of loading could have been accommodated well if the entire area had been originally planned with those in mind.
However, typical if an area is planned to a lesser density and then upgraded, it is not possible to re-engineer it to the same level of economy and reliability after the fact. Circuit routes have been committed and constraints accepted in certain ways in the original design. Subsequent development in the area has reduced additional routes available to the planners.
The additional feeders often have to take routes that are less reliable than desired (heavy tree populations in areas difficult to trim or exposed to auto traffic along roads). Double-circuit pole routing of feeders (two feeders on one set of poles) often has to be used. Common mode failures (one event taking out more than one feeder) become much more likely. Switch locations and switching patterns often cannot be well arranged with so many feeders in such a small region.
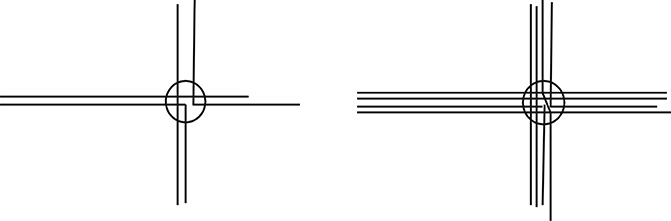
Figure 8.7 Left, four feeders (lines) pass through a large cable vault (circle). Right, in the expanded feeder system, eight now populate the vault. Exposure has increased greatly: there is both more likelihood of a catastrophic failure (there is more equipment in the fault) and any problem potentially hazards twice as many feeders.
Duct crowding/exposure
In underground distribution systems, the attempt to fit as many feeders as possible into existing duct space will reduce reliability through two secondary effects (secondary effects make a substantial impact on performance and cannot be avoided using ordinary practices and means):
1. Heating. More cables in a highly populated duct will lead to greater amount of losses and more heat for all cables. Good engineering will assure heat buildup stays below limits, but nonetheless thermal stress on cables will be higher than it would be otherwise. Lifetime of cables may be noticeably shortened and failure rates increased.
2. Common mode failure exposure goes up greatly, as shown in Figure 8.7. Here, more feeders means more feeders passing through each cable vault, where a fire on one can now endanger more feeders.
In addition, there are two tertiary effects that exacerbate problems (tertiary effects make a noticeable impact but generally can be mitigated or avoided entirely through extra attention or effort to the application of standard practices).
3. Complexity. There can be so many cables in vaults that it inhibits the progress of work. Identifying which cable is which, accessing one while work on others is being done, can become a noticeable issue.
4. Old collapsing ducts. In the central parts of many cities, old ducts are collapsing or warping, making it difficult to pull cable, etc. Fitting as many feeders as possible in older ducting is an example of putting too many eggs in one basket.
The net effect: a noticeable increase in failure rate
Operating experience at one large investor owned utility showed that areas where additional feeders had to be added “after the fact” had an 11% higher frequency of outages than those areas where the system corresponded to the original planning. This was an 11% increase in the frequency of outages of equipment on the feeder system, leading to an 11% increase in the contribution that feeder system makes to the overall system SAIFI. The causes seemed to be an amalgamation of all the reasons listed above. Assuming that Figure 8.5’s statistics showing that 45% of all reliability problems are feeder-related applies here, this 11% increase in problems on the feeder system means that feeder-related problems caused just by outdated system structure problems contribute to 45% x 11% = a 5% increase in the overall system SAIDI.4
4 Strictly speaking, Figure 8.5 refers to contribution to SAIDI by level of the system – duration of outages – whereas this discussion refers to frequency of outage, a difference factor. However the authors assume the two are comparable here for the purpose of demonstrating the degree of importance of this concept.
Using the Feeder System to Mitigate Problems Caused by Substation-Level Outages
One of the most effective, if not the most effective, ways to support substation transformer outages in systems with high substation and sub-transmission utilization ratios is through the feeder system. When a transformer is loaded to 90% of its rating, as it is during peak in many utilities forced to high utilization rates by the issues covered in Section 8.2, avoiding lengthy customer outages when it fails means transferring a lot of load to other equipment, quickly. If the failed unit has only one neighbor that can interconnect to provide that support, that unit must go to 180% of rating – a level considered too high in all but extreme cases – or all of the load cannot be served. Concern over such high contingency loading levels is largely the reason why traditional utilization ratios for substation transformers were targeted at 66%. When one of two units at a substation failed while running at that level, the other had to go to no more than 133% of normal rating – a high but acceptable loading during a contingency.
One way to design a system so that any transformer has more “neighbors” that can support it during an outage, is to have more than two transformers at each substation. Some utilities (Houston) traditionally designed most of their distribution substations with four transformers. Loss of any one, even if loaded to 100% at peak, meant the load could be distributed among the remaining three with only a 133% overload of each. Transformer, bus, breaker, and similar contingencies could be contained within each substation, with no support needed for neighboring substations.
But in many cases, three- or four-transformer substations are not an efficient investment. In most cases, the economy of scale for transformers is greater than that for multi-transformer substation layout. Thus, for a given required capacity, two large transformers prove to be much more cost-effective than four smaller ones.5 As a result, as much as there is any “standard” substation layout used in the United States, it is the two-transformer substation, composed of two like units (same capacity). In a power system based on these types of substations, any outaged transformer-bus-breaker combination unit would have one remaining neighbor to provide contingency support (in the substation). The utility has three choices for a viable contingency plan for these outages.
1. Limit loading on the substation to what one transformer can take under contingency conditions. A few utilities have shifted to permitting 166% loading during contingencies (for brief periods), permitting up to 83% loading of the substation. Most, however, limit loading to 75% under normal conditions with a 150% contingency loading, still a very aggressive contingency loading level.
2. Provide support with a mobile transformer/substation. The plan being that a mobile spare could be brought to the site “within a few hours.” The utility accepts a brief outage during that time as the nominal result of a transformer failure. This is often not a palatable option because the average mobile substation-response time is actually 12-18 hours.
3. Provide support for transformer outages through the feeder system. The concept here is that the load of the failed transformer is split – the remaining transformer at the substation picks up part of the load, and the rest of the substation’s load is transferred to neighboring substations via re-switching of the feeder system.
This can be implemented via “programming” of the protection and breakers scheme in one of two ways.
1. Upon a failure of one unit, the remaining transformer picks up the entire load it can within its contingency rating. For example, if loading on both transformers was at 90%, the remaining unit goes to 135%, picking up half the failed unit’s load. The other half is dropped temporarily. Feeders are then switched to transfer load from the substation to neighboring substations, so as to pick up the load that was dropped. This may be done with remote switching, but is most often accomplished by manual switching, taking up to two hours.
5 Houston Lighting and Power (Reliant Energy) has a somewhat unusual situation in that its load density is much higher than average due to the intense amount of air-conditioning demand in the Houston area. Four transformer substations are therefore quite efficient in Houston’s case.
2. The remaining transformer immediately picks up the entire load. This means it would go to 180% of rating during peak, a level at which it is very quickly giving up lifetime to serve the load. As quickly as possible, feeders are now switched to transfer load to neighboring substations to bring loading down to a lower level for the duration of the contingency.
This scheme puts transformers (and buses and breakers associated with them) under high stress for brief periods, but avoids customer interruptions. If the switching is well managed, as for example with a computerized restoration system at the utility dispatch center, it can be done quickly enough to avoid large stress-induced loss of life on the one remaining operating transformer.
Figure 8.8 uses a simple example to illustrate the “transfer to neighbor through the feeder system” concept.6 At the left, a two-transformer substation with a hexagonal service area has boundaries with six (also hexagonal) neighboring substation areas. Transformers in this example are loaded to 90% of rating at peak, by design. Also shown are six feeder areas (three per transformer) alternating radially between each of the substation’s two transformers.7
In this example, when one transformer is out of service during peak conditions, the other picks up what load it can, going to 135% of its normal rating. The remaining load, corresponding to 45% of a transformer’s capacity, is transferred to neighboring substations through feeder re-switching. As shown, the concept is to transfer the peripheral load of the substation – the load closest to the neighboring substations. This assures the shortest electrical paths for the contingency-switching feeders (for voltage drop consideration). See Chapter 8, Section 3, for a fuller discussion of how switching capability like this is designed into a distribution system and what its benefits can provide. Support of transformer outages through the feeder system results in no, or very short duration, interruptions of service compared to the multi-hour or day-long outages if mobile transformers or other options have to be implemented.
6 See Chapters 13-16 in the Power Distribution Planning Reference Book – Second Edition (Willis, 2004).
7 This radial alternation scheme promotes feeder contingency support. See the Power Distribution Planning Reference Book – Second Edition, Chapter 14, particularly the discussion with respect to Figure 14.16, (Willis, 2004).
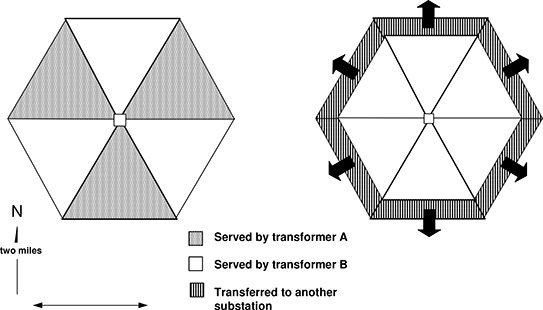
Figure 8.8 Left, hexagonal substation area with borders to six neighboring substation areas. This substation has two transformers that loaded to 90% of their rated capacity at time of peak demand. Under normal circumstances the two transformers, A and B, each serve half the load. When transformer A fails, unit B picks up half of A’s load, going to 135% of its rating, and 22.5% of each of the transformers’ loads is transferred to feeders from neighboring substations. In this way the utility can “get by” with loading transformers at two-transformer substations to 90% of rating at peak demand, and still have a viable contingency capability for the failure of either one. See text for details.
A Useful Concept: Feeder System “Strength”
In order for the feeder system to work well for contingency support in the example given, the feeder system must be able to transfer 22.5% of the substation’s load to neighboring substations (45% of one transformer’s load equals 22.5% of the substation’s). If the feeder system is not capable of transferring 22.5% of the load, the system dispatcher is forced to choose between dropping load (interrupting service to some customers) or loading the remaining transformer to an unacceptably high, potentially damaging, level.
On the other hand, if the feeder system can transfer more than 22.5%, then that capability can be used for support transformer contingencies even if design loading of the substation is raised beyond 90%. If it can transfer 35% of each substation’s peak load, then utilization ratio can be raised to 100% of transformer rating while still preserving contingency support capability.
The contingency strength of a feeder system is the portion of the substation load that it can transfer to neighboring substations while keeping voltages and circuit loading on the feeders within the utility’s standards for contingency operation.

Figure 8.9 Feeder system strength (inter-substation tie capacity) versus utilization ratio of transformers under normal conditions that can be tolerated while still preserving contingency capability for the outage of a transformer at a two-transformer substation. For example, the graph indicates that if a contingency loading of 166% is allowed by standards, then normal target loading must be limited to 83% if the feeder strength is zero, but can go to 100% if feeder strength is 17%.
Figure 8.9 shows the utilization ratio for a two-transformer substation that can be supported in contingencies versus feeder system strength – feeder system inter-substation transfer capability. The term “inter-substation transfers” refers to load transfers between substation service areas. The term “intra-substation transfers” refers to load transfers among feeders in the same substation area. Several different lines are plotted representing various levels of contingency loading limits. For example, the “133%” line represents the combination of utilization ratio and feeder system strengths needed to assure full contingency capability when contingency loading is limited to 133%. The Y-intercept values for each of the lines represent the maximum utilization ratio that a utility can use at a two-transformer substation given that no load will be transferred to neighboring substations in the event of a transformer outage. As can be seen, greater transfer capability through the feeder system means greater utilization ratios can be applied in the normal operation of the system.
Loss of Contingency Reach Due to Obsolete System Layout
“Reach” is the distance that a feeder system can move power while staying with the voltage standards applicable for its operating conditions. For example, a 12.47 kV, three-phase, overhead feeder of typical industry design, using 4/0 ACSR conductor, can move power corresponding to its thermal limit (the maximum amount of power possible within its current rating, 340 amps/phase, corresponding to 7.3 MVA) a distance of 1.8 miles before voltage drop on the line reaches 7.5% - the maximum permitted on the feeder system according to many electric utility voltage standards. This distance is 4/0’s thermal reach.
Substitution of another conductor will not materially change this distance: a 336 conductor will move its thermal limit (530 amps corresponding to 11.5 MVA) 1.8 miles; a 636 AA (770 amps, 16.6 MVA) will move its thermal limit 1.7 miles; a #2 ACSR (130 amps, 2.8 MVA), 1.8 miles. The larger conductor has lower impedance (less voltage drop per ampere) but a higher thermal limit. The two factors compensate for one another. Thus, the thermal reach of a 12.47 kV feeder system and the distance it can move power if operating at its thermal limits is 1.8 miles, regardless of conductor size.
Economic reach refers to the distance that power will travel on feeder segments before encountering the maximum allowed voltage drop, in situations conductor size and loading have been selected so that all conductor operates at or near its most economical loading level over the course of a year.8 The economic factors, load characteristics, and design standards that affect determination of economic loading vary from utility to utility. But again, the economic reach of each type of conductor turns out to be about the same. Under typical conditions economic reach works out to about 3.6 miles – about twice thermal reach (economical loads are usually about ½ the thermal limit).
Contingency reach refers to the distance that power can be moved on the under contingency conditions, when higher loading levels and more liberal voltage drop limits that are permitted. Again, standards vary from one utility to another. But as an example the ANSI C84.1-1989 standard specifies range A voltages as design criteria for normal conditions on the system, with a 7.5% maximum voltage drop on the primary feeder system permitted (9 volts on a 120 volt scale). It states that Range B voltage ranges apply in emergency situations, permitting up to 13 volts on a 120 volt scale (10.8% voltage drop).9
Thus, according to this standard, during a contingency a distribution utility is permitted to operate feeders in the affected area with up to 10.8/7.5 equals 144% more voltage drop than under normal conditions. This 44% additional voltage drop can be “spent” by either moving more power (more current equals more voltage drop) or by moving power over a longer distance (longer distance equals more voltage drop), or in some combination of more power moved a greater distance which is the normal case.
8 For a detailed explanation of how economic loading is determined for conductors and for a distribution system, see the Power Distribution Planning Reference Book – Second Edition, Chapters 11 and 12 (Willis, 2004).
9 See the IEEE Red Book - Recommended Practice for Electric Power Distribution for Industrial Plants (IEEE, 1990).
Generally, due to a bit of margin built into a feeder system for a variety of secondary and tertiary reasons, there will be a bit more voltage drop margin than minimum.10 Thus, under most circumstances it would be reasonable to expect about 50% – 60% to be the permissible additional margin, over and above normal peak load conditions, rather than just the 44%.
10 There are only a limited number of different conductors available. Often in “optimally sizing“ a particular segment engineers determine that one size is a bit too small, the next size a bit too large, to be exactly optimal. Necessity dictates they pick the larger size, which provides a bit lower voltage drop than technically necessary – additional margin for contingencies, among other things. In typical systems this adds about 10% to the available voltage drop margin.
Consider again Figure 8.8 and its example of transfers to other substations. Note that 22.5% of each feeder’s load is transferred to neighboring feeders. Roughly speaking, the additional distance for power flow is about 20% farther (assume for the moment that the other substation areas/feeder areas are the same size and shape as those in the drawing). Thus, additional loading times additional distance (122.5% x 120%) is very close to the 144% limit. If this feeder system is well designed and operated such that normal loadings are kept in the most economical range for all conductors (as it ideally would be) then no substantial reinforcement of its elements should be required to provide the required level of contingency support.
Little if any additional capacity needs to be installed to provide this contingency support. A well-designed feeder system with all conductors sized to be most economical, and with switching designed for inter-substation support, can be built at very little if any additional cost (beyond the extra planning and engineering work required) over a system that does not have these capabilities.
However, consider what happens when the loading on the feeder system is permitted to creep upwards, as occurred to Metropolitan Power and Light example case in Section 8.2. Over the course of three and one-half decades an increased loading on the feeder system was accepted as an inevitable result of changes the utility could not stop. Although reinforcement of the feeder system was done from time to time, substituting larger conductors where necessary, many portions of the feeder system ended up running at above their most economical loading ranges. As a result, they lose reach.
The net result is that a situation like that depicted in Figure 8.10 can occur during a contingency. There, two feeders for neighboring substations are shown (each a triangular area corresponding to the triangular feeder areas in Figure 8.8).
The rightmost feeder’s substation transformer has failed. Its outer 22.5% load has been un-switched from the substation (opening switch B), and the feeder tie switch at point A closed, so that the feeder at the left can pick up the outer most load from feeder B. Due to higher feeder loadings, the feeder system does not have the contingency reach to provide this capability. The dotted line in Figure 8.10 shows where voltage drops below unacceptable levels.
The outdated system structure issues discussed in Section 8.2 created two effects that led to this situation:
1. Loss of contingency capability. A combination of higher substation utilization ratios and higher loadings on the feeder system lead to a large shift in the ratio of capability available/capability needed. Higher substation ratios raise the amount of load that needs to be transferred over the feeder system during contingencies. Also, higher loadings on the feeder system reduce the voltage drop margin available for contingency reach. As a result, the number of situations and hours per year (near peak) when contingencies cannot be supported increases. Reliability of service suffers.
2. Contingency capability preempted by planning. In many systems, local pockets of load growth are accommodated without reinforcement of the feeder system in the area, via load transfers. For example, suppose that in Figure 8.9, the “contingency” that occurred was a planning contingency: the load in the feeder area on the right grew to be 10% more than that feeder could handle while staying within standards, but the feeder on the left had 10% margin. Utility planners can avoid any reinforcement cost by performing the switching operation shown, as a permanent solution to the “overloading” problem. This “fixes” the normal operating problem but leaves insufficient contingency capability in the system.
Feeder Problems Often Don’t Get the “Respect” They Are Due
While the feeder system is critical to any utility’s establishing a good record of reliability, failures there never cause the widespread, “headline grabbing” problems that failures at the substation and sub-transmission level can cause. The failure of an entire feeder might drop service to between 500 and 1,500 customers. By contrast a bad problem at a substation can drop twenty feeders at once, causing a widespread outage that garners serious attention from newspapers and community leaders. For this reason, efforts to fix aging infrastructure problems often focus on levels of the system other than the feeder system. Still, the feeder system is an important part of the system, and as shown can be an important resource in limiting the impact of substation – sub-transmission outages. Therefore, attention given to it is more important in the overall reliability equation than is often realized.
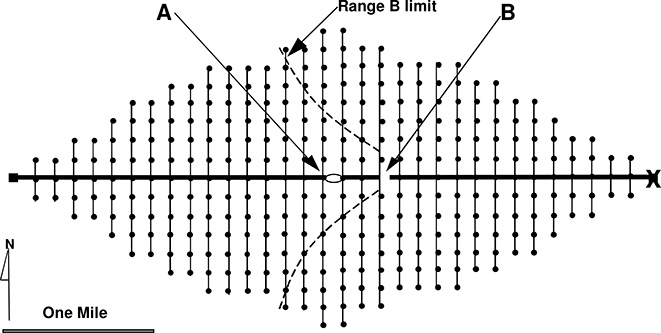
Figure 8.10 Here, the feeder on the right has experienced a failure at the substation (shown by an X). Switch B has been opened, switch A has been closed, so the feeder on the left can support both all of its load and the outlying 22.5% of the other feeder’s load (the rest is supported by switching the outaged feeder truck to another feeder near the substation). The feeder on the left is now serving 122.5% of its normal load, over a distance of transmission that is as much as 15% more. Dotted lines show the points where voltage drop reaches range B limit.
For this reason, efforts to fix aging infrastructure problems often focus on levels of the system other than the feeder system. Still, the feeder system is an important part of the system, and as shown can be an important resource in limiting the impact of substation – sub-transmission outages. Therefore, attention given to it is more important in the overall reliability equation than is often realized.
Outdated Structure Impact on the Feeder System: Reliability
Regardless of whether one or both of the situations discussed above develop the effect on reliability is the same. A growing portion of the equipment outages, which could potentially lead to widespread, lengthy interruptions (i.e. outages of major equipment at the substations) now have no viable contingency support.
In several large metropolitan systems outdated system structure issues (Section 8.2) eroded feeder contingency support strength due to these two reasons, to less than 40% of what was required to meet system needs, a loss of 60%. Figure 8.5 showed that substation – sub-transmission related problems cause about 25% of system SAIDI. Assuming again that Figure 8.5 is reasonably close to the distribution of frequency-of-outage causes in the system (see Footnote 6) and that degradation in results is proportional to degradation of capability (it is actually worse), this 60% reduction in capability to support substation-level problems would lead to something along the lines of a 15% increase (60% x 25).
This impact on reliability is roughly three times the impact on system reliability that issues related to feeder system reliability cause (that came to 5%). Overall then, outdated system layout problems (Section 8.2) lead to a 20% net increase in reliability problems, just due to their impacts on the feeder system alone.
8.5 FIXES FOR OUTDATED SYSTEM STRUCTURES
There are no simple, inexpensive solutions to problems of the magnitude discussed in this chapter. However, there are solutions, which are more effective and less expensive than trying to reverse the various impacts of aging infrastructure by adding more sites, more facilities, and reducing utilization ratios to traditional levels and practices. These require innovative approaches that often break with traditional concepts and practices.
Improved Communication with Community and Regulators
Electric utilities have to do a better job of identifying to those who approve their plans that new facilities and sites are needed if long-term reliability and service quality is to be kept at high levels. The quality of results that utilities obtain from their communication with regulators and community varies greatly. All utilities would be wise to emulate the methods employed by utilities that are particularly effective in this manner, such as PSE&G.
Compact Substation Designs
The compromises of capacity over configuration as illustrated by Figure 8.4 are simply unacceptable in a system where utilization rate is kept high and reliability is a priority. A better solution is to find a way to “cram” more capacity into existing sites. This can be done to two levels of improvement:
1. Compact designs. Various means exist to reduce the space required for air-insulated substation equipment. Usually this entails re-building the substation upward rather than outward. Among the items used are “low footprint” transformers, and high rise buswork designed to use little horizontal real estate (which as a consequence has a much higher profile). Compact designs can typically increase the capability of a substation (as measured by additional capacity added without any sacrifice in configuration) by up to 25 – 30%. Often this is not enough to provide all the improvement needed.
2. Gas-insulated switchgear. The solution of favor for crowded conditions in urban areas throughout Europe is the gas-insulated switchgear (GIS) substation, the so-called substation in a bottle. Slightly more than half the metropolitan substations throughout Western Europe utilize GIS technology. GIS substations have all of their busy-work and breakers contained inside a set of linked insulating capability. Voltage clearances between equipment can be much tighter than with air-insulated equipment, and the weather-protection rendered by the enclosures and gas means that much more compact designs can be used for all equipment. As a result GIS equipment requires far less space than its air-insulated equivalents.
GIS substations can increase the capability of a substation site over that obtainable from the tightest possible use of traditional air-insulated equipment, by a factor of at least three. If need be, an old 160 MVA site could be rebuilt with close to 500 MVA of capacity. Very often full use of this capability is not needed, but usually a doubling of capability, or potential for eventual growth, is implemented when GIS is retrofitted to a site. GIS also makes sense as the construction standard for new substations in aging infrastructure areas, because it enables the utility to have a much wider choice of available sites. Its compact nature and the fact that it can be put inside medium-sized buildings, means it will fit in many places that previously had to be rejected.
GIS substation equipment costs about 15% – 30% more than air-insulated alternatives. However it is slightly more reliable than, and requires much less maintenance cost than, air insulated designs of equivalent capability, basically more than canceling out this high initial cost if evaluated over ten or more years of operation. In addition, its minimization of real estate needs also contributes to lower cost for land, a major consideration and often more than enough to offset the higher initial equipment cost.
Reinforcement of Feeder Trunks and Switching
Given the typical effects of outdated system structures on the feeder system, providing the capability required for support of substation-level contingencies, will mean reinforcing feeder trunks with larger conductors, and installing additional switches for improved flexibility of operation. This is usually money well spent, and if planned well and coordinated with operation planning, feeder reinforcement for improved contingency capability is among the most effective ways to spend limited funds to obtain improved reliability of service.
Improved Planning
Improved planning can contribute significantly to a utility’s both avoiding the situation depicted in this chapter, and mitigating its effects if it is already in such a situation. Good planning provides foresight, rational consideration of options, and under the right conditions, innovation. The following recommendations should be taken as a whole: they provide the proper type of planning for aging infrastructure areas as well as for utilities who need to maximize both customer service and stockholder (financial) performance. Chapters 12 and 13 will discuss this in more detail.
Section 8.2 cited ineffective long-range planning as a contributing cause to many of the causes that ultimately lead to outdated structure and poor reliability. These problems have to be fixed before lasting solutions can be put in place. Chapter 8 covers the nature of several problems with traditional planning tools. Chapters 11 and 12 discuss how improved planning methods and tools appropriate for modern high utilization-ration systems can be effectively used.
But more is needed. Section 8.2 showed that a large measure of the problems utilities created for themselves were due to simply not looking far enough ahead or not using long-range planning capability that was there. Thus, in addition to changes in method and technique, utilities must simply pay attention to and use the longer-term perspective and evaluation of long-term consequences that flow out of long-range analysis of the consequences of growth and aging.
Two-Q approach
Chapter 4 introduced the concept of Two-Q planning, in which both quantity and quality of demand are viewed as burdens that set requirements for the system capability, and through which capability for both quality and quantity is arranged in an optimized fashion.
Two-Q planning explicitly identifies situations where new sites and new equipment are needed not for capacity (kVA) reasons alone, but for reliability reasons, and shows how much and why these needs arise. It makes such reliability-related requirements very clear and puts them in a context that is both communicable, where their justification is easier to make to executives and regulators alike. Two-Q is recommended both because it leads to a better understanding of reliability-related needs and the role elements of a long-range plan may have with regard to reliability, and because it provides a much better format and more documentation of need for their justification.
Reliability-based feeder system planning
The feeder system can be designed in a reliability-based manner to provide both better reliability itself, and more contingency support for substations, using methods discussed in Chapters 11 and 12.
8.6 SUMMARY OF KEY POINTS
“Outdated system structure” refers to a host of problems created for a utility when it cannot, or will not, expand its system’s layout and number of key substation sites and sub-transmission rights of way in company with the increasing demand for quantity and quality of power that a growing local economy and population provides. Key aspects of this impact are:
1. Operation of the system from fewer than an ideal number of substation feed points.
2. Compromises in design that sacrifice configuration for capacity.
3. Acceptance of very high utilization rates, even if not the utility’s economic standard, just because there is no room for other options.
4. Degradation of feeder system reliability and its ability to provide support during substation and sub-transmission level outages.
5. The situation developed gradually over many decades, the result of many small decisions and compromises none of which was recognized for what it was: failure of a long-term strategy to maintain a sound structural strategy for the system.
The net effect of outdated system structure issues, above and beyond the impacts of aging equipment itself, is an increase in reliability indices (SAIDI and SAIFI) due to impacts on the substation – sub-transmission and feeder levels of the system. Table 8.3 lists typical levels of impact. These structural impacts exacerbate the reliability of service and system efficiency problems generated by the deterioration of old equipment.
Table 8.3 Overall Impact of Outdated System Structure Issues on Customer Service Reliability
Level |
Typical Amount Of |
Substation/sub-transmission |
15% - 20% |
Feeder system reliability |
5% - 15% |
Feeder system contingency support |
15% - 20% |
Total |
35% - 55% |
REFERENCES AND BIBLIOGRAPHY
J. J. Burke, Power Distribution Engineering – Fundamentals and Applications, Marcel Dekker, New York, 1994
R. E. Brown, S. S. Venkata, and R. D. Christie, “Hybrid Reliability Optimization Methods for Electric Power Distribution Systems,” International Conference on Intelligent Systems Applications to Power Systems, Seoul, Korea, IEEE, July 1997.
R. E. Brown, S. Gupta, S. S. Venkata, R.D. Christie, and R. Fletcher, ‘Automated Primary Distribution System Design: Reliability and Cost Optimization,’ IEEE Transactions on Power Delivery, Vol. 12, No. 2, April 1997, pp. 1017-1022.
R. E. Brown, S. Gupta, S. S. Venkata, R.D. Christie, and R. Fletcher, ‘Distribution System Reliability Assessment: Momentary Interruptions and Storms,’ IEEE Transactions on Power Delivery, Vol. 12, No. 4, Oct 1997, pp. 1569-1575.
Institute of Electrical and Electronics Engineers, Recommended Practice for Design of Reliable Industrial and Commercial Power Systems, The Institute of Electrical and Electronics Engineers, Inc., New York, 1990.
H. L. Willis, Power Distribution Planning Reference Book – Second Edition, Taylor and Francis, Boca Raton, 2004.
H. L. Willis and R. W. Powell, "Load Forecasting for Transmission Planning," IEEE Transactions on Power Apparatus and Systems, August 1985, p. 2550.