
11 Equipment Condition Assessment
11.1 INTRODUCTION
Assessment of the condition of power system equipment, and decisions about what service and utilization is appropriate for each unit, begins with the inspection, testing, and diagnostic methods covered earlier in this book. These basic tools for condition assessment provide the data, which when interpreted, lead to decisions regarding:
1. Whether the unit is suitable for service or must be withdrawn and repaired.
2. Whether more comprehensive, invasive, and expensive tests are justified before making such a decision.
3. The condition of the unit – if and how it deteriorates with age and service and its viability for future service.
4. To be effective, inspection, diagnostics, and testing must be applied in a carefully coordinated program that also uses the results from system operation (trouble reports) to identify overall equipment condition and performance, and that prioritizes preventive maintenance, repair, rebuilding, and replacement. Optimum results are derived by then loading equipment to levels determined based on its assessed condition, the loss of lifetime caused by the usage, and the available economic alternatives. Procedures for organizing and managing such programs will be discussed in later chapters. This chapter focuses on condition assessment inspection, diagnostics, and testing methods themselves.
This chapter discusses the concepts behind condition assessment and condition tracking, and their use, the testing needs and approaches for each major class of power system equipment, and how they are organized into a program of condition assessment. Sections 11.2 and 11.3 discuss condition and state analysis of equipment, and analysis and modeling of them for asset management purposes. Sections 11.4 through 11.8 discuss in turn the testing and diagnostic needs of various categories of equipment, in sections for transformers, breakers and switchgear, underground cables and equipment, overhead lines and equipment, and service transformers. Section 11.9 provides some detail and examples of assessment analysis methods in practice, including using test results to reach conclusions about equipment condition – and draws some conclusions about what testing and diagnostics can and cannot do. Section 11.10 provides a summary of condition tracking, which is typically where most organizations want to be with regard to the use of condition assessment. Section 11.11 concludes with a comparison of needs among the various classes of equipment and a summary of key points.
11.2 WHAT DOES “CONDITION” MEAN?
Condition means pretty much what any person or group using that term wants it to mean. Everyone agrees that “condition” refers in some way to if and how much a unit of equipment or a system is in working order and likely to remain there for a period of time. But one can cite a number of slightly varying dictionary definitions, standards group usages, or books like this one to defend a particular definition or push its use over others, and companies differ in how they use and view condition, beginning with how they define it. Here, it is defined as:
Condition is a meaningful gradation or classification based on all important characteristics of the unit of equipment related to actions required for its proper management.
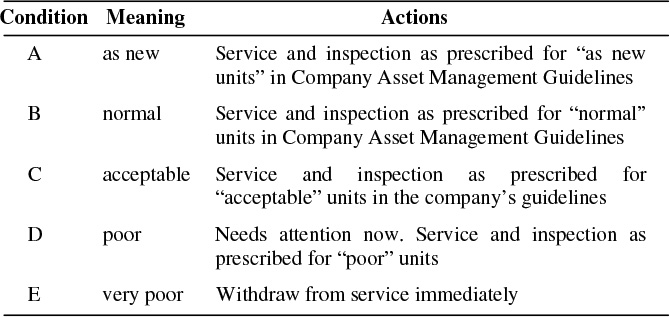
Condition usually has a range of variation from something like as new to very poor – withdraw from service immediately, with several intermediate grades in between (Table 11.1). Conceptually, the transition from one end of this spectrum to the other is gradual but inevitable: a typical unit might be expected to go from “like new ” to “serviceable but of concern” in perhaps five decades of normal use. As it does, aspects of its performance, its cost, and most important, the actions management should take with regard to owning and operating it, will change. When “as new’ it is rated to take full summer load and certain substantial overloads during emergencies; when fifty years old those ratings might be reduced or mitigated. When new it is inspected once a decade; at fifty years it is inspected every other year. When new it gets basic service once a decade; at fifty years it gets invasive inspection and fix-as-needed every five years.
Table 11.1 A Condition Code Set Used By One Utility
In many cases condition is measured by an asset health index or a score similar in nature to that shown in Table 11.2: perhaps on a scale of 0 – 4, or 5 to 1, or as A, B, C, D, F, or very good/good/sufficient/poor/very poor, etc. The scores are determined from inspection and test results, operating records, and so forth as will be discussed later. In other cases, equipment age (years in service) is used as the condition measure: a utility has determined statistically an equivalent age score that it assigns based on analysis and/or inspection data. This is most accurately referred to as equivalent age: a badly deteriorated 35-year old pole might be assigned an equivalent age of 60 years, as compared to nominal deterioration rates, etc. That means it is as deteriorated as the average 60 year old pole. A pole installed 60 years ago might be rated equivalent age of 35 years – it is an outlier among 60-year old poles as regards a lack of deterioration.
Conditions Have Consequences
Regardless of how condition score is tallied, the qualities most often sought in a condition measure are that it is simple and easy to use, and that it relates to:
Ability to do its job: to serve demand, support a certain weight under certain wind loadings, break a certain amount of currently within a certain time, etc.
Durability: the expectation that it can continue in its current role, or not, for a foreseeable time: remaining service life, expected failure rate, etc.
Actions required by the owner/operator: run at full rating, or reduce loading by 20%, or withdraw from service immediately. Inspect every three years or inspect annually. Service this unit immediately.
Conditions have consequences, either with regard to operating capabilities and restrictions, or actions needed to be taken (or not taken) for the equipment (Figure 11.1).
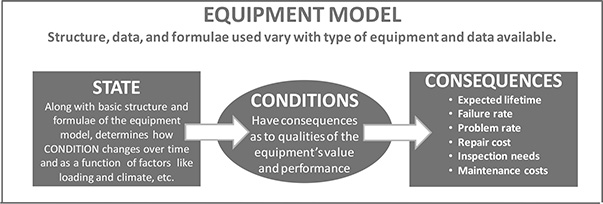
Figure 11.1 Relationship of state, conditions, and consequences and actions as it relates to the management of electric T&D assets.
Condition, State, and Priority
State is a technical description that is unambiguous in context. In theory, state refers to a set of data that comprehensively defines a system so that its response and behavior can be completely understood and predicted. From a practical standpoint, state usually involves several measures that are needed to understand and define the status of a unit unambiguously for modeling, analysis, and prediction.1 Often these state factors are component related: the “state” of a power transformer involves its core, bushings, oil, case, LTC mechanism, and cooling systems, etc. Failure or poor status of any one could lead to condition assessment of poor – needs attention now.
Condition assessment is ambiguous as to the details. State is not. A condition of “poor – needs attention now” might mean that oil readings are outside of permissible range, or that DGA readings indicate the core is deteriorated, or that the case is rusted and leaking, or that bushing diagnostics indicate a developing problem. Condition ratings are ambiguous in this situation, but the point is that these details are not needed to address the three managerial aspects listed above. By contrast, the state assessment or model will provide all those details: the core is like this, the oil like this, the case like this, and similarly for the bushings, LTC, cooling, and all other equipment associated with the unit. Even for a commodity unit such as a pole, state might give more details behind the “condition.” (This pole is located in an acidic soil area. This pole is in a high risk location.)
Condition is unambiguous as to actions needed; state might be too complicated to immediately determine that. But the value a simple condition score has is that it is unambiguous as to management action required – attention is needed now. Condition is the most succinct and unambiguous scoring possible that achieved that one quality, and that is all that should be expected of it. The first step in the attention the unit receives will almost certainly be for someone to gather up the state estimates and the data itself, and examine them in detail, but the condition score has done its job at that point. An important distinction is that modeling and prediction should always be based on state, not condition, as illustrated in Figure 11.2. Condition, by its nature, is not as useful for modeling and prediction as state. State, by its very nature, is not as useful a summary of management issues as condition.
1 Model, as used here, is not necessarily a computer program or even a numerical representation. It could be only the concept used to predict behavior: “My boss is a stickler for detail and abrupt in the morning, particularly on days when she has meeting with her boss. She is easier going in the afternoon, particularly when she is tired. She can be distracted from an unpleasant topic by bringing up the Duke women’s basketball team. . . .”
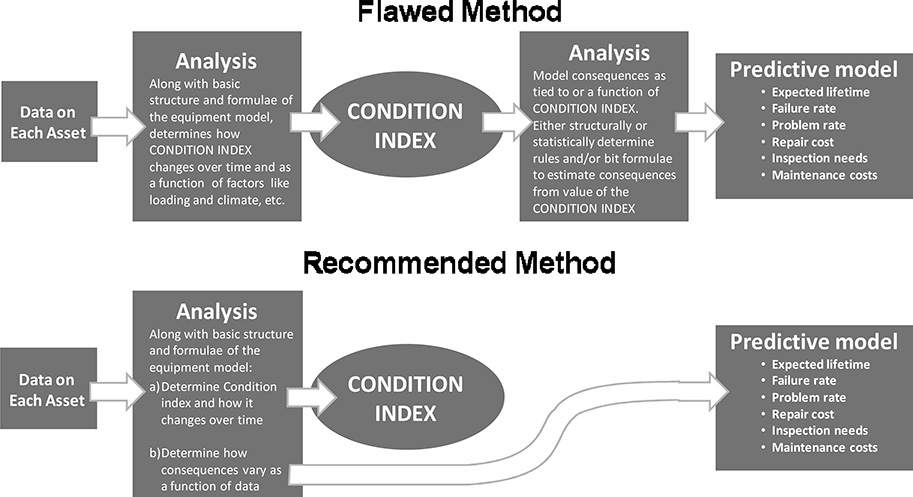
Figure 11.2 Methods that make predictions and analysis based only on condition tend to do much poorer as planning and management tools than models that use state representation. See text for details.
Priority is Used for Optimizing or Trying to Optimize of Results
Priority, or prioritization grade is a rating of importance with respect to spending and budget. Usually priority is based on both condition (often including details depending on state) and a unit’s importance (reliability, grid systems security or phooey customer service needs). Units that score highly in terms both condition needs and high importance are given priority over those that do not. Figure 11.3 shows a prioritization matrix as used by one utility. Prioritization will be discussed further in Section 11.10.
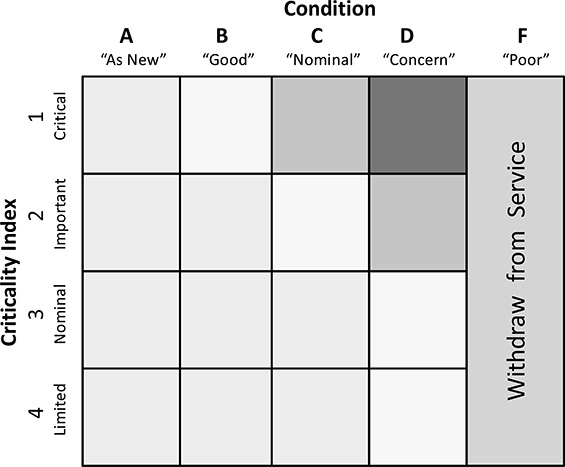
Figure 11.3 Prioritization is based on condition (or state) and importance (potential impact on reliability, system interconnected security, and operating results). This matrix summarizes one utility’s representation of the priority it gives to equipment based on both evaluations, and is used by it to communicate how it manages its assets. Equipment in poor condition is withdrawn from service regardless of criticality. Critical equipment that is of concern is given high priority of attention. A detailed numerical prioritization that also takes into account the cost of actions and the cost of consequences (good and bad) is actually used to make all final decisions on what to do and where to focus resources.
11.3 ANALYSIS, MODELING, AND PREDICTION
This book is not intended to focus on numerical or logical analysis and modeling methods or to present computer algorithms for such. Organizations and professionals doing asset management have or can gain the skills and knowledge in those areas that they need to properly apply them to aging infrastructure asset management. The bibliography at the end of this chapter provides several of the authors’ favorite references on those subjects. The discussion over the next few pages will present two views on how numerical and logical methods are applied to aging asset base analysis and modeling, in order to put the use of these methods in context and make several points the authors think important.
Figure 11.4 shows the flow of knowledge creation and application from raw data through to its final product, a model that is supporting asset management decision making.
Data include operating records, inspection, test, and diagnostic results, maintenance and service reports, load readings, failure reports, monitoring system records, etc. The vast majority for data in most asset management databases is numerical: measured and recorded as numbers in some range or unit scale, etc. Such data are analyzed and handled using numerical methods. A very small portion may be logical data: values that are binary -- yes/no or 1-0. These are handled using logical methods. Some data might be gradings: recorded as excellent-good-poor-bad, or high-medium-low-very low, or A, B, C, D, F, etc. These are best handled, at least if rigor and fully defensibility is important, using what are called grade logic methods – what was once called fuzzy logic.
Aging infrastructure analysis and asset management are data intense processes. There is (or should be) lots of raw data: equipment purchase and installation records, equipment outage and failure records, operating records, incident reports, test and inspection results, as-found and as-left maintenance reports, etc. Hopefully there are numerous sources. There is also hopefully not only data for recent years but data going back decades. Twenty years of data is more useful than ten, and forty is much more useful than twenty. In a few cases the authors have used data going back a century in their analysis of aging T&D infrastructures.
Less than perfect data is a major issue in nearly all asset management programs. Available data is seldom in “good shape.” Invariably, it has gaps where no data was recorded or retained, “patches” where someone filled in data gaps using a (now) unknown estimation method (but one that leaves obvious traces), inconsistencies (e.g., definitions or categories used in reporting were changed in 1994), incompatibilities (the purchase records list poles only by class, the maintenance records categorize them only by type of wood and preservation), or data was measured using a different method for 15 days while monitoring equipment was being repaired, before returning to normal type, and mysteries (there is an unusual jump in values starting 01/01/04).
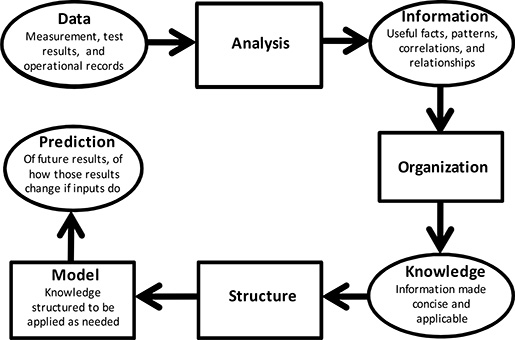
Figure 11.4 Analysis converts data into information. That is organized into knowledge. then used with structure in models that guide decision-making and management by predicting the consequences of future actions.
Beyond this, data often have significant quantification errors. For example, inspection forms might provide places to record surface rust as minor (less than 10%), quite noticeable (up to 33%), serious (up to 66%), or complete (100%). Where does 50% rust fit in this range? Different inspectors will use slightly different interpretations, even if trained as a group. Much of this will be discrete sampled data – values taken every so often – hourly, monthly, annually, which raises a host of issues relating to if and how some numerical methods are legitimate or not. Further, the discrete measurement may be truly discrete sampled data, or period integrated data, a distinction that can make a very large difference in their value for some applications and models.2
Analysis has two purposes from a practical standpoint. The first is to determine and “fix” data quality issues. The second is to find useful information within the data.
1) Data quality can be determined using various filters and diagnostic methods that detect errors or anomalies in the data. Problems can be “fixed” but exact knowledge of the repair mechanism needs to be retained. Gaps can be filled using pattern recognition and regression methods that provide a best estimate of missing values. Inconsistencies among definitions can be assessed and adjusted, and incompatibilities can be addressed. It is important to realize that if carried out correctly, these “repairs” do not add any real information, but merely make the data compatible with processes and models to be used later. For example, if three-quarters of quarterly DGA readings are missing from a particular transformer’s records, they can be filled into the records by a simple straight line trending the data from before and after.3 This puts numbers in the data set so that models using them will not “go ballistic” when they see completely unreasonable (zero) values. The data is fixed in a functional manner but not as to the lost information in those missing values.
2 Truly discrete measurements record the actual value of a factor at the moment it is measured- load at this instant is X, temperature is Y: integrated readings record the total or average for the period: total energy used was Z, total thermal loading was L.
2) Analysis extracts information from data. The data may be large streams of historical values. Analysis will find information: “Failure rate increases with age in this way . . . . Failure rate increases with the number of through faults within 20% of the design limit in this way . . . ” “OH lines that have had tree-trimming within the last two years have 40% fewer outages per mile annually.”
Information – patterns and relationships found in the data – is not necessarily always useful. Technically, information is just non-randomness in the data. From a practical standpoint, it is valuable only if applicable to the interests of the person or organization using it (asset management, in this case). Therefore, analysis is usually directed: the analysis does not seek to find all patterns and relationships in the data, but instead focuses on finding patterns and relationships that tie directly to managerial targets and factors under its control. Generally data analysis is directly at finding applicable information: relationships between data and factors used in or important to the asset planning and management process, so it is relevant to decisionmaking. For example, analysis of data for a utility’s asset management program would be directed at specific desired knowledge such as:
- Is maintenance effective? Can one see a reduction in failure and problem rates among equipment that has recently been serviced or treated, as compared to equipment that has not?
- What leads to failure? Determine if and how failure rate varies as a function of age, peak loading, climate area, and maintenance levels, etc.
3 A better estimator – one that minimizes expected error, generally can and should be developed using other data such as cumulative loading, temperature, too, but this example provides a simple illustration of the concept.
- Playing “data detective,” looking for useful clues or patterns. One of the most useful patterns the authors look for is transformers that have had case rust severe enough to require repair will rust at a noticeably higher rate when put in service, than those that have never been repaired.4
Information is identified, or extracted, from data through this analysis. creating information of many types. There are clusters in the data (“This group of 177 transformers are all quite alike with regard to their measurements, and somewhat different than any of the other 2,372 units”), patterns (“This type of unit has no significant operating problems due to rust for the five years immediately after surface rust is first detected”), and relationships (“Cable failure rate is equal to this polynomial function of time-in-service, peak line loading, and per unit bus operating voltage”).
Information found in this way, particularly through analysis directed at asset management application, is almost always potentially useful. But it is the conversion into knowledge that makes it applicable, and therefore useful.
Knowledge is information that has been organized and structured so it is useful and applicable. In Figure 11.4, the authors identify this with the term “Organization.”
Classification is the first part of organizing and transforming information into knowledge, grouping assets or situations into classes or categories, or labeling and putting patterns found into a framework. This involves much more than just obvious equipment classes (transformers, breakers, etc.) which actually are based on a priori knowledge (asset managers knew this before data analysis began). Here, cluster and pattern results lead to useful groupings or distinctions about assets:
We identified two groups of transformers by their relative measures: wet transformers have both high rust rates and water-in-oil contamination rates; dry transformers have neither. It is quite easy to distinguish members or either sub-class from the greater mass of power transformers, and within each sub-classes, formulae relating data to failure and problem rates and maintenance needs have much tighter standard deviations than for transformers overall.” Defining sub-classes around these cluster definitions leads to more useful application of the data.
4 The authors had seen this pattern at several utilities and across several classes of equipment, not just transformers. The pattern and accelerated rate of continued corrosion are not due to poor quality of repairs. New metal may be welded in, and the entire case sanded, primed, and re-painted, yet the unit will rust again sooner and at a higher rate than average. Investigation shows that units that develop rust are just more rust-prone and/or in an area or particular site where rust is more common. This will be discussed in more detail later.
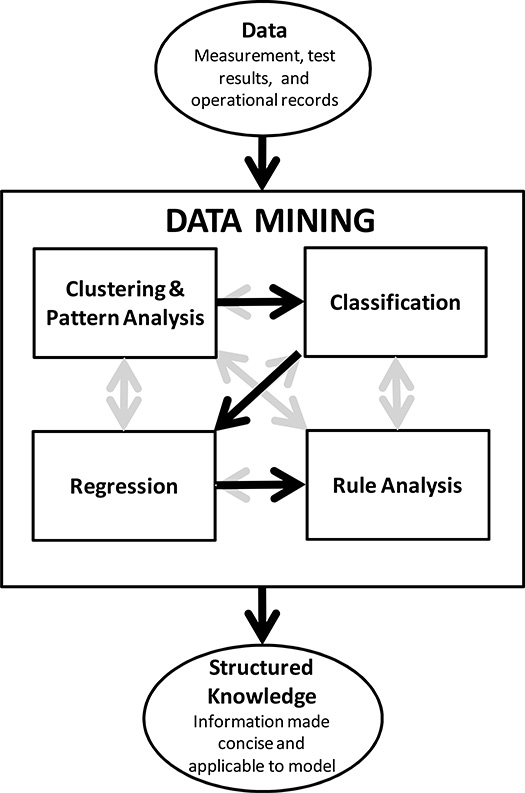
Figure 11.5 The four major aspects of data mining, which is applied with a formalized structure and guided by theory and rigorous method, includes many of the concepts discussed earlier for analysis and knowledge synthesis. A data mining approach often takes the perspective that information, knowledge and model structure are developed jointly and gradually throughout the process.
“Transformers less than 20 years old with HIGH rust problems HIGHLY LIKELY to have HIGH levels of water contamination of their oil.”
Rule-identification. The second aspect of the information-to-knowledge transformation is rule determination. Information is culled to identify if-then, this-implies-that or functional relationships that are useful in asset management, and put into a framework where it can be applied.
“Failure rates and problems for this equipment class respectively best fit the following two functions of the data . . . .”
“When surface rust is LOW and peak loading is NOT HIGH, the consequences of NO INSPECTION are LOW.”
“Condition of equipment in this class and category can change by 32% within six months, so we need to set up our inspection on a semi-annual basis.”
“This type of unit has no significant operating problems due to rust for the five years immediately after surface rust is first detected, so we will schedule inspections and testing only 60 months after the first report of surface rust.”
Classification and rule-identification organize the information so it can be effectively applied to asset management. It is now knowledge.
Models apply knowledge. As stated earlier, a model is not necessarily computerized: human beings aware of the patterns, correlations, and regression results found by data analysis can keep them in mind and apply them in their work. But computerized models apply knowledge consistently and completely (at least if well designed and written), and economically and (again if designed and written well) in a self-diagnosing and self documenting manner. Thus, the classifications, rules, and formulae found in the analysis and organization of the information are embodied into algorithms or logic used in a computer program, an unambiguous definition of the knowledge and its method for application.
One benefit of computer model building is it forces an organization to rigorously define the classes, rules, and methodology of its knowledge. Mental models can be and often are a bit exact or inconsistent in application from one situation to another. Computerization forces rigor and documentation of that throughout.
Prediction. From a practical standpoint, the purpose of models is prediction: they will be applied to anticipate future trends and problems, to study the consequences of plans, and to make decisions about resource and budget allocation, for the future. Models are not used for analysis of past or present data (analytical methods discussed early may be used on an ongoing purpose for this purpose).
Prediction here is used in its largest sense, meaning much more than just projections for future values for the current situation (“Failure rate for this asset class will increase 13% over the next decade”). Prediction includes forecasting how changes in controllable factors will change results (“Cutting inspection periods in two will result in identifying 52% of incipient problems before they cause outages”).
A Data Mining Perspective
A modern term for analysis and use of very large data sets and their conversion to useful knowledge is data mining. It can and is described in various references in slightly different ways, but regardless is always a process that takes data all the way to useable knowledge, usually in stages. Figure 11.5 shows the authors depiction of it based on several common web and technical references (Wikipedia among them). Four techniques are used to develop knowledge from data, usually in stages. These are similar overall to the analysis-to-knowledge path described above. .
Clustering is finds patterns or groups of assets that are similar to one another, etc.: “This set of transformers has operating and histories that are very similar and distinctly different than average.” “Failure rate of an OH service transformer is 20% higher in the three months after a lightning outage on the line within a quarter mile of its site.”
Classification seeks to identify groups and patterns and put them in context with regard to the framework needed: “We have two groups here: wet transformers have both high rust rates and water-in-oil contamination rates; dry transformers have neither. There are very few transformers not in one group or the other.”
Regression attempts to find a relationship between variables: “Annual failure rate is equal to this function of time in service, annual peak load, climate area code and manufacturer code.” Readers should note that this term does not mean just the classic multiple linear regression method of polynomial curve fitting of data (it is among the simpler and more direct of dozens of methods used): Regression includes all methods that seek to identify a functional relation among variables, and includes grade logic methods: “When all factors are GOOD, the problem rate for the next year will be LOW, MOST of the time.”
Rule Development uses patterns, classifications, and relationships found by clustering, classification, and regression to build applicable rules and guidelines. “Wet transformers over 15 years in service should be inspected for rust annually and the oil tested for contamination bi-annually.”
Data mining is not just a term but a professional practice area with established theory and rigorous methodology that, if followed correctly, generally guarantees good results, or at least freedom from the effects of many common mistakes and oversights that are often made in data analysis. An example of the methodology is relational normalization, which does not refer to numerical normalization (i.e., adjust all values to a scale of 0-100), but to methods that adjust the structure of the database and its rules to avoid duplication, inconsistent updates, conflict among different parts of the mode, and error, and logical completeness which assures that the resulting model covers the range of expected application fully, without gaps.
11.4 POWER TRANSFORMERS
Transformers are one of the basic building blocks of power systems. They alter the voltage-current constitution of alternating current power passing through them, essentially changing the economy of scale of transmission of the power from one side of the transformer to the other.5
Power transformers at distribution substations constitute a major category of distribution equipment. Generally, their capacity is summed throughout a system, or at a substation, in order to determine the capability of that system. This is only one of many indications that they are considered the key aspect of a distribution system. Regardless, large power transformers are a major concern to any electric utility when it comes to reliability evaluation, because each one feeds large numbers of customers and its replacement would involve a considerable amount of time and expense. Much of the contingency planning of power systems relates to concerns about transformer loading limits, and arrangements for contingency operation when one fails (see Chapters 8, 9, and 13).
Transformer Aging and Deterioration
Transformers “age” in the sense that the strengths of their components deteriorate as a function of chronological time, time in service and loading, and due to severe abnormal events like through-faults and switching surges. The amount of load served has a great deal to do with the rate of deterioration. Chapter 7 discusses in detail aging and loss of life with service time.
Many aspects of a transformer deteriorate with time: 1) the insulation level of its windings; 2) its oil and its bushings; 3) the mechanical strength of its core stack and internal bracing and electrical connections; 4) the desired chemical and physical properties of its materials (anti-oxidants in the oil, corrosion resistance of paints, flexibility of insulation, etc.). However, deterioration of the insulation (of both winding and the oil itself) is the major area of concern, and the predominant area evaluated, to determine a transformer’s “condition.”
There are several reasons for the focus on internal insulation strength. First, a core winding insulation failure will not only prevent the transformer from doing its job, but probably lead to a large fault causing very severe damage if not catastrophic failure. Bushing failures, corrosion, and other types of deterioration can lead to failure of the device, but rarely cause such high levels of damage.
5 See the Power Distribution Planning Reference Book, Chapter 7.
Secondly, many other defects, when found, can be repaired or replaced rather quickly and inexpensively. Bushings can be replaced, tap changers repaired, and most non-core/winding related equipment serviced while the unit is left in place but de-energized. However, the winding insulation is both the most difficult and the most expensive item to repair in a transformer. The unit must be withdrawn from service for a long period of time and returned to a factory or refurbishment center for what is essentially a complete rebuild.
The insulating oil in a transformer, if significantly degraded, can be reconditioned or replaced. This will improve the oil and have a positive effect on the condition of the winding cellulose insulation. But in some cases the winding insulation is sufficiently deteriorated so that replacing the oil alone will not necessarily make a satisfactory improvement in the transformer as a whole.
For all these reasons, the main focus of power transformer condition assessment is on insulation strength, the various tests focusing on direct (measures of dielectric strength) and indirect (measures of contaminates, dissolved gas analysis) means of determining the winding and oil insulation strength. However, other portions and aspects of the unit should be checked regularly and maintained as needed.
Acceptance Tests
New units are usually tested for insulation resistance, dielectric strength, turns ratio, amount of losses, and run through AC hi-pot and power factor tests. They may be subjected to load cycle (thermal tests). Acceptance tests are not a factor in condition assessment of older equipment and will not be discussed here.
Routine Transformer Inspection
Routine physical inspection of transformers includes : Examining the exterior of the unit for signs of leakage or corrosion of the case; examining radiator joints and grounding straps, etc., for cracked or dirty bushings, for damage (vandalism, weather), deterioration (paint chalking), and loosening of brackets or seals for attached sub-components (radiator fans, pressure sensors). It should also include testing the operation of ancillary devices such as oil pumps, fans, pressure relief valves, and the tap changer mechanism and its control system. This level of inspection should be done annually, if not on a more frequent basis.
Overall, inspection tends to focus on aspects of the transformer other than insulation strength and winding condition. Inspection may include viewing the unit through an infrared scanner to enhance detection of hot-spots caused by loose terminations of incoming lines, leakage current, or other similar developing flaws. Similarly, it can include enhanced “audible noise” analysis using a spectrum analyzer and pattern recognizer programmed to identify acoustic signatures indicative of trouble.
Routine inspection should include a thorough review of all operating records (temperature, pressure, load records) since the last routine inspection, with particular attention paid to abnormal events such as nearby lightning strikes, through faults, and storm damage.
Depending on the results of these inspections, follow up tests or diagnostics aimed at determining more precisely the condition and any necessary maintenance may be required.
Routine or Periodic Tests
Along with routine inspection, certain tests are done on a periodic basis. These tests have two uses:
1. “Good to go” evaluation. The tests determine if any measured values deviate from their permissible or recommended ranges. This indicates a need for further testing or for maintenance, and caution in using the device at high loadings. Values above a certain event lead to recommendations that the unit be withdrawn from service.
2. Condition monitoring. Periodic values are compared to identify long term trends – a particular value (e.g., dissolved methane in the oil) could still be below the maximum permitted – but significantly higher than its value in the last test, indicating a possible problem just beginning to develop.
Many of the most common periodic tests and diagnostics for a transformer focus on measuring some aspect of insulation strength, or look for the products or signs of insulation and/or oil deterioration. Table 11.2 lists the periodic inspections and tests that are done on power transformers. The frequency of tests shown are the authors’ impressions of typical industry practice (not necessarily recommended practice) with regard to units that are not thought to be high risk. Units that are suspected of having problems or a high potential for failure should be checked much more often – in extreme cases on a daily basis if not continuously (with real time monitoring).
Two guides useful sources of information on transformer tests and their use are Fifty Years – A Guide to Transformer Maintenance by Myers, Kelly and Parrish (1981), and Service Handbook for Power Transformers, by ABB’s Transformer Remanufacturing and Engineering Services Division (2006).
Four Categories of Risk/Recommended Power Transformer Evaluation
IEEE Standard C57-1004-1991classifies oil-filled power transformers into four categories or conditions of risk based on the results of dissolved combustible gases tests in their oil. Within each of the four categories, the standard then recommends specific inspection and test intervals that vary depending on the rate of change of the gas content as measured from interval to interval. It also contains recommendations for use of units and if and when they should be tested again and if they should be removed from service, based on the gas test results.
Table 11.2 Inspections, Tests, and Diagnostics Performed on Power Transformers
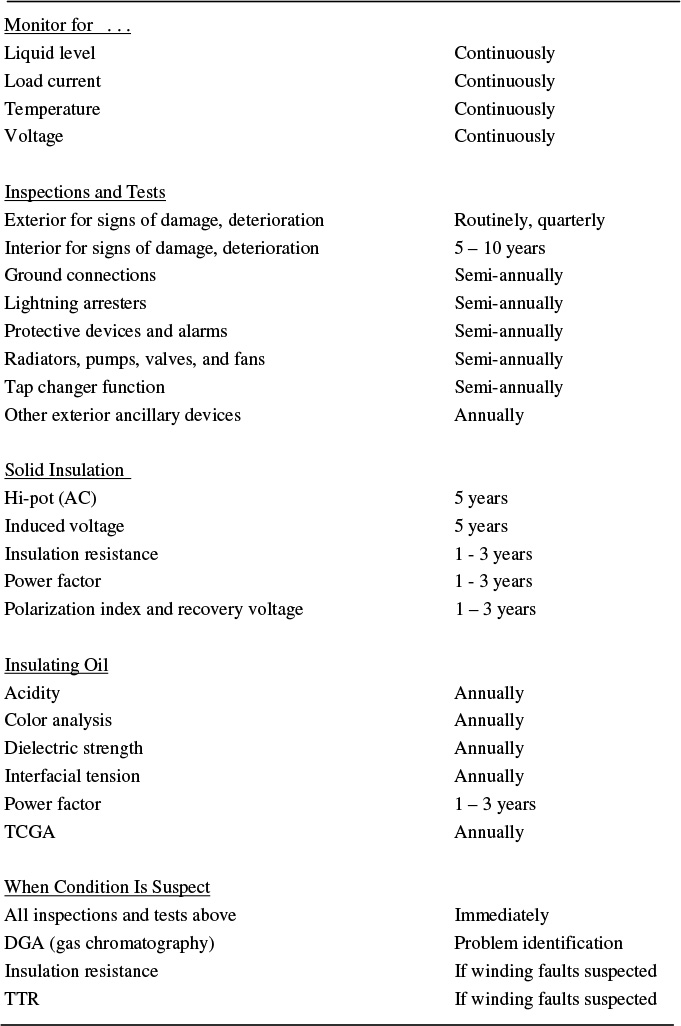
Table 11.3 IEEE Standard C57.104-1991 Power Transformer Risk Conditions
Condition |
Meaning |
1 |
Transformer is operating properly. |
2 |
Greater than normal gassing. Suspected higher deterioration rate. Additional monitoring and testing is warranted. |
3 |
High level of decomposition has almost certainly occurred. Internal faults are likely. Periodic gas analysis should be used to establish a trend. The unit may need to be scheduled for repair. |
4 |
Internal faults are very likely. Continued operation may result in failure. |
Table 11.4 Summary of Risk Categories and Recommended Actions Based on TCGA Tracking, from IEEE Standard C57.104-1991
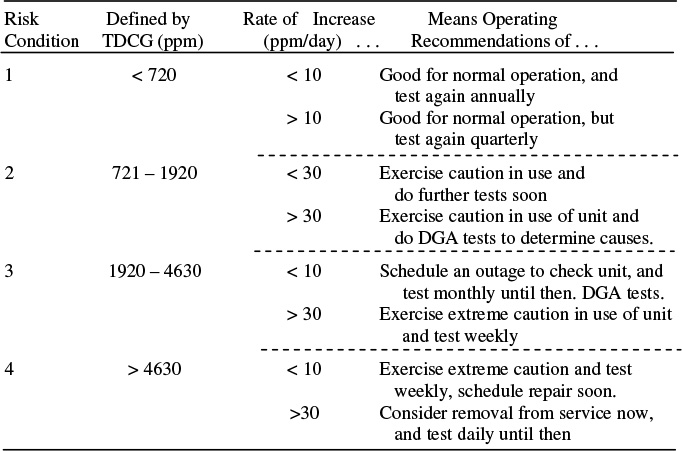
Table 11.5 Limits to Amounts of Individual Gases in Each Category
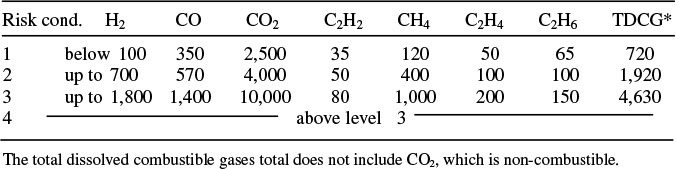
The total dissolved combustible gases total does not include CO2, which is non-combustible.
The full standard gives more detailed breakdowns of recommended testing frequency versus TDCG totals and increase rates than shown here. Table 11.3 summarizes the meaning of the four categories, which are defined by the totals shown in column two of Table 11.4. The table also shows how rate of increase data is interpreted in each of the four categories. Table 11.5 gives the concentrations of various gases (which must be determined by DGA) that are considered tolerable within each category.
Thermal Load Tests
The electrical losses created inside a transformer produce heat, which leads to elevated temperatures unless the heat is moved away from the core with some means of cooling. If the unit has internal problems that create higher than expected amounts of heat, the unit might operate at temperatures noticeably higher than it should for a given load. Sources of excess heat include short circuits, severe sludging problems, damaged radiators or damaged pumps. This could shorten lifetime significantly and bring about premature failure.
Units can be “laboratory tested” to determine their temperature versus load characteristic by running test currents of known amounts through them for known periods of time, while measuring their internal temperature rise. However, such tests are expensive (the unit has to be de-energized, taken to the lab, and left there for a considerable period).
Nearly the same accuracy in determining thermal behavior of a transformer can be carried out in the field. This is done by monitoring load, ambient temperature, and temperature inside the unit on a periodic basis (every 15 minutes) and then calculating the thermal time constant and the maximum rise expected at full load from the resulting data (Figure 11.6). The actual computation is straightforward, although it is generally best to gather much more data than theoretically sufficient – several weeks of readings. Use of an analytical method based on signal processing, rather than time-series analysis methods, is also recommended.
This computed “thermal response” signature of the transformer will reveal whether the unit is performing up to its design specifications or if thermal capability is degraded for some reason. Typically, such field tests will not indicate the cause of the problem, only that a problem exists. For example, Figure 11.6 gives no indication whether the deviation from expected performance is due to a degradation in cooling capability (due perhaps to sludge buildup or blocked cooling ducts), or to creation of greater amounts of heat inside the unit due to a defect such as an internal fault.
The causes of thermal problems have to be traced through other inspections and tests, some of which will be prescribed based on the initial, basic test results (see the aforementioned books). These begin with an inspection and test of the entire cooling system – pumps, fans, radiators. If these are fine, then tests for sludging, such as acidity and interfacial tension tests of the transformer oil, are recommended.
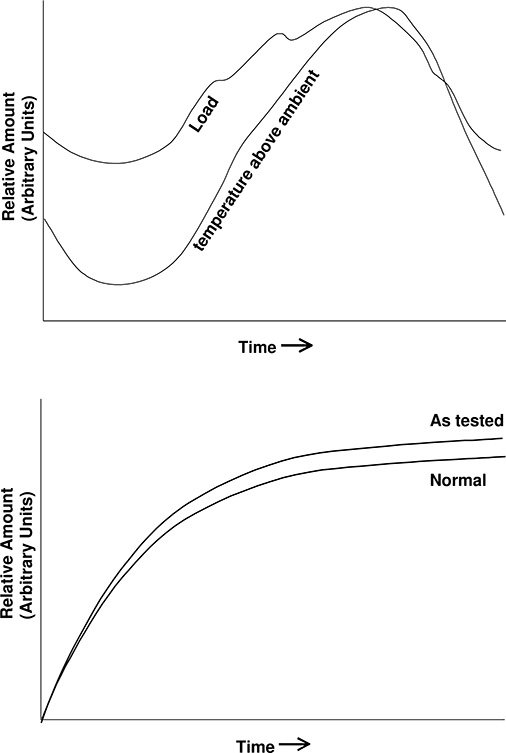
Figure 11.6 A thermal load “test” of a power transformer. Top, electrical load and temperature rise above ambient are monitored over a 24-hour or longer period. Bottom, de-convolution of the two time-series produces a calculated impulse response function (temperature rise and time for an arbitrarily short pulse of loading) for the unit. This can then be used to compute the step response shown, which is the rate of rise and final temperature that would result from having the unit serve a load equal to its rating on a continuous basis. This example reveals an as-tested signature that both have a higher rise time and asymptote (high eventual temperature), indicating some type of internal problem.
11.5 SWITCHGEAR AND CIRCUIT BREAKERS
Circuit Breakers
Circuit breakers are electromechanical devices. They are tested in both mechanical and electrical performance and for signs of deterioration.
Routine inspection
Physical inspection aims to identify signs of past, present, or forthcoming problems, and is carried out routinely (every quarter or semi-annually). The unit is visibly checked to identify any noticeable corrosion, deterioration or damage, or outward signs of internal malfunction (leaking oil around seals). Physical inspection of the device usually includes visual or infrared examination of the exterior of the unit while in service. Inspection of internal parts of a circuit breaker (condition of contacts, etc.) is a big part of that maintenance, but not normally considered part of “inspection” because it is done only after de-energization and disassembly.
Records should be kept on routine inspections, so that gradually deteriorating paint, corrosion problems on a particular unit, etc., and other similar problems can be tracked over time.
Temperature rise test
This can be viewed as a form of inspection and must be done while the unit is in service. The temperature of the breaker is measured accurately and correlated with load. Significant rises in temperature can identify internal electrical problems. Use of an infrared scanner can aid in this test, particularly for determining where in the unit the additional heat is coming from.
Electrical tests
All electrical tests done on breakers require de-energization, but can be carried out in the field if recommended safety precautions are taken and if instructions for the test are followed properly. If they reveal problems, the unit will have to be disassembled and visually checked, or its components tested, to determine the problem and its fix.
Standard electrical tests are performed on circuit breakers. An insulation resistance test applied twice, once with the contacts open and once with them closed. An AC high potential test (or a DC version if AC equipment is not available) can be performed, but generally to only 75% of factory test voltage, so that it does not unduly stress the unit. Manufacturers’ recommended procedures for such tests differ substantially depending on the type of unit. Power factor tests may be done - they are usually done on air circuit breakers.
Contact resistance tests are the only special type of electrical test for circuit breakers, in the sense that these tests are not done on other types of electrical devices like transformers. This is simply a measurement of the resistance from terminal to terminal across each phase, made with the breaker closed, and is a way of inferring the condition of the breaker contacts without disassembly of the unit. A standard ohmmeter is not used. Instead, a current source (typically about 100 A) is used in order to put some magnitude of current close to normal operating levels through the breaker to simulate actual load. Expected values for medium voltage breakers are in the range 100 – 250 mW, but each manufacturer provides specific target data for each type of unit that it manufacturers. Signs of possible deterioration from this test include either a higher resistance than expected or significant deviations in the measured resistance from one phase to another.
Time and travel tests
Mechanical tests of the circuit breaker are called time-travel analysis. They are carried out with the unit de-energized, but are done on site (in the field). These are tests of the breaker mechanism to determine if it is opening quickly enough, or binding in some part of its analysis or otherwise not performing as expected. Modern test procedures use electronic time-travel analyzers rather than the older style mechanical devices, which were used for testing into the late 1980s. These new test units provide not only an accurate reading of opening and closing times for the unit, but also detailed analysis of mechanical performance. They provide plots of opening and closed speed during each phase of the cycle, and numerical tables that identify quantitatively the breaker’s performance in each of several categories. Time-travel tests of a breaker include:
1. The opening and closing time
2. Contact speed and gap distance as a function of time during the cycle
3. Contact bounce
4. Trip operation
5. Time to re-charge or re-energize the trip mechanism
Tests of ancillary and associated equipment
Tests of breakers should include, either as part of the breaker inspection and testing, or as a separate program, inspection, testing, and appropriate diagnosis of the rest of the protection system that includes the breaker. Instrument transformers, protective relays, panels, and wiring should all be routinely checked for signs of deterioration and to see that they function properly.
• Instrument transformers in service are tested periodically to determine that their breakdown voltage remains sufficiently high, and for ratio and phase angle performance. Other than that, they are “left alone.” However, if de-energized for any lengthy period (as when the surrounding equipment goes through a long period of maintenance), and particularly if left outdoors, they should be removed and dried.
• Protective relays controlling the units need to be tested to determine that their entire system is functioning correctly. Testing of relays involves methods often tailored specifically to each type of relay. However, a highly recommended general procedure is to record the condition and settings of the relay system in “as found” condition at the start of each inspection/test. Many of the problems with relaying are not due to deterioration or degradation of units, but mistakes in setup, calibration, or installation. Some of these can be systematic (due to training errors or poor habits of personnel) which will be found only if accurate tracking of problems of this nature is maintained.
• Wiring and panel equipment, including any recorders and indicators, should be checked and assured to be in operating condition. Indicators and records should be checked periodically (e.g. every 5 years) for accuracy, and re-calibrated if need be.
• A complete system test (of the relay-breaker combination) should be performed at the end of the inspection/testing. The fact that all of the equipment is individually in good condition does not absolutely assure that it will function as a whole. A final test of the complete system is the only sure way to verify this.
Switchgear
Switchgear other than breakers is generally tested and inspected on the same periodic basis as breakers. Switches and other mechanical devices should be routinely (semi-annually or annually) operated. Unlike the situation with breakers, in many cases visual inspection of contacts and mechanisms is possible with much of this equipment.
• Routine electrical tests include only the insulation resistance tests. They are relatively easy and quick to apply in the field and put no particularly high stress on the equipment. If they indicate problems other tests might be called for. These include hi-potential tests and power factor tests.
• Radio interference is a very good way to identify problems due to dirty or cracked bushings, post insulators, and corrosion-caused weaknesses in connections. As mentioned earlier, a small AM radio can detect the interference given off by some types of electrical problems.
A detailed discussion of breaker and switchgear inspection and testing procedures, including comprehensive lists of recommended procedures on a step-by-step basis and a method for a detailed RIV (radio interference voltage) test of substations is included in Electrical Power Equipment Maintenance and Testing, Chapters 7 and 8 (Gill, 1998).
11.6 UNDERGROUND EQUIPMENT AND CABLES
Underground cables
Underground cable is available in a wide variety of types, including three-phase, single phase, either carrying or not carrying a concentric neutral, and with various types and degrees of “armor” or protective sheathes. Cables are made from a diverse range of materials, including copper, aluminum, and alloys for the conductor. Insulation and construction may be composed of any large set of materials with somewhat differing properties, and different construction methods, including paper, cotton derivatives (varnished cambric), natural or synthetic rubbers, and other materials. Cables also vary in the type or material and construction of their outer sheath.
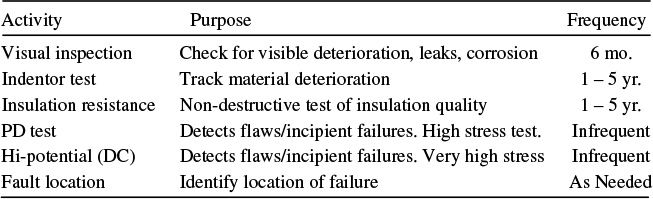
With all of these types of materials and construction, there is no one type of inspection or testing program that is applicable to all types of cable. Each manufacturer provides information or recommendations. Table 11.6 lists general categories of inspection and testing and the typical periods of their application.
Acceptance tests
Acceptance tests are usually performed on cable when received from the manufacturer. This includes insulation resistance measurement and DC high potential tests. Acceptance tests often include a series of destructive tests on samples of the cable, carried out in a laboratory, to verify its withstand capabilities.
Routine inspection
It is impossible to visually inspect the vast majority of installed underground cable simply because it is underground and inaccessible, inside ducts or directly buried. Despite this, routine annual inspection should be carried out on those portions (the ends of cable sections) that can be inspected, and on all associated terminations and ancillary equipment. This last group of equipment is particularly important, because a good deal of cable problems occurs at terminations and are due to failures or deterioration of equipment other than the cable itself.
Table 11.6 Cable Inspection and Testing
Inspection involves passive evaluation of condition based on visual (including infrared) examination of cable section ends, termination, conduit, and other equipment. Corrosion and deterioration of ground connections can be a particularly important factor for cables and deserves special attention. Cables should be checked for oil leaks and swelling of insulation. Oil circulation systems for oil-filled cables should be checked fully, including full evaluation of the condition and capability of the pumps.
Inspection may include a type of thermal analysis based on comparison of “temperature as measured” versus “temperature expected” using data obtained from monitoring of load and temperature at points on the cable. This is similar in concept to that shown earlier for transformers (Figure 11.6). However, it cannot be done quite as accurately as with transformers because the thermal factors for cables are not known quite as accurately as they are for transformers. Factors such as the thermal transfer capability deep inside the duct, etc., can only be estimated. Therefore these types of tests are useful only for tracking over time so that deterioration – deviations from a previously verified “good” performance level can an be identified.
Condition evaluation of installed cable
Underground cable failures are one of the most vexing trouble areas for modern electric utilities. Cables cannot be inspected visually; deterioration rates can be exacerbated by many factors not visible because the equipment is buried. Repair times are lengthy, and often very costly. Many types of cable have very long service lifetimes (e.g., paper insulated, lead covered), but some types of extruded cable, particularly bad batches of it, gained reputations for lifetimes far shorter than needed (i.e., less than 20 years).
Therefore, indirect means of testing cable to determine the condition or state of deterioration of its insulation and hidden or difficult-to-access splices, is a significant part of a utility system reliability improvement program. Electrical tests require de-energizing the cable, but can be done in place. The most frequently performed tests that can be carried out include:
1. Insulation resistance tests as described in Section 9.3 are electrical tests that can be done routinely on cable. They are relatively quick and inexpensive and cause no undue stress on the cable, so frequent testing will not degrade cable quality. Since the measured resistance of a good cable will depend on its length, which is different for nearly every section, these tests are useful only if they are done on a periodic basis (including ideally, when initially installed) with good records kept, so that results can be plotted over time. Unfortunately, small flaws or early signs of deterioration may not show up on a resistance test. Therefore a partial discharge or DC hi-potential test may be required.
2. Partial discharge (PD) tests, discussed in Chapter 6, are available from a variety of commercial suppliers of PD test equipment and services. Interpretation of the results of PD test is still something of a “black art,” but a number of very clever means of analyzing timing and spatial pattern of results have been developed to infer a tremendous amount about cable condition. A particularly good discussion of partial discharge methods including diagrams of different types of partial discharge display patterns and their interpretation, is included in Electrical Insulation in Power Systems (Malik et al. 1998).
3. Indentor tests, while not strictly an electrical test (they are a type of mechanical procedure) can be done while the cable is de-energized and being otherwise tested for electrical properties. These tests involve pushing a small indentor against the insulation of the cable and measuring the material’s resistance to its penetration. Material will harden during service, so that this test provides a quantitative measure of material deterioration.
4. High potential tests can be done to stress test the cable and reveal any developing flaws. As mentioned in Chapter 6, hi-pot tests of UG cable usually use a DC rather than AC voltage approach, to avoid capacitance problems that might occur with AC hi-pot tests. As also discussed in Chapter 6, these tests are well-known for the high level of stress they can put on cable, which can worsen existing weaknesses to the point that the cable fails much sooner than it otherwise would. Therefore, these tests are usually done on a non-routine basis.
5. Destructive or forensic laboratory testing is often carried out on samples of cable taken out of service. While this type of examination is frequently done only on the “good portion” of failed cable sections removed after a fault, it is often performed as part of a random sampling process for UG cable. Portions of cable are destructively tested (to the point of insulation failure) in controlled laboratory conditions. Other portions are sliced and analyzed under a microscope for evidence of treeing or other deterioration in the insulation.
Fault Location
When an underground cable fails due to a fault or open circuit, various test procedures can be used to try to locate the fault. The traditional method is a manual sectionalization to isolate the fault, section by section, which is tedious and time consuming, and often abuses equipment.6 Other methods include the radar method and arc-reflection method (two forms of time reflectometry) and a resonance method in which electrical signals or pulses are tracked down the cable, pulse return timing or resonant frequency indicating distance to the fault. Several methods inject a signal or pulse that excites some type of electromagnetic signal from the fault location, which can then be found using a portable location (this only works if it is possible to walk above the cable route).
Fault location is not part of “condition assessment” of cable operating in normal fashion, and will not be discussed further here. A very comprehensive discussion is included in Malik et al.(1998).
Repair and replacement
Flaws and problems found by routine inspection can generally be repaired: such things as corroded casings, poor grounds, leaking seals, non operative cathodic protection, and oil pumps not up to specification can and should be repaired immediately. Similarly, poor terminations or equipment at terminal sites that is judged to be bad can be repaired or replaced.
If and when a cable fails, the fault can be repaired with a splice, but it is often advisable to replace the entire section if post-fault analysis indicates the cable had a severe amount of deterioration. Splices have a failure rate higher than equivalent lengths of un-spliced cable. They represent a potential weak-spot in the already weak system (the remaining cable is aged and potentially at risk of failure itself).
But when PD or hi-pot tests indicate that a cable section insulation level is poor, it must be replaced. There is no repair for badly deteriorated cable.
11.7 OVERHEAD LINES AND ASSOCIATED EQUIPMENT
Damage, Not Deterioration, Is Often the Major Concern
A majority of power distribution in most utility systems consists of overhead primary (MV) and overhead service, or secondary (LV) lines and equipment. The basic materials for overhead lines include poles, conductor, insulators, and their associated hardware, all of which are incredibly robust equipment. Their expected lifetimes in normal service are 50 years or greater. While deterioration is a concern, the very slow rate of change under most conditions and the very great times to failure for this equipment generally mean that routine monitoring to track the rate of deterioration is not an effective or justifiable O&M procedure.
6 An expedient for finding faults in URD systems at many utilities involves “opening and closing” URD primary sections by pulling elbow connectors with a hot-stick. This is not recommended and most elbow connectors are not designed or rated for such duty. The stress put on the elbows is unknown and cumulatively could lead to early failure.
This is not to say that condition assessment is not an issue in overhead distribution. Far from that, assessment and tracking of condition should be a high priority in many distribution systems throughout the United States, particularly in those where large portions of the system exceed 50 years of age, an age where deterioration of wood, metal, and bell insulators may have reached a point of concern. Condition assessment of overhead equipment in these areas is a critical part of good reliability management.
But one definite fact that colors all approaches to inspection and maintenance of overhead lines is that by its very nature, overhead equipment is quite exposed both to the elements and to external sources of damage such as errant automobile traffic, nearby vegetation and fires, etc. A majority of overhead outages occur due to damage, not deterioration, whether that damage is from severe weather, contact with trees, automobiles and construction accidents, forest and building fires, and vandalism. For these reasons, identification of damage, not deterioration, is a large part of inspection and testing for overhead lines.
Inspection of Overhead Lines
Generally, elements of the primary and service voltage systems are not tested with electrical tests like insulation resistance, power factor, hi-potential etc., as are substation equipment and UG cable systems. This is not to say that they could not be, and that such tests have not been done on a special or experimental basis. Such tests aim to identify deterioration of insulation, and as mentioned above, deterioration is typically not a big concern on overhead lines; damage from external causes is. But while such tests could perhaps identify some types of damage, visual inspection of overhead lines can reveal a great deal more. Visual inspection, done to a high standard and organized with good record keeping will identify damage and in fact can detect signs of deterioration in many elements of the system. Typically, the best procedures utilize written classification criteria (“Less than ten square inches of visible rust per side” “Scaling rust flaking off”). Such routine inspection might be augmented using infrared imaging to identify hot equipment and fittings, and/or the use of developing acoustic/radio frequency detection devices that find traces of leakage currents, etc.
Therefore, inspection is the chief means of determining overhead system condition. The only electrical test routinely done on overhead distribution involves checking the grounding of poles and neutrals in grounded and multi-grounded Y-connected distribution systems.
Poles and Pole Assemblies
Poles are made of natural wood (treated, straight tree trunks), laminates of wood, composite wood (wood epoxy mixes), concrete, fiberglass, or steel. Concrete, fiberglass, and steel poles have very long lifetimes, if their materials are properly manufactured (cured, etc.).
The vast majority of power distribution poles in use are wood. Wood poles have an expected lifetime of from 35 to 85 years, depending on the type of wood, chemical preservative and treatment method, installation, soil and climate conditions, and periodic inspection and treatment given them. Cross-arms have a similar lifetime. Deterioration takes two forms: 1) a general weakening of mechanical strength of the entire pole, due to aging, cracking, etc., and 2) rotting of the pole near ground level due to trapped moisture. They are also subject to damage from automobile accidents, trees falling, fire and all manner of unusual situations (a property owner nearby may use the pole as one corner of a garage or barn being built, etc.). Deterioration, like damage, tends to be very pole-specific. One pole can be near failure due to deterioration; those nearby might have a considerable lifetime left.
Visual inspection is notoriously unreliable in determining the state of deterioration of a wood, although it is very good at identifying damage to poles and their assemblies. Testing for mechanical strength and rotting takes several forms. The simplest, but least exact, is the hammer test. The pole is struck with a large hammer near ground level. The resulting “thump” has a very different sound depending on whether the pole is sound or rotted. This test is very quick (many poles can be checked per person-hour and inexpensive (the equipment, a standard small sledge, costs very little). However it is not particularly quantitative. It tends to identify poles with severe stages of deterioration, but does not measure interim levels of deterioration. In addition, dependability of results has a good deal to do with the skill of the person doing the test.
A type of sonogram approach uses a device that sonically scans a cross-section of the pole (usually near ground level) to determine its density and detect any voids within. The sonogram device is reasonably portable (about the size of a small rug vacuum cleaner) and is taken from pole to pole. This test is more expensive than the hammer test, and requires more operator skill, and a good deal more time for each pole than the hammer test, but it is much more accurate in determining condition on a pole. Coring to obtain a sample of interior wood for analysis is also often used.
A type of indention-mechanical/electric resistance test can also be used. A portable device about the size of a small suitcase is attached to the pole near ground level, using a web belt to tighten it to the pole. The device then pushes two thin electrical probes into the pole, measuring the mechanical resistance to their insertion, one measure of the condition of the pole. The electrical resistance through the pole is then measured with the probes, using an ammeter. The combined mechanical-electrical values can be correlated with the pole’s mechanical strength (different tables are needed for each type of wood, e.g., fir).
Deteriorated poles can be repaired by injection of strengthening and/or drying materials into them near the base or by reinforcement with sheathes or stub-poles. The most effective long-term approach however, is replacement.
Inspection of Cross-arms, Insulators, Conductors and Hardware
Overhead line equipment includes cross-arms, mostly wooden, which can deteriorate much like poles can, insulators and attachment hardware, and conductor and associated hardware like splices and vibration dampers.
• Careful visual inspection of a distribution line, often called “driving the line,” can identify damage of cross-arms, hardware, conductor, and deterioration if it has reached advanced stages (near failure). One factor in favor of such inspection is that it is inexpensive, requiring no special equipment. However, it fails to find some incipient problems (in fact, a majority may go undetected), and it is not easy to carry out on sub-transmission or distribution lines that do not parallel roads or highways.
• Radio interference tests. As mentioned at the beginning of this chapter, a simple and inexpensive enhancement to visual inspection of electrical equipment exposed to the elements is radio interference monitoring. Routine policy at several utilities is to leave a radio on the AM band but not tuned to any station while driving line routes for visual inspection of equipment. Cracked insulators, corroded brackets, and broken conductor strands create low levels of radio interference, so a sudden increase in radio “static” and noise is a sign of a nearby problem. Generally, inexpensive analog radios work best for this purpose: expensive stereo systems and digital radios have filters and signal enhancement circuits that eliminate all or most static and interference.
• Infrared scanning. Two improvements in overhead line inspection are infrared scanning and inspection by helicopter, often combined into a much more effective and rapid means of inspection lines. Infrared scanners are essentially infrared video camera-recorders that display on a CRT an image of equipment as seen in the thermal infrared band. Intensity of items in the image is proportional to temperature, so brackets, splices, or conductor sections that are overheating for whatever reason show up clearly.
• Inspection by helicopter provides several advantages. First, a number of important deterioration modes are visible from the air better than from the ground. Cross-arms crack and rot from above where standing water tends to collect after rains. They may look fine from below but can have signs of serious deterioration if viewed from the air. Loose attachments of conductor to insulators are easier to see when the insulator does not block view of the tie point, as it does if viewed from the ground.
Second, in all but very heavily congested urban areas, a helicopter can “fly” line routes while staying close enough to visually inspect in detail. Often, it is possible to approach closely enough that service-level equipment and lines can also be checked.
Third, the helicopter can cover much more line per hour than inspection by foot or automobile. Helicopter surveys often use a video recorder in both visual and infrared bands to record the inspection for later review in detail as needed.
Replacement and Repair of Basic Line Equipment
Damage to or deficiencies in basic overhead line equipment found by inspection can be repaired on an as-identified basis by replacement of the failed or failing components. Little of this equipment is “repairable” in the sense that it can be taken down, reworked or refurbished, and put back up. Instead, replacement with new is the only alternative. The exception is conductor. Birdcaged conductor, broken strands, and similar damage can be repaired by replacement (splicing) of only the damaged part of the conductor.
One recommended exception is annealing. Experience has shown that failures or severe deterioration due to annealing at one part of an overhead line will generally indicate severe deterioration in other parts nearby. Ideally, if a conductor falls down or other problems from annealing are suspected, the entire segment should be replaced or carefully inspected at close range (from a bucket truck) for signs of annealing.
Switches and Cutouts
A portion of manually operating switches in many electric distribution systems are suspect simply because they have not been operated in years. Over time, switches will become inoperable for a number of reasons. Even a minor amount of corrosion on the contacts of closed switches, or in the operating mechanism of open or closed switches, will freeze the switch so it cannot be operated. Water working its way into mechanisms can freeze, warping rotating surfaces and jamming devices. Closing a switch into a current higher than its rating can “weld” its contacts closed, so it will not open next time an attempt is made to operate it. Overloading can reduce the temper in the switch springs, causing it to malfunction. In addition, connections sometimes just weaken or loosen.
Cutouts and fuse connections also suffer from the same types of problems as line switches. However, they are almost never test-operated. There is some likelihood that each will go bad, but given their number, the difficulty in reaching them, and that fact that any quick test would assuredly cause a customer interruption,7 few utilities test anything but a handful of cutouts, and only at special sites, each year.
7 To test without an outage a jumper has to be placed in parallel with the cutout prior to the test, then removed afterward. While certainly within the capabilities of any well-trained line crews, this increases the time, and hence the cost, of such tests.
Infrared scanning of both switches and cutouts can reveal a large portion of mechanical and electrical problems. Loose and corroded connections or a partially broken conductor near them shows up as a hot spot. The corrosion that causes frozen contacts often creates higher impedance in the switch contacts, creating a hot spot at the top of the blades.
Fuses
Fuses can be damaged by overheat, nearby lightning strikes, or long periods of high loads. However such problems are very rare, and fuses have very long lifetimes in service, assuming no fault occurs that requires them to blow.
One of the problems with fusing experienced to varying degrees by some utilities is a mismatch between designed and actual protection size of fuses on overhead lines. Mismatches occur because of mistakes made by line crews, expediency (a trouble-man has no 30 amp fuses so installs a 40 amp), and “coppered out” fuses.
The last problem arises due to either laziness on the part of line crews (rare) or to good intentions, overwork, and poor coordination of line repair records (more common than is appreciated). After long outages, particularly in very cold or very hot weather, “cold load pickup” can be a nuisance when restoring service. Starting current and loss of diversity due to the lengthy outage may mean that the “cold loads” are up to three times higher than normal. As a result, on primary feeders with tight fuse coordination, the initial load seen on a branch or lateral that is closed into service after a long outage may exceed the specified fuse rating. The fuse links keep blowing when the line crews try to close the cutouts to put the customers back into service.
The proper way to “fix” this problem is to jumper around the fuse for a period of thirty minutes to one hour, until load diversity returns. However, one expedient solution frequently used by line crews working against a tight deadline (common during storms) is to replace the fuse link with something that will not blow. This might simply be a larger fuse link than specified, but even a larger fuse size (i.e., a 40 amp instead of a 30 amp) may not provide enough capacity for the initial cold load surge. However, a length of #6 solid copper, or a large strand of aluminum from AA conductor, will fit in a fuse barrel, and “cures the problem.” Usually, the intent of the line crews is to return after one or two hours and change the fuse link back to the proper fuse. But due to difficult schedules and forgetfulness, a noticeable portion of such coppered-out fuses probably remain in service. Accumulated over many years, it can be a noticeable problem – engineering records and visual inspection show that fusing is installed on the system, but protection doesn’t work properly.
It is impossible without pulling the fuse element to verify the size of fuse actually installed in a fuse barrel. The “solution” to this inspection problem is a detailed assessment of trouble reports from the field. Statistical analysis of outages in which protection coordination is suspected of not functioning properly can reveal the degree of the problem – the “advanced TLM” discussed in Chapter 15 is somewhat successful at this. However, nothing short of site by site inspection, will identify all problems.
Regulators, Capacitor Banks, Reclosers, and Sectionalizers
These types of power system equipment are considerably more complicated than basic line equipment, and should be inspected, tested, and maintained in a manner similar to the transformers, tap changers, breakers and station capacitor banks it resembles. Routine inspection of this equipment, including visual and infrared inspection from the ground or helicopter, is typically included with inspection of the entire line.
Unlike the case with the basic overhead line equipment, electrical tests are typically applied to this equipment. Line regulators are tested in the same manner as small medium-voltage transformers/tap changers. Reclosers and sectionalizers fall into a category similar to breakers and relay sets. All of this equipment is routinely tested on something like a 2-5 year cycle for proper operation, and usually with instrumentation to assure proper turns ratios or operating speed and synchronization, as the case may be. Insulation resistance is also measured as a routine course. Reclosers and sectionalizers will have specific inspection, test, and maintenance procedures recommended by their manufacturers.
Shunt and series capacitor banks have unique characteristics (high capacitance) which require special test procedures, generally involving DC potential testing and induced potential tests. Capacitor switches in some systems are particularly failure prone and are tested annually, generally just prior to peak period.
11.8 SERVICE TRANSFORMERS AND SERVICE CIRCUITS
Because they are so numerous and there is no contingency backup for each one, service transformers can be an issue in the reliability of any system. In most cases, restoration of service can be achieved only by replacement since no re-switching option exists. Service transformers and service-level circuits are predominantly “fit it and forget it” devices. At most utilities, they are not inspected, except as part of general inspection of overhead lines. This inspection does catch a good number of problematic service transformers and weak connections of service-level wiring. Many utilities also depend on meter readers and other personnel in the field to “keep their eyes open” for problems. But despite this, deterioration and damage can go undetected. Fortunately, service transformers and low-voltage circuits, whether overhead or underground, are very robust, so lifetimes even in this light-inspection environment are quite good (see Chapter 7).
One very effective “inspection” method for service transformers is a transformer load management (TLM) program. “Program” here means both a computer program and all the procedures and internal organization required collecting the data and using the information produced to manage the service transformer asset base. TLM involves gathering customer-billing data on a monthly or quarterly basis. This is input into the TLM program, and correlated with transformers (a TLM requires data telling it which customers be served through which transformers). The TLM program then estimates the peak load and peak duration, and hence the total stress on the unit, for each service transformer. Its estimate is based on the number and type of customers and the total kWh sold through each transformer during the analysis period.
The TLM does this calculation for all service transformers in the system. It then produces a sorted list of units for which the calculated stress is higher than recommended – a so called “jeopardy list.” This is sent to the field so that each unit can be checked by line crews (leads can be amped to determine true loading level, the unit can be visually checked for signs of leakage caused by overheating, etc.). Overloaded units are replaced with larger capacity transformers.
A good TLM has among the highest payback ratios of any activity related to maintenance and asset management of distribution equipment. Often, it pays for itself in a matter of months, by permitting overloaded units to be changed out before high loading levels lead to premature failure. Advanced approaches like this can apply much the same concept to evaluation of service quality and lifetime problems with the service-level circuits.
11.9 EVALUATING AND PRIORITIZING EQUIPMENT CONDITION
Theory of Condition and Correlation with Test Results
The theory of equipment aging and deterioration is well understood by the power industry. Three major factors “age” electrical equipment: voltage-frequency stress, thermal stress, and water damage.
1. Voltage aging. Given enough time, equipment that is simply energized (e.g., a cable kept in service but carrying no load) will fail due to the accumulated stress of voltage – somewhere, somehow, its insulation will break down. The level of stress, and hence the rate of deterioration in insulation strength, is a function of both voltage level and frequency. Insulation lifetime is exponentially related to voltage level by something between a fifth and ninth order relationship depending on type of material and design. This means doubling voltage will cut lifetime by anywhere between a factor of 25 (32) and 225 (33 ½ million) an incredibly wide range, indicating that insulation type and design are key factors in equipment quality.
The voltage-lifetime relationships for typical electrical insulation is in the range of fifth to tenth order. For example, XLPE insulation has a relationship that is ninth order. Doubling voltage means lifetime is cut by a factor of 29 (512), meaning the unit loses the equivalent of about 3 weeks of lifetime for every hour it is energized to twice its nominal voltage. Its lifetime will be cut by 35% if it is operated at 1.05 PU rather than 1.0 voltage.8
2. Frequency also plays an important role in aging. Time to failure is related to frequency, roughly on a linear basis (doubling frequency will roughly halve lifetime, halving it will roughly double lifetime. Frequency is regulated so tightly – within .02% even in “sloppy” systems – that the equipment installed in any power system will see very nearly the same operating frequency all its lifetime. Basically one can assume that the equipment sees nominal system frequency during all hours of operation.
However, voltage spikes due to lightning strikes, switching surges or other unusual transients have a very high frequency component due to the rapid rise and fall times of their transient pulse. By their very nature these events are higher than normal voltage, and that higher voltage causes added stress in and of itself. But even though brief, these disturbances can cause considerable stress on insulation due to their high frequency content. For example: assuming that lifetime and voltage are inversely related by a ninth order relationship (XLP cable), one can compute that a spike to 1.5 PU voltage, lasting one half millisecond (.0005 sec), would cause roughly 50% more stress than normal due to its higher voltage, multiplied by a factor of 16.69 (almost 150 billion) due to the higher frequency component of the spike. This means that this event lasting half of a millisecond ages the cable by the equivalent of about twoyears. In fact the impact may be somewhat different than this computation predicts, due to a host of secondary effects that can only be computed with an EMTP analysis.9 But the stress will still be great. Brief voltage events put undue stress on insulation.
Secondly, many diagnostic procedures such as hi-potential and partial discharge tests, and some cable fault location methods, use pulses (again, a high frequency content) or variable frequencies higher than normal. They can produce noticeably high stress on insulation.
8 This does not include the effects of any current increase due to the raised voltage. Generally, raising the voltage on a cable or unit of power system equipment will also raise the current passing through it (since it is a constant or very close to constant impedance). That increases the losses and hence the rate of thermal aging. The effects discussed here are due only to voltage – increasing the applied voltage on an unloaded section of XLPE cable by 5%, for example, is most likely to cut time until voltage breakdown occurs due to voltage stress alone, by a factor of about 35%. If that also leads to an increase in load, the additional thermal loading could contribute further acceleration of the cable aging.
9 This very simple computation neglects a host of electromagnetic transient (EMT) related factors that alter the induced stress, including changes in: 1) the impedance of the cable or insulators as a function of frequency, 2) the non-uniform distribution of stress that occurs as a function of high frequency, and 3) the fact that the exponential order of the relationship is itself a function of frequency.
3. High temperature has two effects on electrical insulation. First, some types of insulation (XLPE) soften at high temperatures to the point that plastic deformation occurs in the cable. The concentric conductor falls or “flows” through the insulation; mechanical stress on the cable may result in deformation. Minimum insulation distances can decrease as a result and failure can occur.
Secondly, and more important for the vast majority of equipment which does not suffer plastic deformation, higher temperatures accelerate all types of deterioration. The different modes of deterioration and the different deterioration rates of different materials are all affected in varying degrees, but qualitatively all forms of power system equipment lifetime loss are accelerated by higher temperature. A rough rule of thumb is that lifetime of cables is halved for every 9°C increase in temperature. Transformer insulation behaves in a roughly similar manner.
4. Combined stress of all three factors is what all-electrical equipment in service sees, the simultaneous effects of voltage, frequency and temperature, over time. Basically, the relative stress levels from these three factors are multiplicative, meaning that each exacerbates any problems due to the others:
Total amount of stress = C x |
(voltage stress factor) |
Thus, if voltage and frequency at the moment are causing high levels of stress, and the insulation is at high temperature – say 9°C higher than normal (which can be expected to roughly halve lifetime), then the accelerated rates of lifetime loss due to the voltage and frequency are doubled.
Condition Assessment from Inspection and Test Data Go/No-Go versus Condition Measurement
Table 11.7 reprises data from Chapter 6’s Table 6.4 on the types of test and diagnostic methods available for power system equipment. Some of the tests are basically “go/no-go” tests of equipment, such as the high potential test and a transformer turns ratio test. A unit will either pass, or fail this test. Units that pass are put in service. Units that fail should be withdrawn from service.
Other tests, such as the total combustible gas test (TCGA) provide a numerical measure that is useful in assessing condition, and by tracking over time, provides clues as to the gradual deterioration of the unit and its continued capability to provide dependable service. These diagnostic tests lead to classification and fuel decision making on future inspection, testing, and/or replacement of units. For example, TCGA is used to determine classification of transformers by risk category and to recommend inspection and testing intervals (IEEE Standard C57.104-1991).
Some tests can be viewed as both go/no-go and condition assessment. Insulation resistance can be used both as a certification test and diagnostic. Below a certain value of insulation resistance, the unit is not put into service, and the value can be tracked over time so that changes in the unit can be detected. Like it, most of the test procedures discussed in Chapter 6 provide quantitative results – numerical values that can vary over some range. For example, insulation resistance tests measure resistance in megaohms, and can return a value of from 1100 to 1500 ohms when tested on the windings of high voltage power transformer. A power factor test for cross-linked cable can give a value of from just above 0.0 to over 2.0%. Transformer turns ratio tests for a 138/12.47 kV transformer should give 11.06, but can give values below or above that ratio depending on internal faults in the high or low side windings.
Generally, go/no go tests are dependable indicators of the viability of power equipment for service during the next year. If a unit “passes” the appropriate tests, it will usually provide good service in the next year. Leave a unit that has failed such a test in service and it will very likely fail, often catastrophically but nearly always to a point of at least destroying any residual future value in the next year.
Condition assessment’s predictive capabilities
Given the wide ranges of numerical values that these tests return, it might be expected that “condition assessment” analysis would be able to translate these test results into a dependable evaluation of the condition of each transformer, cable, or other power system equipment. This would be something akin to an accurate ranking of “equivalent life” – this unit has the equivalent of 35 years (35/40th of normal service lifetime) left, that unit only 11 years, etc. But despite over a century of commercial power system application, electrical engineering technology is still not at this level. This is not to say that many attempts haven’t been made to develop such methods of translating test results into accurate status estimation. But at best they result in “fuzzy” or inexact evaluations. The use of inspection and test data to determine the overall condition of equipment is part science but still part “black” art.
With very few exceptions, the results from any one type of test are relatively straightforward to analyze and apply. The real challenge is combining results from multiple tests into a weighted or “single valued” evaluation that is both easy to use and accurate. For example, exactly what do the results mean when a cable passes an insulation resistance test with perfect scores (equivalent to when new), but PD tests indicate it has a number of weaknesses? Certainly, a qualitative interpretation is that the cable is currently operable but that it has imperfections that will develop into flaws over time. But how does the concern for this particular problem rank with respect to concerns about other cables that had other patterns of test scores? If budget is limited (and when isn’t it?) which cable will get the most attention?
Consider the data shown in Table 11.8 and Figure 11.7, which show total combustible gas accumulation rates, and insulation resistance test results, for a dozen 25 MVA 138-12.47 kV transformers tested by a large utility in the southern United States. in the spring of 1984. Individually, each of these two tests provides a numerical value that is a measure of the “condition” of the unit. Higher gassing rates indicate faster rates of deterioration or internal damage. Lower resistance indicates deteriorated insulation condition.
Table 11.7 Power System Electrical Test Procedures
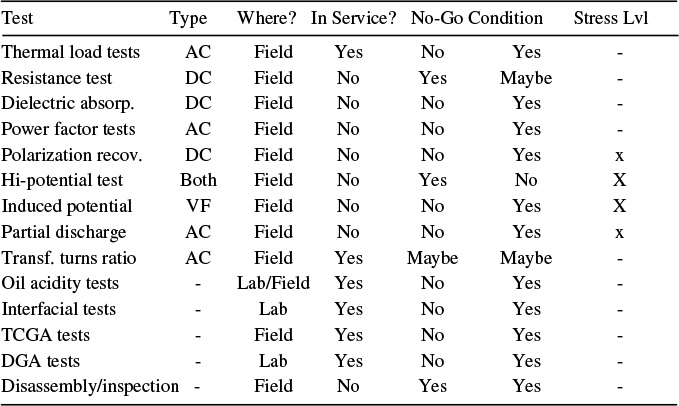
Table 11.8 Test Data for Twelve Power Transformers
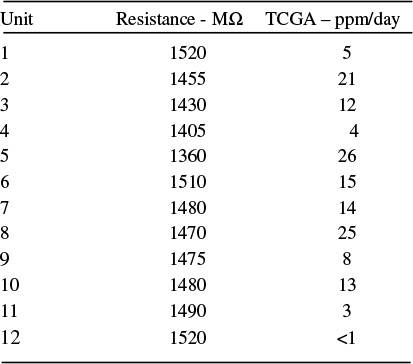
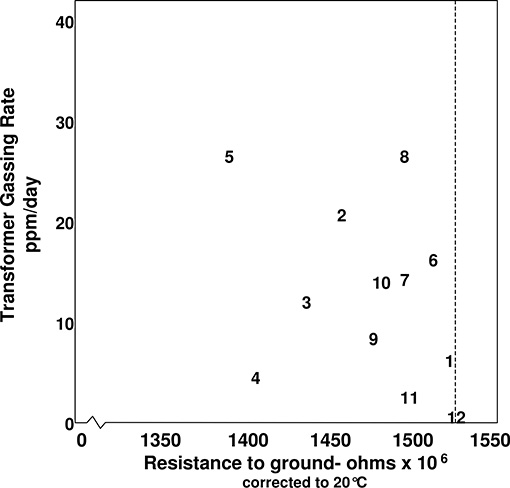
Figure 11.7 Position of transformers 1 – 12 based on their results in two tests.
Table 11.9 Service Lifetime Data for Twelve Power Transformers
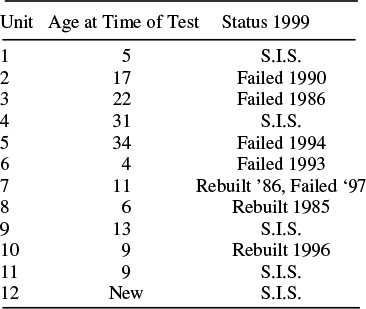
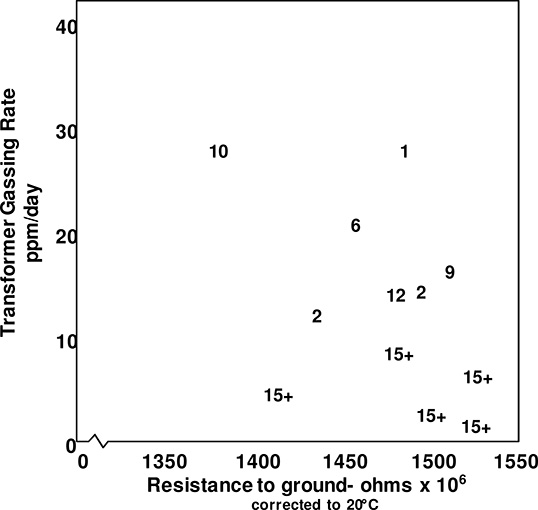
Figure 11.8 Remaining lifetime in service of the twelve units, plotted at the location of test results obtained. The rightmost of the two units with the highest data point vertically has an estimated only one year of service remaining. Clearly, units near the lower right hand corner were “in good condition,” but other lifetimes were not completely proportional to test results.
Table 11.9 and Figure 11.8 provide additional data on these twelve transformers, including age at the time of the tests (years in service up to 1984) and status of the unit fifteen years later (in 1999), a “result” not known at the time of the test. Note that Table 11.9’s data verifies that unit 4 is indeed an older unit as was surmised from the data interpretation discussed above. Note also that that unit provided good service for (at least) another 15 years. Similarly bearing out the test results, Table 11.9 shows that unit 8, although only 6 years old at the time, was withdrawn from service within a year of these tests and completely rebuilt.10
But what do the data mean when taken together, as when plotted in Figure 11.7? What additional information on condition can be inferred by using the combination of the two in some analytical manner? Note that, except for unit numbers 8 and 4, there is an identifiable if rather wide inverse relationship exhibited between the two tests – gassing rate goes up as resistance goes down. Roughly speaking then, either one of these tests provides roughly the same assessment as the other (ranking of units by either factor is not that much different), all except for the two outliers, 8 and 4. Of those, unit 4 apparently has considerably degraded insulation, but a low gassing rate. It may be an old unit, with deteriorated insulation due to age, but in otherwise very good condition (inferred because it is producing very little gas). Unit 8, on the other hand, is very likely a failure waiting to happen. Although its insulation tests quite well, the unit is producing gas at a high rate. If deterioration is not the cause (unlikely given the high resistance of the insulation), then the gas is being produced by some other mechanism (e.g. internal arcing) all of which are very undesirable, such as due to internal faults or arcing.
Figure 11.8 plots the years of remaining service given by these transformers at their test score’s position on the diagram.11 Note that either of the tests provide a fair ranking of remaining lifetime versus test results, in that remaining lifetime at the time of the plot clearly correlates, for the most part, with vertical or horizontal position on the plot. However, the correlation in either direction is only fair, not excellent. A combination of both tests helped identify problems somewhat better than either would alone. Certainly insulation resistance tests along would not have caught unit 8 as a critical unit to investigate further (it was the combination of high resistance and high gassing that indicated a real problem there).
Yet the tests, even combined, did a poor job of getting all the details right. A combination of poor scores in both tests clearly indicated transformer 5 was the “worst scoring” unit of the lot, but it lasted longer in service than units 2, 3 and 7, all of which tested much better in both tests. Unit 7 was a particular failure for the predictive capabilities of both tests. These tests gave no indication of any significant reason to think it did not have a good number of years of life remaining, like those other units nearby on the plot. It might have failed due to something other than age and deterioration (a direct lightning strike) but there was no indication of that.
10 The high gassing rate on a relatively good unit with high insulation scores led the utility to do a DGA test (see Chapter 6) on the unit which indicated high levels of acetylene – an indicator of internal arcing. The unit was withdrawn from service, torn down and rebuilt. During that process traces of carbonization were found.
11 These units are part of larger group which included units moved to another location (their positions were upgraded with larger units) and units that failed due to suspected lightning fails and/or vandalism. These units have been removed from the test data, leaving, as far as is known, only a group including units that failed due to "normal” causes.
Greater amounts of data improve condition assessment
The utility that owned these twelve units and actually did the tests shown above in 1984 had more test data than just the two sets of measurements given in Tables
11.8 and 11.9 and shown in Figures 11.7 and 11.8. It also had the total combustible gas counts, not just the rate of increase. Plotted in three dimensions (not shown), this additional data did not help improve the analytical results for these twelve units, except to verify that unit 4 had a low gas total, that thus despite its age really was in good condition.
Thus, a third set of measurements helped resolve one of two anomalies in the test results (units for which the other two test results differed as to evaluation of relative condition to the set as a whole). But it did little to improve the long-term predictive capability of the data set as a whole – it changed the prognosis for units 2, 3, 5 and 7 in no substantive way.
Periodic and Frequency Testing is Required for Efficacy
The data shown here and the results they give in application are typical. Despite careful measurement, estimation of remaining lifetime – long-term condition assessment – is inexact. This test (and others) bears out several lessons:
1. Multiple tests help, but mostly because it gives more opportunities to “flunk” a unit on the basis of a single test. Note that unit looked fine from the standpoint of insulation resistance. But it scored so poorly on the TCGA test, that it received almost immediate attention.
2. Explanations based on other data help make decisions. Unit 4 was an old unit, something known to the test personnel from their property and maintenance records. That age data provided an explanation for why unit 4 had a lower resistance reading – age means deterioration means lower resistance. Therefore unit 4’s reading was basically expected. Had unit 4 been three years old, the interpretation of that test data would have been far different – there is a problem.
3. The best of tests are imperfect predictors. As mentioned above, roughly 4 out of 12 units (2, 3, 5 and 7) in this set ultimately had service lifetimes different than might have been expected based on their test results. These strike the authors as typical results – long-term condition analysis is dependable only about 50% of the time.
Thus, the overall conclusion one reaches about using test data for condition assessment is that:
1. Multiple tests have value because they test for different things or test the same thing (insulation strength) in different ways, and therefore increase the number of ways that flaws or weaknesses can be detected.
2. Good records are a critical part of inspection and testing and can be used in conjunction with test data to improve evaluation.
3. Periodic testing must be done, because long-term predictive capability of the tests is far from perfect.
4. Models of equipment behavior and function are essential, as they permit the test results to be interpreted both for consistency and importance.12
This mirrors what was said in Chapters 6 and 7 when comparing modern equipment diagnostic technology to medical diagnostic capabilities. In both fields, the tests are fairly good at identifying a reason (if there is one) for immediate concern due to an impending failure, but poor at predicting how condition will deteriorate, or not, over the long term.
Basically, both the results shown here and experience gained elsewhere all indicate the same thing: that testing and diagnostics, while giving some indication of long-term condition prognosis and remaining lifetime, are basically accurate only at identifying flaws and weaknesses that currently or soon will limit capability. Thus, the only viable way for a utility to maintain a good picture of its asset base’s condition, is to perform frequent “check ups” on that equipment.
11.10 CONDITION TRACKING
As a carefully considering categorization of equipment that leads to recommendations for service and management actions, condition determination alone provides a great deal of value to a power delivery system owner-operator. But condition tracking, which involves recording equipment data and monitoring change over time, provides much greater value. Generally, condition tracking involves periodic gathering of equipment data (“asset data”) along with automatic or routine state and condition evaluation, following by evaluation of condition and state changes. The review period used varies greatly among applications the authors have seen, from quarterly to daily in cases of key equipment. In many cases, a variable temporal resolution approach is taken to condition and data archiving. This might involve monthly readings which are archived for a twelve-month period, quarterly readings only for the prior four years and annual readings and data retained prior to that. Data for bad actors, critical units, or those being monitored for R&D or other reasons of special interest, might be retained in more detail. Condition tracking can be done as a stand alone process and application or as part of a integrated asset management and registry. Benefits are:
12 Models contribute value by relating test results to how the device functions or reacts and helping identify if the results are merely important or critical. “Model” here does not necessarily mean a computer model. It could be simply the conceptual understanding that test personnel have of how a device like a transformer ages and behaves in use.
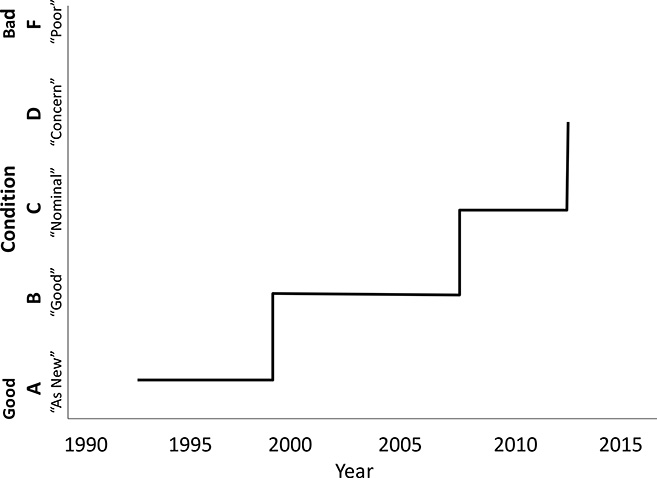
Figure 11.9 Condition tracking and the process built around it will require immediate attention any time condition changes. Here, a unit installed in 1992 is tracked over time. It transitions from “as new” to “good” in 1999, at which time the attention given to it consists solely of moving it onto a list for more routine inspection and testing, as for all “good” units. Seventeen years later, roughly on schedule as far as age and its effects go, it moves to “nominal” at which time the utility’s guidelines call for an immediate full inspection and periodic inspections and service afterwards corresponding to that condition categorization. Only eight years later it transitions to “concern,” far ahead of the normal anticipated trend, it moves to condition D. At this point it gets immediate attention as a potential problem.
Incipient problem detection. As in human and veterinarian medicine, change in a key measure of the health index is often the earliest and most dependable warning about impending problems. Particularly in major equipment, a sudden change in gassing or acoustic readings may indicate a problem that must be dealt with now. Thus, condition change alarms or notifications are often given (Figure 11.9). An asset tracking system might e-mail particular managers with alerts if condition changes radically in a way that should cause concern, etc.
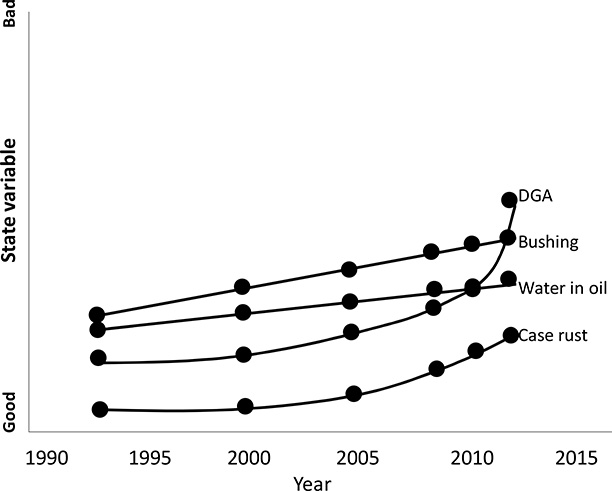
Figure 11.10 Tracking of the state variables, which could also be considered tracking of the major component conditions of the unit in this case, reveals the cause for the most recent condition change and also a reason for some haste in taking action. Even though the DGA level itself is firmly within mid range, the rate of gassing is extreme concern, justifying a high level of concern for the unit’s integrity. This transformer’s core is apparently not healthy, and the unit will receive immediate attention.
Cost management. Rate of change in health metrics is another factor to be considered in prioritizing units and allocating limited service and repair resources. Of two breakers that are both rated “acceptable, but of concern,” the one deteriorating fastest may be the one most in need of service.
Improved predictive models. Recording and studying the history of condition and how it changes can clearly lead to improved models of how such trends proceed. This applies both to the computer models and processes built around them and the intuition of those using the systems. As one utility manager put it: “Using our system for two years taught me that the category ‘acceptable but of concern’ means we’re never going to have time to look at it and it’s really good enough to go anyway.”
People Often Say Condition Tracking When They Mean State Tracking
Using the distinctions made in the summary, tracking of condition can be useful but not nearly as useful as tracking of state (Figure 11.10). The trigger that brings a unit experiencing change to management’s attention will invariably be a change in condition (“Bayfront Substation’s 345/138 auto transformer has gone from B to C in the last week.”). But details related to its state and perhaps even the raw data itself may be needed immediately in order to understand the significance of the change and any urgency for action. (“Gassing has increased fourfold since the through-fault on the 19th of April . . . Traces of acetylene have been detected”). Thus, when most people or organizations talk about “condition tracking” they actually mean the periodic archiving of inspection, operating, and test data along with the state estimates and the overall condition determination. Condition is the factor that is tracked in terms of alarm criteria and used as the trigger for an alarm, notification, or recommendation for action – i.e., state might change but if the unit’s condition remains the same then any recommended actions or consequences of its condition remain the same.
11.11 SUMMARY AND FINAL COMMENTS
Understand the Difference Between Condition Assessment and Failure Prediction
As mentioned in Chapter 6, exact knowledge of when a unit would fail would be worth a great deal to a utility. But even the best condition-assessment methods can not predict exactly the expected remaining lifetime, other than in extreme cases where the unit’s failure is imminent. In many such cases monitoring and testing can usually determine the unit is about to fail.
In all but those “near to failure” cases, the best that good condition assessment can do is to rate the relative likelihood that a unit will fail. One hundred transformers judged to be in “poor condition” will see far more failures in the next twelve months than one hundred that have been assessed to be in “very good” condition. Just how poor and just how good the units have been assessed will give some indication of failure rate. The information provided is a step in the right direction and worth a good deal toward improving service quality and allowing optimal management of equipment lifetimes. But again, this condition assessment is not a prediction of expected lifetime. Instead, it can and should be used to set priorities and general operating policy.
Good Record Keeping
Good records on the service and maintenance history of major equipment should be a part of any comprehensive condition assessment and improvement program. Records of the annual peak load and duration of peak served, and kWh served through the unit should be maintained. This equipment operating record library should also contain information on the number, type, and time of all through-faults and other types of abnormal events that occurred to the unit. Similarly, records of all inspections and maintenance should be maintained along with any comments on findings during inspections and repair (“Lower northwest corner of case dented”).
Record keeping has a good deal of value. Recall Chapter 6’s discussion of the value that exact knowledge of future time-of-failure would be worth. Accurate prediction of the exact failure of time is probably not feasible and is certainly not within the capabilities of existing technologies. Nevertheless, an old transformer is worth considerably more to a utility, in terms of being able to estimate its likelihood of failure, if records are maintained so its operating history is available to help determine its condition. Therefore, good record keeping has real value.
The most common failing among utilities in terms of record-keeping is a lack of historical data on through-faults, which many power systems engineers (including the authors) believe is a leading cause of transformer failure.
Inspection, Test, and Diagnosis/Tracking Program
The methods covered in this chapter are worthwhile only if applied in well-managed programs aimed at improving and maintaining service quality at high levels while keeping costs as low as possible. The recommended method of determining priority and of setting the intervals for inspection, testing, and diagnostic evaluation is to use the appropriate approach as described in that chapter.
REFERENCES AND BIBLIOGRAPHY
ABB Transformer Division, Service Handbook for Power Transformers, ABB Transformer Remanufacturing and Engineering Services, St. Louis, 2006.
P. Gill, Electrical Power Equipment Maintenance and Testing, Marcel Dekker, New York, 1998.
H. H. Malik, A. A. AlArainy, and M. I. Qureshi, Electrical Insulation in Power Systems, Marcel Dekker, 1998.
S. D. Myers, J. J. Kelly and R. H. Parrish, Fifty Years: A Guide to Transformer Maintenance, Transformer Maintenance Institute, Akron, OH, 1981.
O. C. Seevers, Management of Transmission and Distribution Systems, Fairmont Press, Lilburn, GA, 1995.
W. A. Thue, Electrical Power Cable Engineering, Marcel Dekker, New York, 1999.