- Preface to the Second Edition
- Preface
- Nomenclature
- 1 Introduction
- 2 Compressible Flow with Friction and Heat: A Review
- 2.1 Introduction
- 2.2 A Brief Review of Thermodynamics
- 2.3 Isentropic Process and Isentropic Flow
- 2.4 Conservation Principles for Systems and Control Volumes
- 2.5 Speed of Sound & Mach Number
- 2.6 Stagnation State
- 2.7 Quasi-One-Dimensional Flow
- 2.8 Area–Mach Number Relationship
- 2.9 Sonic Throat
- 2.10 Waves in Supersonic Flow
- 2.11 Normal Shocks
- 2.12 Oblique Shocks
- 2.13 Conical Shocks
- 2.14 Expansion Waves
- 2.15 Frictionless, Constant-Area Duct Flow with Heat Transfer
- 2.16 Adiabatic Flow of a Calorically Perfect Gas in a Constant-Area Duct with Friction
- 2.17 Friction (Drag) Coefficient Cf and D’Arcy Friction Factor and D’Arcy Friction Factor fD
- 2.18 Dimensionless Parameters
- 2.19 Fluid Impulse
- 2.20 Summary of Fluid Impulse
- References
- Problems
- 3 Engine Thrust and Performance Parameters
- 3.1 Introduction
- 3.2 Installed Thrust—Some Bookkeeping Issues on Thrust and Drag
- 3.3 Engine Thrust Based on the Sum of Component Impulse
- 3.4 Rocket Thrust
- 3.5 Airbreathing Engine Performance Parameters
- 3.6 Modern Engines, Their Architecture and Some Performance Characteristics
- 3.7 Summary
- References
- Problems
- 4 Gas Turbine Engine Cycle Analysis
- 5 General Aviation and Uninhabited Aerial  Vehicle Propulsion System
- 6 Aircraft Engine Inlets and Nozzles
- 6.1 Introduction
- 6.2 The Flight Mach Number and Its Impact on Inlet Duct Geometry
- 6.3 Diffusers
- 6.4 An Ideal Diffuser
- 6.5 Real Diffusers and Their Stall Characteristics
- 6.6 Subsonic Diffuser Performance
- 6.7 Subsonic Cruise Inlet
- 6.8 Transition Ducts
- 6.9 An Interim Summary for Subsonic Inlets
- 6.10 Supersonic Inlets
- 6.11 Normal Shock Inlets
- 6.12 External Compression Inlets
- 6.13 Variable Geometry—External Compression Inlets
- 6.14 Mixed-Compression Inlets
- 6.15 Supersonic Inlet Types and Their Performance—A Review
- 6.16 Standards for Supersonic Inlet Recovery
- 6.17 Exhaust Nozzle
- 6.18 Gross Thrust
- 6.19 Nozzle Adiabatic Efficiency
- 6.20 Nozzle Total Pressure Ratio
- 6.21 Nozzle Pressure Ratio (NPR) and Critical Nozzle Pressure Ratio (NPRcrit.)
- 6.22 Relation Between Nozzle Figures of Merit, ηn and πn
- 6.23 A Convergent Nozzle or a De Laval?
- 6.24 The Effect of Boundary Layer Formation on Nozzle Internal Performance
- 6.25 Nozzle Exit Flow Velocity Coefficient
- 6.26 Effect of Flow Angularity on Gross Thrust
- 6.27 Nozzle Gross Thrust Coefficient Cfg
- 6.28 Overexpanded Nozzle Flow—Shock Losses
- 6.29 Nozzle Area Scheduling, A8 and A9/A8
- 6.30 Nozzle Exit Area Scheduling, A9/A8
- 6.31 Nozzle Cooling
- 6.32 Thrust Reverser and Thrust Vectoring
- 6.33 Hypersonic Nozzle
- 6.34 Exhaust Mixer and Gross Thrust Gain in a Mixed-Flow Turbofan Engine
- 6.35 Noise
- 6.36 Nozzle-Turbine (Structural) Integration
- 6.37 Summary of Exhaust Systems
- References
- Problems
- 7 Combustion Chambers and Afterburners
- 7.1 Introduction
- 7.2 Laws Governing Mixture of Gases
- 7.3 Chemical Reaction and Flame Temperature
- 7.4 Chemical Equilibrium and Chemical Composition
- 7.5 Chemical Kinetics
- 7.6 Combustion Chamber
- 7.7 Combustion-Generated Pollutants
- 7.8 Aviation Fuels
- 7.9 Alternative “Drop-In” Jet Fuels (AJFs)
- 7.10 Combustion Instability: Screech and Rumble
- 7.11 Summary
- References
- Problems
- 8 Axial Compressor Aerodynamics
- 8.1 Introduction
- 8.2 The Geometry
- 8.3 Rotor and Stator Frames of Reference
- 8.4 The Euler Turbine Equation
- 8.5 Axial-Flow Versus Radial-Flow Machines
- 8.6 Axial-Flow Compressors and Fans
- 8.7 Compressor Performance Map
- 8.8 Compressor Instability – Stall and Surge
- 8.9 Multistage Compressors and Their Operating Line
- 8.10 Multistage Compressor Stalling Pressure Rise and Stall Margin
- 8.11 Multistage Compressor Starting Problem
- 8.12 The Effect of Inlet Flow Condition on Compressor Performance
- 8.13 Isometric and Cutaway Views of Axial-Flow Compressor Hardware
- 8.14 Compressor Design Parameters and Principles
- 8.15 Summary
- References
- Problems
- 9 Centrifugal Compressor Aerodynamics
- 10 Aerothermo-dynamics of Gas Turbines
- 10.1 Introduction
- 10.2 Axial-Flow Turbines
- 10.3 Turbine Performance Map
- 10.4 The Effect of Cooling on Turbine Efficiency
- 10.5 Turbine Blade Profile Design
- 10.6 Stresses in Turbine Blades and Disks and Useful Life Estimation
- 10.7 Axial-Flow Turbine Design and Practices
- 10.8 Gas Turbine Design Summary
- 10.9 Summary
- References
- Problems
- 11 Aircraft Engine Component Matching and Off-Design Analysis
- 12 Chemical Rocket and Hypersonic Propulsion
- 12.1 Introduction
- 12.2 From Takeoff to Earth Orbit
- 12.3 Chemical Rockets
- 12.4 Chemical Rocket Applications
- 12.5 New Parameters in Rocket Propulsion
- 12.6 Thrust Coefficient, CF
- 12.7 Characteristic Velocity, c*
- 12.8 Flight Performance
- 12.9 Multistage Rockets
- 12.10 Propulsive and Overall Efficiencies
- 12.11 Chemical Rocket Combustion Chamber
- 12.12 Thrust Chamber Cooling
- 12.13 Combustor Volume and Shape
- 12.14 Rocket Nozzles
- 12.15 High-Speed Airbreathing Engines
- 12.16 Rocket-Based Airbreathing Propulsion
- 12.17 Summary
- References
- Problems
- A. U.S. Standard Atmosphere
- B. Isentropic Table
- C. Normal Shock Table
- D. Rayleigh Flow
- E. Fanno Flow
- F. Prandtl–Meyer Function and Mach Angle
- G. Oblique Shock Charts
- H. Conical Shock Charts
- I. Cascade Data
- J. Websites
- K. 10-Minute Quiz: Closed books and notes
- Quiz No. 1
- Quiz No. 2
- Quiz No. 3
- Quiz No. 4
- Quiz No. 5
- Quiz No. 6
- Quiz No. 7
- Quiz No. 8
- Quiz No. 9
- Quiz No. 10
- Quiz No. 11
- Quiz No. 12
- Quiz No. 13
- Quiz No. 14
- Quiz No. 15
- Quiz No. 16
- Quiz No. 17
- Quiz No. 18
- Quiz No. 19
- Quiz No. 20
- Quiz No. 21
- Quiz No. 22
- Quiz No. 23
- Quiz No. 24
- Quiz No. 25
- Quiz No. 26
- Quiz No. 27
- Quiz No. 28
- Quiz No. 29
- Quiz No. 30
- Quiz No. 31
- Quiz No. 32
- Quiz No. 33
- Quiz No. 34
- Quiz No. 35
- Quiz No. 36
- Quiz No. 37
- Quiz No. 38
- Quiz No. 39
- Quiz No. 40
- Quiz No. 41
- Quiz No. 42
- Quiz No. 43
- Quiz No. 44
- Quiz No. 45
- L. Some “Rules of Thumb” and ” and Trends in Aircraft Propulsion
- Index
- End User License Agreement
APPENDIX I
Cascade Data
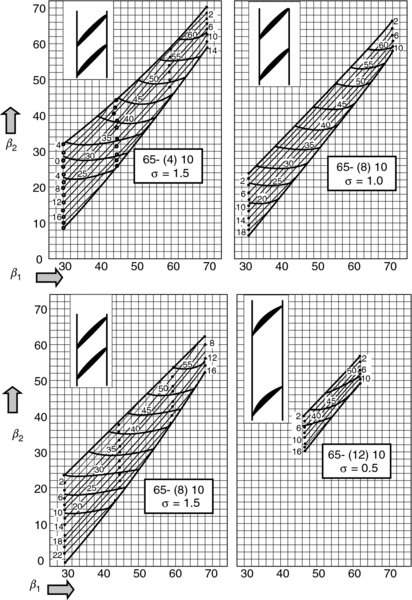
NACA-65 Series Cascade Data
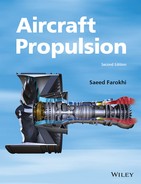
Cascade total pressure loss data are plotted in the shape of a “bucket” in terms of incidence angle. A definition sketch is shown.

Definition sketch for the cascade stall boundaries, according to Mellor
Mellor presents the operational range of each 65-series airfoils in various cascade arrangements that are very useful for preliminary design purposes. Mellor’s unpublished graphical correlations (originated at MIT’s Gas Turbine Laboratory) were published by Horlock (1973), Hill and Peterson (1992), among others. In this appendix, Mellor’s cascade data presentation is graphed according to the following definition sketch.
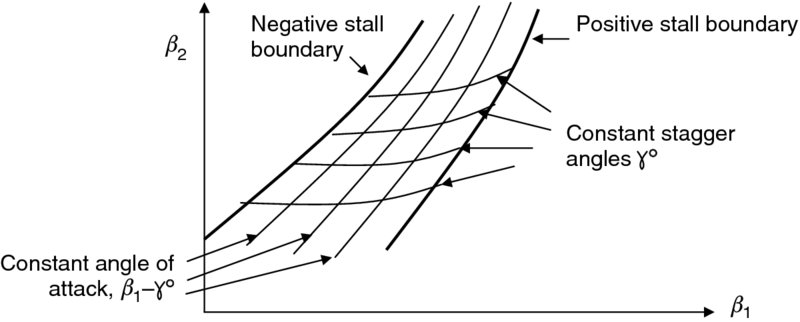
Definition sketch for the 65-series cascade data as presented by Mellor
Cascade Data


-
No Comment
..................Content has been hidden....................
You can't read the all page of ebook, please click here login for view all page.