
Chapter 6. What Every Developer Needs to Know About Reports
IN THIS CHAPTER
- Why This Chapter Is Important
- Examining Types of Reports Available
- Understanding the Anatomy of a Report
- Creating a New Report
- Working with the Report Design Window
- Selecting the Correct Control for the Job
- What Report Properties Are Available, and Why Should You Use Them?
- What Control Properties Are Available, and Why Should You Use Them?
- Inserting Page Breaks
- Using Unbound, Bound, and Calculated Controls
- Using Expressions to Enhance Your Reports
- Building Reports Based on More Than One Table
- Working with Sorting and Grouping
- Improving Performance and Reusability by Basing Reports on Stored Queries or Embedded SQL Statements
- Using Access Reports and the Internet
- Understanding Report Specifications and Limitations
- Practical Examples: Building Reports Needed for Your Application
Why This Chapter Is Important
Although forms provide an excellent means for data entry, reports are the primary output device in Access. You can preview reports on the screen, output them to a printer, display them in a browser, and more! Reports are relatively easy to create and are extremely powerful. This chapter covers the basics of creating and working with reports. After reading this chapter, you’ll be familiar with the types of reports available. You’ll learn how to build reports with and without a wizard and how to manipulate the reports that you build. You will understand the report and control properties available and when it is appropriate to use each. You’ll also be familiar with many important report techniques.
Examining Types of Reports Available
The reporting engine of Microsoft Access is very powerful, with a wealth of features. Many types of reports are available in Access 2007:
- Detail reports
- Summary reports
- Cross-tabulation reports
- Reports containing graphics and charts
- Reports containing forms
- Reports containing labels
- Reports including any combination of the preceding
Detail Reports
A Detail report supplies an entry for each record included in the report. As you can see in Figure 6.1, there’s an entry for each order in the Customers table. The report’s detail is grouped by the first character of the customer’s last name.
Figure 6.1. An example of a Detail report.

Summary Reports
A Summary report gives you summary data for all the records included in the report. In Figure 6.2, only total sales by product for the month of June are displayed in the report. The underlying detail records that compose the summary data aren’t displayed in the report. The report itself contains only programmatically calculated controls in its Detail section. The remainder of the controls are placed in report Group Headers and Footers that are grouped on the month and year of the order. Because only programmatically calculated controls are found in the report’s Detail section, Access prints summary information only.
Figure 6.2. An example of a Summary report.

Cross-Tabulation Reports
Cross-tabulation reports display summarized data grouped by one set of information on the left side of the report and another set across the top. The report shown in Figure 6.3 shows total sales by product name and employee. The report is based on a crosstab query and is generated using a fair amount of Visual Basic for Applications (VBA) code. This code is required because each time the report is run, a different number of employees might need to be displayed in the report’s columns. In other words, the number of columns needed might be different each time the user runs the report. This report and the techniques needed to produce it are covered in Chapter 11, “Advanced Report Techniques.”
Figure 6.3. An example of a cross-tabulation report.

Reports with Graphics and Charts
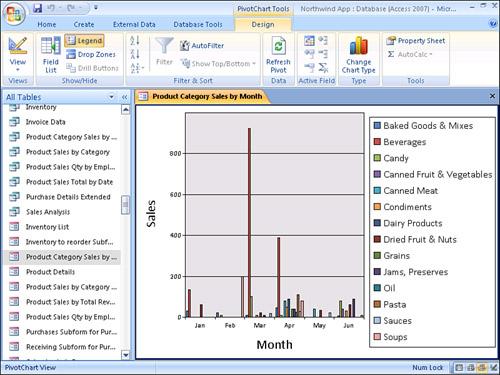
Although the statement “A picture paints a thousand words” is a cliché, it’s also quite true; research proves that you retain data much better when it’s displayed as pictures rather than numbers. Fortunately, Access makes including graphics and charts in your reports quite easy. As you can see in Figure 6.4, you can design a report that contains one or more charts. The report in Figure 6.4 shows the sales by product for the month. The main report is grouped by order date and product category. The chart totals product sales by product category, displaying the information graphically.
Figure 6.4. An example of a report with a chart.
Reports with Forms
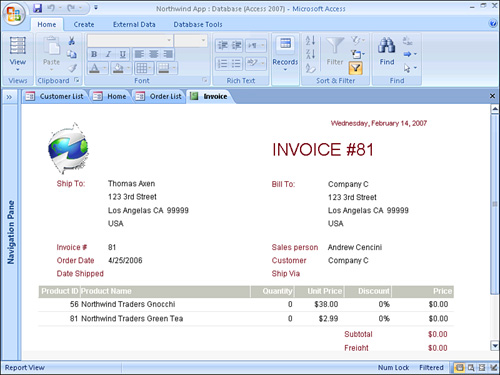
Users often need a report that looks like a printed form. The Access Report Builder, with its many graphical tools, allows you to quickly produce reports that emulate the most elegant data entry form. The report shown in Figure 6.5 produces an invoice for a customer. The report is based on a query that draws information from the Customers, Orders, Order Details, Products, Employees Extended, and Shippers tables. The report’s Filter property is filled in, limiting the data that appears on the report to a particular order in the Orders table. Using graphics, color, fonts, shading, and other special effects gives the report a professional look.
Figure 6.5. An example of a report containing a form.
Reports with Labels
Creating mailing labels in Access 2007 is easy using the Label Wizard. Mailing labels are simply a special type of report with a page setup indicating the number of labels across the page and the size of each label. An example of a mailing label report created by using the Label Wizard is shown in Figure 6.6. This report is based on the Customers table but could have just as easily been based on a query that limits the mailing labels produced.
Figure 6.6. An example of a report containing mailing labels.

Understanding the Anatomy of a Report
Reports can have many parts. These parts are referred to as sections of the report. A new report is automatically made up of the following three sections, shown in Figure 6.7:
- Page Header section
- Detail section
- Page Footer section
Figure 6.7. Sections of a report.

The Detail section is the main section of the report; it’s used to display the detailed data of the table or query underlying the report. Certain reports, such as Summary reports, have nothing in the Detail section. Instead, Summary reports contain data in Group Headers and Footers (discussed at the end of this section).
The Page Header is the portion that automatically prints at the top of every page of the report. It often includes information such as the report’s title. The Page Footer automatically prints at the bottom of every page of the report and usually contains information such as the page number and date. Each report can have only one Page Header and one Page Footer.
In addition to the three sections automatically added to every report, a report can have the following sections:
A Report Header is a section that prints once, at the beginning of the report; the Report Footer prints once, at the end of the report. Each Access report can have only one Report Header and one Report Footer. You will often use the Report Header to create a cover sheet for the report. It can include graphics or other fancy effects, adding a professional look to a report. The most common use of the Report Footer is for grand totals, but it can also include any other summary information for the report.
In addition to Report and Page Headers and Footers, an Access report can have up to 10 Group Headers and Footers. Report groupings separate data logically and physically. The Group Header prints before the detail for the group, and the Group Footer prints after the detail for the group. For example, you can group customer sales by country and city, printing the name of the country or city for each related group of records. If you total the sales for each country and city, you can place the country and city names in the country and city Group Headers and the totals in the country and city Group Footers.
Creating a New Report
You can create a new report in several ways; the most common is to select the Create tab and then click Report Wizard from the Reports group. You can create reports from scratch by using Design view; you can also create them with Quick Create. Access also sports a Label Wizard, which helps quite a bit when you need to print labels. The Report Wizards are so powerful that I use one of them to build the initial foundation for almost every report I create.
Creating a Report with the Report Wizard
To create a report with the Report Wizard, click to select the Create tab. Next, select Report Wizard from the Reports group. This launches the Report Wizard. The first step is to select the table or query that will supply data to the report. I prefer to base my reports on queries or on embedded Structured Query Language (SQL) statements (a query stored as part of a report). This approach generally improves performance because it returns as small a dataset as possible. In a client/server environment, this is particularly pronounced because the query is usually run on the server, and only the results are sent over the network wire. Basing reports on queries also enhances your ability to produce reports based on varying criteria.
After you have selected a table or query, you can select the fields you want to include in the report. The fields included in the selected table or query are displayed in the list box on the left. To add fields to the report, double-click the name of the field you want to add or click the field name and click the > button. In the example in Figure 6.8, five fields have been selected from the tblClients table.
Figure 6.8. The first step of the Report Wizard: table/field selection.

After you have selected a table or query and the fields you want to include on the report, click Next. The wizard prompts you to add group levels, which add report groupings, to the report. Add group levels if you need to visually separate groups of data or include summary calculations (subtotals) in your report. Report groupings are covered later in this chapter. If your report doesn’t require groupings, click Next.
In the third step of the Report Wizard, you choose sorting levels for your report. Because the order of a query underlying a report is overridden by any sort order designated in the report, it’s a good idea to designate a sort order for the report. You can add up to four sorting levels with the wizard. In the example shown in Figure 6.9, the report is sorted by the ClientID field. After you select the fields you want to sort on and whether you wish to sort in ascending or descending order, click Next.
Figure 6.9. The third step of the Report Wizard: sorting report data.

In the fourth step of the Report Wizard, you decide on the report’s layout and orientation. The layout options vary depending on what selections you made in the wizard’s previous steps. The orientation can be Portrait or Landscape. This step of the Report Wizard also allows you to specify whether you want Access to adjust the width of each field so that all the fields fit on each page. After you supply Access with this information, click Next.
You choose a style for your report in the Report Wizard’s fifth step. There are quite a few choices available. You can preview each look before you make a decision. Any of the style attributes applied by the Report Wizard, as well as other report attributes defined by the wizard, can be modified in Report Design view any time after the wizard has produced the report. After you have selected a style, click Next.
The final step of the Report Wizard prompts you for the report’s title. Access uses this title as both the name and the caption for the report. I supply a standard Access report name and modify the caption after the Report Wizard has finished its process. You’re then given the opportunity to preview the report or modify the report’s design. If you opt to modify the report’s design, you’re placed in Design view (see Figure 6.10). You can then preview the report at any time. You can optionally mark the check box Display Help on Working with the Report to have Access display the help window and list the associated report topics.
Figure 6.10. Design view of a completed report.
Creating a Report from Design View
Although you usually start most of your reports by using a Report Wizard, you should understand how to create a new report from Design view. To create a report without using a wizard, click the Report Design button in the Reports group of the Create tab. The Report Design window appears. You must then set the Record Source of the report to the table or query upon which you want the report to be based.
Working with the Report Design Window
You use the Report Design window to build and modify a report. Using this window, you can add objects to a report and modify their properties. Microsoft provides numerous Report, Report Grouping, and Control properties. By modifying these properties, you can create reports with diverse looks and functionality.
Understanding the Report Design Tools
To help you design reports, several report design tools are available, including the Ribbon, Property Sheet, Field List, and Sorting and Grouping windows. Three tabs are also available to make developing and customizing your reports easier: Design, Arrange, and Page Setup. The Design tab contains tools that allow you to group and total your report, add controls to your report, add existing fields to the report, and view and modify the property sheet associated with the report. The Arrange tab is specifically designed to help you customize the look of your report. It includes tools for applying an AutoFormat to a report, aligning and positioning control on the report, and sizing report objects.
The Properties, Toolbox, Field List, and Sorting and Grouping windows are all designed as toggles. This means that buttons on the Report Design toolbar alternately hide and show these valuable windows. If you have a high-resolution monitor (or multiple monitors), you might want to leave the windows open at all times. If you have a low-resolution monitor, you need to get a feel for when it’s most effective for each window to be opened or closed.
Adding Fields to the Report
You can most easily add fields to a report by using the Field List window. With the Field List window open (see Figure 6.11), click and drag a field from the field list onto the appropriate section of the report. You can add several fields at one time, just as you can do with forms. Use the Ctrl key to select noncontiguous fields, use the Shift key to select contiguous fields, or double-click the field list’s title bar to select all the fields; then click and drag them to the report as a unit.
Figure 6.11. Design view of a completed report.

Caution
One problem with adding fields to a report is that both the fields and the attached labels are placed in the same section of the report. This means that, if you click and drag fields from the Field List window to the Detail section of the report, both the fields and the attached labels appear in the Detail section. If you’re creating a tabular report, this isn’t acceptable, so you must cut the attached labels and paste them into the report’s Page Header section.
Selecting, Moving, Aligning, and Sizing Report Objects
Microsoft Access offers several techniques to help you select, move, align, and size report objects. Different techniques are effective in different situations. Experience will tell you which technique you should use and when. The steps for selecting, moving, aligning, and sizing report objects are quite similar to performing the same tasks with form objects. The techniques are covered briefly in this chapter; for a more detailed explanation of each technique, refer to Chapter 5, “What Every Developer Needs to Know About Forms.”
Selecting Report Objects
To select a single report object, click it; selection handles appear around the selected object. After you select the object, you can modify any of its attributes (properties), or you can size, move, or align it.
To select multiple objects so that you can manipulate them as a unit, use one of the following techniques:
- Hold down the Shift key as you click multiple objects. Each object you click is then added to the selection.
- Place your mouse pointer in a blank area of the report. Click and drag to lasso the objects you want to select. When you let go of the mouse, any object even partially within the lasso is selected.
- Click and drag within the horizontal or vertical ruler. As you click and drag, lines appear indicating the potential selection area. When you release the mouse, all objects within the lines are selected.
Make sure you understand which objects are actually selected; attached labels can cause some confusion. Figure 6.12 shows a report with four objects selected: the Client ID and Intro Date labels and the CompanyName and DefaultRate text boxes. The Company Name and Default Rate labels and the ClientID and IntroDate text boxes are not selected. If you were to modify the properties of the selected objects, those controls would be unaffected.
Figure 6.12. Selecting objects in an Access report.

Moving Objects Around
If you want to move a single control along with its attached label, click the object and drag it to a new location. The object and the attached label move as a unit. To move multiple objects, use one of the methods explained in the preceding section to select the objects you want to move. After you select the objects, click and drag any of them; the selected objects and their attached labels move as a unit.
Moving an object without its attached label is a trickier process. When placed over the center or border of a selected object (not on a sizing handle), the mouse pointer looks like a hand with all five fingers pointing upward. This indicates that the selected object and its attached label move as a unit, maintaining their relationship to one another. However, if you place your mouse pointer directly over the selection handle in the object’s upper-left corner, the mouse pointer looks like a cross-bar. This indicates that the object and the attached label move independently of one another so that you can alter the distance between them.
Aligning Objects with One Another
To align objects with one another, you must select them first. Click the Arrange tab. Then select the appropriate button in the Control Alignment group. The selected objects will align in relation to each other.
Caution
Watch out for a few “gotchas” when you’re aligning report objects: If you select several text boxes and their attached labels and align them, Access tries to align the left sides of the text boxes with the left sides of the labels. To avoid this problem, you have to align the text boxes separately from their attached labels.
During the alignment process, Access never overlaps objects. For this reason, if the objects you’re aligning don’t fit, Access can’t align them. For example, if you try to align the bottom of several objects horizontally and they don’t fit across the report, Access aligns only the objects that fit on the line.
Using Snap to Grid
The Snap to Grid feature is a toggle found on the Arrange tab. When you select Snap to Grid, all objects that you’re moving or sizing snap to the report’s gridlines. To temporarily disable the Snap to Grid feature, hold down your Ctrl key while sizing or moving an object.
Using Power-Sizing Techniques
Access offers many techniques to help you size report objects. A selected object has eight sizing handles, and you can use all of them, except for the upper-left handle, to size the object. Using the upper-left handle moves the object independently of an object it is attached to (that is, it moves an attached label independently of the text box it is attached to). Simply click and drag one of the sizing handles. If you select multiple objects, Access sizes them by the same amount.
The tools found in the Size group on the Arrange tab can also help you size objects. The Size group has six options: To Fit, To Grid, To Tallest, To Shortest, To Widest, and To Narrowest. These options are discussed in detail in Chapter 5.
Tip
Access offers a great trick that can help size labels to fit. Simply double-click any sizing handle, and the object is automatically sized to fit the text within it.
Controlling Object Spacing
Access also makes it easy for you to control object spacing. You can make both the horizontal and vertical distances between selected objects equal. Select the objects, click to select the Arrange tab, and then use the appropriate tool in the Position group to achieve the desired effect. You can also maintain the relative relationship between selected objects while increasing or decreasing the space between them. Once again, to do this, use the appropriate tool in the Position group.
Selecting the Correct Control for the Job
Reports usually contain labels, text boxes, lines, rectangles, image controls, and bound and unbound object frames. You use the other controls for reports that emulate data entry forms. The different controls you can place on a report, as well as their uses, are discussed briefly in the following sections.
Labels
You use labels to display information to your users. They’re commonly used as report headings, column headings, or group headings for your report. Although you can modify the text they display at runtime by using VBA code, you can’t directly bind them to data.
To add a label to a report, select the Label tool on the ribbon; then click and drag to place the label on the report.
Text Boxes
You use text boxes to display field information or the result of an expression. Text boxes are used throughout a report’s different sections. For example, in a Page Header, a text box might contain an expression showing the date range that’s the criterion for the report. In a Group Header, a text box might be used to display a heading for the group. The possibilities are endless because a text box can hold any valid expression.
To add a text box to a report, select the Text Box tool from the ribbon. Click and drag the text box to place it on the report. You can also add a text box to a report by dragging a field from the field list to a report. This works as long as the field’s Display control property is a text box.
Lines
You can use lines to visually separate objects on your report. For example, you can place a line at the bottom of a section or underneath a subtotal. To add a line to a report, click the Line tool to select it; then click and drag to place the line on your report. When added, the line has several properties that you can modify to customize its look.
Tip
To make sure that the line you draw is perfectly straight, hold down the Shift key while you click and drag to draw the line.
Rectangles
You can use rectangles to visually group items that logically belong together on the report. You can also use them to make certain controls on your report stand out. I often draw rectangles around important subtotal or grand total information that I want to make sure that the report’s reader notices.
To add a rectangle to a report, select the Rectangle tool from the ribbon; then click and drag to place the rectangle on the report.
Caution
The rectangle might obscure objects that have already been added to the report. To rectify this problem, you can set the rectangle’s Back Style property to Transparent. This setting is fine unless you want the rectangle to have a background color. If so, choose Send to Back on the Arrange tab to layer the objects so that the rectangle lies behind the other objects on the report.
Bound Object Frames
Bound object frames let you display the data in object linking and embedding (OLE) fields, which contain objects from other applications, such as pictures, spreadsheets, and word processing documents.
To add a bound object frame to a report, click the Bound Object Frame tool in the Ribbon; then click and drag the frame onto the report. Set the Control Source property of the frame to the appropriate field. You can also add a bound object frame to a report by dragging and dropping an OLE field from the field list onto the report.
Unbound Object Frames
You can use unbound object frames to add logos and other pictures to a report. Unlike bound object frames, however, they aren’t tied to underlying data.
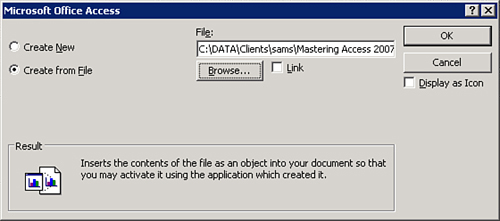
To add an unbound object frame to a report, click the Unbound Object Frame tool in the Controls group on the Design tab of the ribbon. Click and drag the object frame to place it on the report. This opens the Insert Object dialog box, shown in Figure 6.13, which you use to create a new OLE object or insert an existing OLE object from a file on disk. If you click Create from File, the Insert Object dialog box changes to look like Figure 6.14. Click Browse and locate the file you want to include in the report. The Insert Object dialog box gives you the option of linking to or embedding an OLE object. If you select Link, a reference is created to the OLE object. Only the bitmap of the object is stored in the report, and the report continues to refer to the original file on disk. If you don’t select Link, the object you select is copied and embedded in the report and becomes part of the Access ACCDB file; no link to the original object is maintained.
Figure 6.13. Use the Insert Object dialog box to insert a new or existing object into an unbound object frame.

Figure 6.14. The Insert Object dialog box with Create from File selected.
Using an image control rather than an unbound object frame is usually preferable for static information like a logo because the image control requires fewer resources than an unbound object frame does. Image controls are covered in the next section.
Image Controls
Image controls are your best option for displaying static images, such as logos, on a report (see Figure 6.15). You can modify an unbound object after it is placed on a report, but you can’t open the object application and modify an image when it’s placed on a report. This limitation, however, means far fewer resources are needed, so performance improves noticeably.
Figure 6.15. A report with an image control.

Other Controls
As mentioned in a previous section, it’s standard to include mostly labels and text boxes on your reports, but you can add other controls when appropriate. To add any other type of control, click to select the control; then click and drag to place it on the report.
What Report Properties Are Available, and Why Should You Use Them?
Reports have many different properties that you can modify to change how the report looks and performs. Like Form properties, Report properties are divided into categories: Format, Data, Event, and Other. To view a report’s properties, first select the report, rather than a section of the report, in one of two ways:
- Click the Report Selector, which is the small gray button at the intersection of the horizontal and vertical rulers.
- Select Report from the drop-down in the property sheet.
After you have selected a report, you can view and modify its properties.
Working with the Property Sheet
When you select the report, the property sheet shows all the properties associated with the report. To select the report and open the property sheet at the same time, double-click the Report Selector. A report has numerous properties available on the property sheet (additional properties are available only from code) broken down into the appropriate categories in the property sheet. Forty of the properties relate to the report’s format, data, and other special properties; the remaining properties relate to the events that occur when a report is run. The format, data, and other properties are covered here, and the event properties are covered in Chapter 11.
The Report’s Format Properties
A report has the following Format properties for changing the report’s physical appearance:
Caption—TheCaptionproperty of the report is the text that appears in the Report window’s title bar when the user is previewing the report. You can modify it at runtime to customize it for a particular situation.Default View—TheDefault Viewproperty of the report determines whether a report automatically opens in Report view or Print Preview.Allow Report View—TheAllow Report Viewproperty of the report determines whether a user can switch to Report view. TheAllow Layout Viewproperty of the report determines whether a user can switch to Layout view.Auto Resize—TheAuto Resizeproperty was introduced with Access 2002. This setting determines whether a report is resized automatically to display all the data on the report.Auto Center—TheAuto Centerproperty was introduced with Access 2002. You use theAuto Centerproperty to designate whether you want the Report window to automatically be centered on the screen.Fit to Page—TheFit to Pageproperty of the report determines whether the report will expand to fit a page.Page Header,Page Footer—ThePage HeaderandPage Footerproperties determine on what pages these sections appear. The options areAll Pages,Not with Rpt Hdr,Not with Rpt Ftr, andNot with Rpt Hdr/Ftr. Because you might not want the Page Header or Page Footer to print on the Report Header or Report Footer pages, these properties give you control over where those sections print.Grp Keep Together—In Access, you can keep a group of data together on the same page by using theGrp Keep Togetherproperty. ThePer Pageoption forces the group of data to remain on the same page, and thePer Columnoption forces the group of data to remain within a column. A group of data refers to all the data within a report grouping (for example, all the customers in a city).Border Style—TheBorder Styleproperty was introduced with Access 2002 reports. Like its form counterpart, it is far more powerful than its name implies. The options for theBorder Styleproperty areNone,Thin,Sizable, andDialog. A border style set toNonemeans the report has no border. AThinborder is not resizable; the Size command isn’t available in the Control menu. This setting is a good choice for pop-up reports, which remain on top even when other forms or reports are given the focus. ASizableborder is standard for most reports. It includes all the standard options in the Control menu. ADialogborder looks like aThinborder. A report with a border style ofDialogcan’t be maximized, minimized, or resized. After the border style of a report is set toDialog, the Maximize, Minimize, and Resize options aren’t available in the report’s Control menu.Control Box—TheControl Boxproperty was introduced with Access 2002 as well. This property lets you specify whether the Report window under print preview has the Control menu available. The Control menu, which you activate by clicking the icon in the upper-left corner of a window, displays options for manipulating the window—Restore, Move, Size, Minimize, Maximize, and Close.Min Max Buttons—TheMin Max Buttonsproperty was also introduced with Access 2002. This property lets you specify whether the Minimize and/or Maximize options should be available from the Control menu for the Report window in Print Preview mode. You can select fromNone,Min Enabled,Max Enabled, orBoth Enabled.Close Button—TheClose Buttonproperty was also introduced with Access 2002. This setting specifies whether to enable or disable the Close button on the Print Preview window.Width—TheWidthproperty specifies the width of the report sections.Picture,Picture Type,Picture Size Mode,Picture Alignment,Picture Tiling, andPicture Pages—The background of a report can be a picture. ThePictureproperties determine what picture is used as a background for the report and what attributes are applied to it.Show Page Margins—TheShow Page Marginsproperty determines whether the margins appear in Report view.Grid X/Grid Y—TheGrid XandGrid Yproperties determine the density of the gridlines in the Report Design window. The number shown is the number of subdivisions per unit of measure.Layout for Print—TheLayout for Printproperty specifies whether screen or printer fonts are used in the report. If you want to optimize reports for preview, selectNo; if you want to optimize reports for the printer, selectYes. This option is not as important if you select TrueType fonts because TrueType fonts usually print equally well to the screen and printer.Palette Source—ThePalette Sourceproperty determines the source for the report’s selectable color.Orientation—TheOrientationproperty enables you to take advantage of language-specific versions of Microsoft Access, such as Arabic. You can set this property to support right-to-left display features for these language-specific editions of Access.Moveable—TheMoveableproperty determines whether the user can move the Report window around the screen by clicking and dragging the report by its title bar.
The Report’s Data Properties
A report has the following six Data properties used to supply information about the data underlying the report:
Record Source—Specifies the table or query whose data underlies the report. You can modify the record source of a report at runtime. This aspect of theRecord Sourceproperty makes it easy for you to create generic reports that use different record sources in different situations.Filter—Allows you to open the report with a specific filter set. I usually prefer to base a report on a query rather than apply a filter to it. At other times, it’s more appropriate to base the report on a query but then apply and remove a filter as required, based on the report’s runtime conditions.Filter On Load—Determines whether a report filter is applied. If the value of this property is set toNo, theFilterproperty of the report is ignored.Order By—Determines how the records in a report are sorted when the report is opened.Allow Filters—Determines whether the user will be able to filter report data.Order By On Load—Determines whether the sort is applied when the report first loads.
The Other Report Properties
A report has 16 Other properties; these miscellaneous properties, explained here, allow you to control other important aspects of the report:
Record Locks—Determines whether the tables used in producing the report are locked while the report is being run. The two values for this property areNo LocksandAll Records.No Locksis the default value; it means that no records in the tables underlying the report are locked while the report is being run. Users can modify the underlying data as the report is run, which can be disastrous when running sophisticated reports. Users can change the data in the report as the report is being run, which would make figures for totals and percent of totals invalid. Although theAll Recordsoption for this property locks all records in all tables included in the report (thereby preventing data entry while the report is being run), it might be a necessary evil for producing an accurate report.Display on SharePoint Site—Determines whether the report will appear on the SharePoint site.Date Grouping—Determines how grouping of dates occurs in your report. TheUS Defaultsoption means that Access uses United States’ defaults for report groupings; therefore, Sunday is the first day of the week, the first week begins January 1, and so on. TheUse System Settingsoption means that date groupings are based on the locale set in the Control Panel’s Regional and Language Options rather than on U.S. defaults.Pop Up—Determines whether the report’s print preview window opens as a pop-up window. Within Microsoft Access, pop-up windows always remain on top of other open windows.Modal—Instructs Access to open the Report window in a modal or modeless state. The default isNo, meaning that the window will not be opened as modal. A modal window retains the application program’s focus until the window receives the appropriate user input that it requires.Menu Bar—Allows you to associate a custom menu bar with the report that’s visible when the user is previewing the report. Adding a custom menu to your report lets you control what the user can do while the report is active.Toolbar—Lets you associate a custom toolbar with the report that’s visible when the user is previewing the report.Shortcut Menu Bar—Determines what shortcut menu is associated with the report while the report is being previewed. The shortcut menu bar appears when the user clicks the right mouse button over the Preview window.Ribbon Name—Designates the ribbon that appears when the report is the active object.Fast Laser Printing—Determines whether lines and rectangles are replaced with text character lines when you print a report with a laser printer. If fast printing is your objective and you’re using a laser printer, you should set this property toYes.Use Default Paper Size—Determines whether the report follows the default paper size.Cycle—Determines how the Tab key cycles. This feature is more applicable to forms than it is to reports.Help File,Help Context Id—Let you associate a help file and help topic with the report.Tag—Stores information defined by the user at either design time or runtime. TheTagproperty is Microsoft Access’s way of giving you an extra property. Access makes no use of this property; if you don’t take advantage of it, it will never be used.Has Module—Determines whether the report contains an associated class module. If no code will be included in the report, eliminating the class module can both improve performance and reduce the size of the application database. A report without a class module is considered a “lightweight object,” which loads and displays faster than an object with an associated class module.
Caution
A couple of the Has Module property’s behaviors deserve special attention. When a report is created, the default value for the Has Module property is No. Access automatically sets the Has Module property to Yes as soon as you try to view a report’s module. If you set the Has Module property of an existing report to No, Access asks if you want to proceed. If you confirm the change, Access deletes the object’s class module and all the code it contains!
What Control Properties Are Available, and Why Should You Use Them?
Just as reports have properties, so do controls. You can change most control properties at design time or at runtime, allowing you to easily build flexibility into your reports. For example, certain controls are visible only when specific conditions are true.
The Control’s Format Properties
You can modify several formatting properties of the selected objects using the ribbon. If you prefer, you can set all the properties in the property sheet. The following are most of the Format properties of a report control:
Format—Determines how the data in the control is displayed. This property is automatically inherited from the underlying field. If you want the control’s format on the report to differ from the underlying field’s format, you must set theFormatproperty of the control.Caption—Specifies the text displayed for labels and command buttons. A caption is a string containing up to 2,048 characters.Hyperlink Address—Is a string representing the path to a UNC (network path) or URL (web page). The Hyperlink control, command buttons, image controls, and labels all contain theHyperlink Addressproperty.Hyperlink SubAddress—Is a string representing a location within the document specified in theHyperlink Addressproperty. The Hyperlink control, command buttons, image controls, and labels all contain theHyperlink SubAddressproperty.Decimal Places—Defines the number of decimal places displayed for numeric values.Visible—Determines whether a control is visible. In many cases, you will want to toggle the visibility of a control in response to different situations.Hide Duplicates—Hides duplicate data values in a report’s Detail section. Duplicate data values occur when one or more consecutive records in a report contain the same value in one or more fields.Can Grow,Can Shrink—Allows a control to expand vertically to accommodate all the data in it when theCan Growproperty is set toYes. TheCan Shrinkproperty eliminates blank lines when no data exists in a field for a particular record. For example, if you have a second address line on a mailing label, but there’s no data in theAddress2field, you don’t want a blank line to appear on the mailing label.Left,Top,Width,Height—Set the size and position of the controls on a report.Back Style,Back Color—Enables you to set theBack Styleproperty toNormalorTransparent. When this property is set toTransparent, the color of the report shows through to the control. When it is set toNormal, the control’sBack Colorproperty determines the object’s color.Special Effect—Adds 3D effects to a control.Border Style,Border Color,Border Width—Set the physical attributes of a control’s border.Fore Color—Sets the color of the text within the control.Font Color,Font Name,Font Size,Font Weight,Font Italic,Font Underline—Affect the appearance of the text within the control, unlike the border properties, which affect the control’s border.Text Align—Sets the alignment of the text within the control. It can be set toLeft,Center,Right, orDistribute. When set toDistribute, text is justified.Reading Order—Determines the visual order in which characters, words, and groups of words are displayed. This property is often used with language-specific editions of Microsoft Access, where the reading order needs to be changed. The default setting isContext;Left-to-RightandRight-to-Leftare the other available settings.Scroll Bar Align—Specifies the visual placement of the control’s vertical scrollbars and buttons. This property also works in conjunction with language-specific versions of Access to determine scrollbar placement in either the right-to-left or left-to-right direction. The default setting isSystem, which lets the operating system determine the scrollbar alignment.Numeral Shapes—Determines the format for displaying numeric characters. This property also works in conjunction with language-specific versions of Access to determine the type of numeric character to display. The default setting isSystem, which lets the operating system determine the numeric character display format. The other settings includeArabic,National, andContext.Left Margin,Top Margin,Right Margin,Bottom Margin—Determine how far the text within the control prints from the left, top, right, and bottom of the control. These properties are particularly useful for large controls containing a lot of text, such as a memo or an invoice.Line Spacing—Controls the spacing between lines of text within a control. TheLine Spacingproperty is designated in inches.Gridline Styles,Color, andWidth—Determine the style of the top, bottom, left, and right gridline, as well as the gridline color and width.Top,Bottom,Left, andRight Padding—Determine the amount of space between the gridline and the text within the control.Is Hyperlink—Determines whether the text within the control is displayed as a hyperlink. If theIs Hyperlinkproperty is set toYes, and the text within the control is a relevant link, the text will serve as a hyperlink. (This property is useful only if you save the report in HTML format.)Display as Hyperlink—Determines whether the data in a text box displays on the screen only, always (regardless of whether it is a hyperlink), or only if it is a hyperlink.
The Control’s Data Properties
The Data properties of a control specify information about the data underlying a particular report control.
Control Source—Specifies the field in the report’s record source that’s used to populate the control. A control source can also be a valid expression.Input Mask—Assigns specific formatting to any data that is entered into a particular control. For example, you could useInput Mask !(999) 000-0000to format the data entered as a phone number.Text Format—Determines whether Access stores your text as plain text or as rich text.Running Sum—Calculates a record-by-record or group-by-group total. TheRunning Sumproperty, which is unique to reports, is quite powerful. It can be set toNo,Over Group, orOver All. When it is set toOver Group, the value of the text box accumulates from record to record within the group but is reset each time the group value changes. An example is a report that shows deposit amounts for each state with a running sum for the amount deposited within the state. Each time the state changes, the amount deposited is set to zero. When it is set toOver All, the sum continues to accumulate over the entire report.
The Other Control Properties
The Other properties of a control designate properties that don’t fit into any other category, such as the following:
Name—TheNameproperty gives you an easy and self-documenting way to refer to the control in VBA code and in many other situations. You should name all your controls. Naming conventions for report controls are the same as those for form controls. Refer to Appendix A, “Naming Conventions,” which is available for download at www.samspublishing.com, for more detailed information.Vertical—TheVerticalproperty is used to determine whether the text within the control is displayed vertically. The default value for this property isNo.Tag—Like theTagproperty of a form, theTagproperty of a control gives you a user-defined slot for the control. You can place any extra information in theTagproperty.
Caution
A common mistake many developers make is giving controls names that conflict with Access names. This type of error is very difficult to track down. Make sure you use distinctive names for both fields and controls. Furthermore, don’t give a control the same name as the name of a field within its expression. For example, the expression =ClientName & Title shouldn’t have the name ClientName; that would cause an #error# message when the report is run. Finally, don’t give a control the same name as its control source. Access gives bound controls the same name as their fields, so you need to change them to avoid problems. Following these simple warnings will spare you a lot of grief!
Inserting Page Breaks
Page breaks can be set to occur before, within, or at the end of a section. The way you set each type of page break is quite different. To set a page break within a section, you must use the Insert or Remove Page Break tool on the Design tab of the ribbon. After you click this tool, click the report where you want the page break to occur. To set a page break before or after a section, set the Force New Page property of the section to Before Section, After Section, or Before & After. The Force New Page property applies to Group Headers, Group Footers, and the report’s Detail section.
Caution
Be careful not to place a page break within a control on the report. The page break will occur in the middle of the control’s data.
Using Unbound, Bound, and Calculated Controls
You can place three types of controls on a report: Unbound, Bound, and Calculated. Unbound controls, such as logos placed on reports, aren’t tied to data. Bound controls are tied to data within a field of the table or query underlying the report. Calculated controls contain valid expressions; they can hold anything from a page number to a sophisticated financial calculation. Most complex reports have a rich combination of Unbound, Bound, and Calculated controls.
Using Expressions to Enhance Your Reports
Calculated controls use expressions as their control sources. To create a Calculated control, you must first add an Unbound control to the report. You must precede expressions with an equal sign (=); an example of a report expression is =Sum([BillableHours]). This expression, if placed in the Report Footer, totals the contents of the BillableHours control for all detail records in the report. You can build an expression by typing it directly into the control source or by using the Expression Builder, covered in Chapter 5.
Building Reports Based on More Than One Table
The majority of reports you create will probably be based on data from more than one table. The reason is that a properly normalized database usually requires that you bring table data back together to give your users valuable information. For example, a report that combines data from a Customers table, an Orders table, an Order Details table, and a Product table can supply the following information:
- Customer information—Company name and address
- Order information—Order date and shipping method
- Order detail information—Quantity ordered and price
- Product table—Product description
You can base a multitable report directly on the tables whose data it displays or on a query that has already joined the tables, providing a flat table structure.
Creating One-to-Many Reports
You can create one-to-many reports by using a Report Wizard, or you can build reports from scratch. Different situations require different techniques, some of which are covered in the following sections.
Building a One-to-Many Report with the Report Wizard
Building a one-to-many report with the Report Wizard is quite easy; just follow these steps:
- Click to select the Create tab and then select the Report Wizard tool in the Reports group. The Report Wizard launches.
- Use the Tables/Queries drop-down list to select the first table or query whose data will appear on the report.
- Select the fields you want to include from that table.
- Select each additional table or query you want to include on the report, selecting the fields you need from each. Click Next.
- Step 2 of the Report Wizard offers a suggested layout for your data (see Figure 6.16). You can accept Access’s suggestion, or you can choose from any of the available layout options. After you choose a layout, click Next.
Figure 6.16. Step 2 of the Report Wizard: selecting a layout.

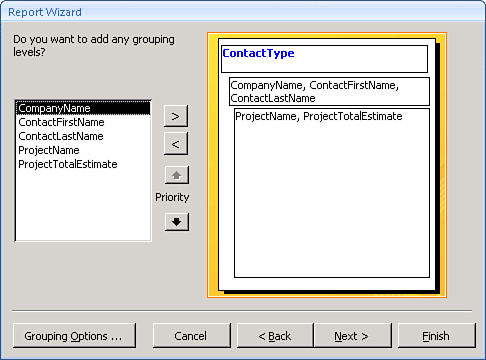
- Step 3 of the Report Wizard asks whether you want to add any grouping levels. Grouping levels can be used to visually separate data and to provide subtotals. In the example in Figure 6.17, the report is grouped by
ContactType. After you select grouping levels, click Next.Figure 6.17. Step 3 of the Report Wizard: selecting groupings.
- Step 4 of the Report Wizard lets you select how you want the records in the report’s Detail section to be sorted (see Figure 6.18). This step of the wizard also allows you to specify any summary calculations you want to perform on the data (see Figure 6.19). Click the Summary Options button to specify the summary calculations. Using the button, you can even opt to include the percent of total calculations. Make your selection and click OK to close the Summary Options dialog.
Figure 6.18. Step 4 of the Report Wizard: selecting a sort order.
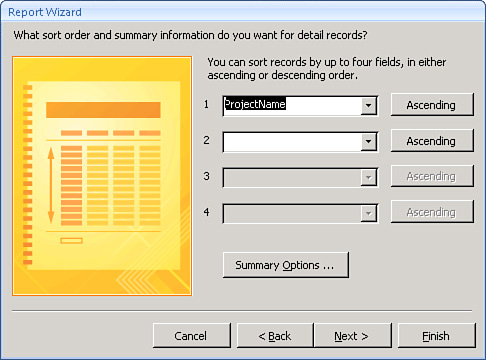
Figure 6.19. Adding summary calculations.

- In step 5 of the Report Wizard, you select the layout and orientation of your report. Layout options include Stepped, Blocked, Outline 1, Outline 2, Align Left 1, and Align Left 2. Click Next to continue.
- Step 6 of the Report Wizard lets you select from predefined styles for your report. You can preview each style to see what it looks like. Click Next to continue.
- In step 7 of the Report Wizard, you select a title for your report. The title also becomes the name for the report. I like to select an appropriate name and change the title after the wizard is finished. The final step also allows you to determine whether you want to immediately preview the report or to see the report’s design first. Click Finish after making your selection.
The report created in the preceding example is shown in Figure 6.20. Notice that the report is sorted and grouped by ContactType and CompanyName. The report’s data is in order by ProjectName within a CompanyName grouping.
Figure 6.20. A completed one-to-many report.

This method of creating a one-to-many report is by far the easiest. In fact, the “background join” technology that the wizards use when they allow you to pick fields from multiple tables—figuring out how to build the complex queries needed for the report or form—is one of Access’s strong points. It’s a huge timesaver and helps hide unnecessary complexity from you as you build a report. Although you should take advantage of this feature, it’s important that, as a developer, you know what’s happening under the covers. The following two sections give you this necessary knowledge.
Building a Report Based on a One-to-Many Query
Another popular method of building a one-to-many report is to use a one-to-many query. A one-to-many report built in this way is constructed as though it were based on the data within a single table. First, you build the query that will underlie the report (see Figure 6.21).
Figure 6.21. An example of a query underlying a one-to-many report.

After you have finished the query, you can select it rather than select each individual table (as done in the preceding section). After you select the query, you use the same process to create the report as you used for the previous report.
Building a One-to-Many Report with the Subreport Wizard
You can also create a one-to-many report by building the parent report and then adding a SubForm/SubReport control. This is often the method used to create reports such as invoices that show the report’s data in a one-to-many relationship rather than in a denormalized format (as shown in Figure 6.20). If you want to use the SubForm/SubReport Wizard, you must make sure that you select the Control Wizards tool before you add the SubForm/SubReport control to the main report. Here is the process:
- Click to select the SubForm/SubReport control tool.
- Click and drag to place the SubForm/SubReport control on the main report. You will usually place the SubForm/SubReport control in the report’s Detail section. After you place the SubForm/SubReport control on the report, the SubForm/SubReport Wizard is invoked.
- Indicate whether you want the subreport to be based on an existing report or form or you want to build a new subreport based on a query or table (see Figure 6.22). Click Next.
Figure 6.22. The SubForm/SubReport Wizard: indicating whether you want to base the subreport on an existing report or on a query or table.

- If you select a table or query, you have to select the table or query on which the subreport will be based. You can then select the fields you want to include on the subreport (see Figure 6.23). You can even select fields from more than one table or query. When you’re finished, click Next.
Figure 6.23. The SubForm/SubReport Wizard: indicating the fields that you want to include in the subreport.

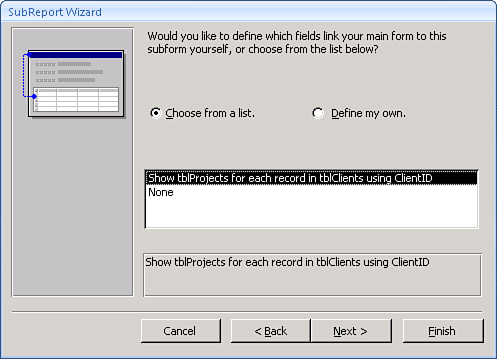
- The next step of the SubForm/SubReport Wizard suggests a relationship between the main report and the subreport (see Figure 6.24). You can accept the selected relationship, or you can define your own. When you’re finished, click Next.
Figure 6.24. The SubForm/SubReport Wizard: identifying the relationship.
- The final step of the SubReport Wizard asks you to name the subreport. To follow standards, the name should begin with the prefix rsub. Click Finish when you’re finished.
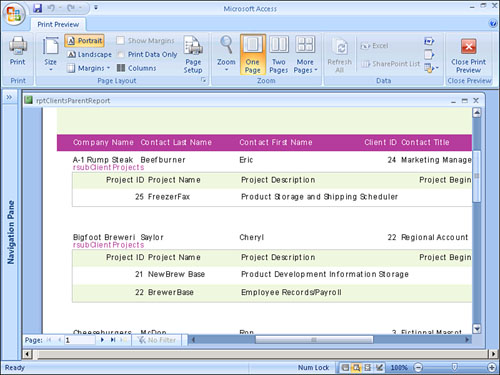
As you can see in Figure 6.25, the one-to-many relationship between two tables is clearly highlighted by this type of report. In the example, each customer is listed. All the detail records reflecting the projects for each customer are listed immediately following each customer’s data.
Figure 6.25. A completed one-to-many report created with the SubForm/SubReport Wizard.
Working with Subreports
When a subreport has been added to a report, it’s important to understand what properties have been set by the SubReport Wizard so that you can modify the SubReport control, if needed. You should become familiar with a few properties of a subreport:
Source Object—Enables you to indicate the name of the report or other object that’s being displayed within the control.Link Child Fields—Enables you to indicate the fields from the child report that link the child report to the master report.Link Master Fields—Enables you to indicate the fields from the master report that link the master report to the child report.Can Grow—Determines whether the control can expand vertically to accommodate data in the subreport.Can Shrink—Determines whether the control can shrink to eliminate blank lines when no data is found in the subreport.
You should not only know how to work with the properties of a SubReport object but also be able to easily modify the subreport from within the main report. You can always modify the subreport by selecting it within the list of reports in the Navigation Pane. To do this, click the report you want to modify; then click Design. You can also modify a subreport by selecting its objects directly within the parent report.
Tip
Access 2007 makes it easy to work with subforms and subreports in Design view. Scrolling has been improved so that it’s easier to design subforms and subreports. In addition, you can open a subreport in its own separate Design view window by right-clicking the subreport and selecting Subreport in New Window. Alternatively, instead of right-clicking the subreport, you can select the subreport and then click Subreport in New Window on the Design tab of the ribbon.
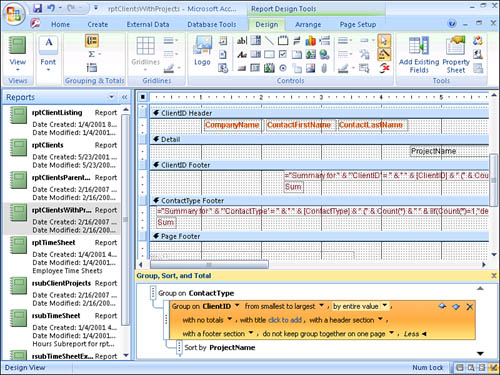
Working with Sorting and Grouping
As opposed to sorting within forms, sorting the data within a report isn’t determined by the underlying query. In fact, the underlying query affects the report’s sort order only when no sort order has been specified for the report. Any sort order specified in the query is completely overwritten by the report’s sort order, which is determined by the report’s Sorting and Grouping window (see Figure 6.26). The sorting and grouping of the report is affected by what options you select when you run a Report Wizard. You can use the Sorting and Grouping window to add, remove, or modify sorting and grouping options for the report. Sorting simply affects the order of the records on the report. Grouping adds Group Headers and Footers to the report.
Figure 6.26. The Sorting and Grouping window, showing grouping by contact type and ClientID.

Adding Sorting or Grouping
Often, you want to add sorting or grouping to a report. To do so, follow these four steps:
- Click the Group and Sort tool, found in the Grouping & Totals group on the Design tab. The Group, Sort, and Total window appears.
- Click the Add a Group tool within the Group, Sort, and Total window. All the fields found on the report appear in a list box (see Figure 6.27).
Figure 6.27. Inserting a grouping level.

- Select a field in the list.
- Click the More button to view additional grouping options (see Figure 6.28). They include whether you want to sort from smallest to largest or largest to smallest; whether you want to group by the entire value or by a portion of it; whether you want totals for the grouping level; whether you want a header section, a footer section, or both; and finally how you want the data grouped on a page.
Figure 6.28. When you click More, you can determine the specifics of the grouping.
Note
To remove a sorting or grouping that you have added, click to select the Group on or Sort by expression that you want to delete. Click the X found to the right of the selection band. Access warns you that any controls in the Group Header or Footer will be deleted (see Figure 6.29). Click Yes if you want to complete the process.
Figure 6.29. When you delete a group, Access deletes the Group Header and Footer associated with that group.

Note
To sort the report data within a group, click the Add a Sort button. As with the Add a Group button, Access displays a list of available fields. After you make your selection, Access adds that sort to the report.
What Are Group Header and Footer Properties, and Why Should You Use Them?
Each Group Header and Footer has its own properties that determine the behavior of the Group Header or Footer:
Force New Page—TheForce New Pageproperty can be set toNone,Before Section,After Section, orBefore & After. When it is set toNone, no page break occurs either before or after the report section. If it is set toBefore Section, a page break occurs before the report section prints; if it is set toAfter Section, a page break occurs after the report section prints. When this property is set toBefore & After, a page break occurs before the report section prints as well as after it prints.New Row or Col—TheNew Row or Colproperty determines whether a column break occurs whenever the report section prints. This property applies only to multicolumn reports. The choices areNone,Before Section,After Section, andBefore & After. Like theForce New Pageproperty, this property determines whether the column break occurs before the report section prints, after it prints, or before and after, or whether it’s affected by the report section break at all.Keep Together—TheKeep Togetherproperty specifies whether you want Access to try to keep an entire report section together on one page. If this property is set toYes, Access starts printing the section at the top of the next page if it can’t print the entire section on the current page. When this property is set toNo, Access prints as much of the section as possible on the current page, inserting each page break as necessary. If a section exceeds the page length, Access starts printing the section on a new page and continues printing it on the following page.Visible—TheVisibleproperty indicates whether the section is visible. It’s common to hide the visibility of a particular report section at runtime in response to different situations. You can easily do this by changing the value of the report section’sVisibleproperty with VBA code, usually on theFormatevent.Can Grow,Can Shrink—TheCan Growproperty determines whether the section stretches vertically to accommodate the data in it. TheCan Shrinkproperty specifies whether you want the section to shrink vertically, eliminating blank lines.Repeat Section—TheRepeat Sectionproperty is a valuable property because it lets you specify whether the group header is repeated on subsequent pages if a report section needs more than one page to print.
Improving Performance and Reusability by Basing Reports on Stored Queries or Embedded SQL Statements
Basing your Access reports on stored queries offers you two major benefits:
- The query underlying the report can be used by other forms and reports.
- Sophisticated calculations need to be built only once; they don’t need to be re-created for each report (or form).
With earlier versions of Access, reports based on stored queries opened faster than reports based on embedded SQL statements. The reason is that, when you build and save a query, Access compiles and creates a query plan. This query plan is a plan of execution that’s based on the amount of data in the query’s tables as well as all the indexes available in each table. In earlier versions of Access, if you ran a report based on an embedded SQL statement, the query was compiled, and the query plan was built at runtime, slowing the query’s execution. With Access 2002, Access 2003, and Access 2007, query plans are built for embedded SQL statements when the form or report is saved. Query plans are stored with the associated form or report.
So what are the benefits of basing a report on a stored query instead of an embedded SQL statement? Often, you want to build several reports and forms all based on the same information. An embedded SQL statement can’t be shared by multiple database objects. At the very least, you must copy the embedded SQL statement for each form and report you build. Basing reports and forms on stored queries eliminates this problem. You build the query once and modify it once if changes need to be made to it. Many forms and reports can all use the same query (including its criteria, expressions, and so on).
Reports often contain complex expressions. If a particular expression is used in only one report, nothing is lost by building the expression into the embedded SQL statement. On the other hand, many complex expressions are used in multiple reports and forms. By building these expressions into queries on which the reports and forms are based, you have to create the expression only one time.
Tip
You can easily save an embedded SQL statement as a query. This allows you to use the Report Wizard to build a report using several tables; you can then save the resulting SQL statement as a query. With the report open in Design view, bring up the property sheet. Click the Data tab, click on the Record Source property, and then click the ellipsis. The embedded SQL statement appears as a query. Click Save As on the Design tab of the ribbon, enter a name for the query, and click OK. Close the Query window, indicating that you want to update the Record Source property. Your query is now based on a stored query instead of an embedded SQL statement.
Although you can see that basing reports on stored queries offers several benefits, it has its downside as well. If your database contains numerous reports, the database container becomes cluttered with a large number of queries that underlie those reports. Furthermore, queries and the expressions within them are often very specific to a particular report. If that is the case, you should opt for embedded SQL statements rather than stored queries.
Using Access Reports and the Internet
Microsoft makes it easy to develop Internet-aware applications by adding hyperlinks to reports and by allowing you to save an Access report as an HTML document. These features are covered in the following sections.
Adding a Hyperlink to a Report
You can add hyperlinks to reports in the form of labels. When added, they serve as a direct link to a UNC or URL. To add a hyperlink to a report, follow these steps:
- With the report open in Design view, add a label to the report.
- Set the
Hyperlink Addressproperty to the UNC or URL you want to link to. The easiest way to do this is to click in theHyperlink Addressproperty; then click the ellipsis to open the Insert Hyperlink dialog box. - With Existing File or Web Page selected as the Link To, you can enter a file path or URL in the text box or click Current Folder to locate a file or web page in the current folder. You can also click to insert hyperlinks to Browsed Pages or Recent Files. With Object in This Database selected as the Link To, you can link to an object in the current database.
- If you want to enter a
Hyperlink SubAddress, click Bookmark. The Hyperlink SubAddress can be a range name, bookmark, slide number, or any other recognized location in the document specified in the Link to File or URL combo box. - Click OK. The
Hyperlink AddressandHyperlink SubAddressproperties are filled in with the information supplied in the Insert Hyperlink dialog box.
The Hyperlink Address and Hyperlink SubAddress properties apply when the report is in Report view (not Print Preview). They also come into play only when a report is saved as HTML and viewed in a web browser, such as Internet Explorer 7.0. Saving a report as an HTML document is covered in the following section.
Note
Attached labels (those associated with a text box) do not have HyperLink Address or HyperLink SubAddress properties.
Saving a Report as HTML
To save a report as HTML, right-click the report in the Navigation Pane and select HTML Document from the More drop-down on the External Data tab of the ribbon. The Export – HTML Document dialog box appears. Pick a location and name for the file and whether you want to open the destination file after the export completes. Then click OK. Designate the HTML Output Options. Click OK when you are finished. The document is saved as HTML and assigned the name and location you specified.
Saving a Report as XML
To save a report as XML, right-click the report in the Navigation Pane and select XML File. The Export – XML File dialog box appears. Pick a location and name for the file. Then click OK. Designate the Export XML Options. Click OK when you are finished. The document is saved as XML and assigned the name and location you specified. Saving reports as XML is covered in detail in Alison Balter’s Mastering Access 2002 Enterprise Development.
Understanding Report Specifications and Limitations
Reports have a number of specifications and limitations that you should be aware of, and Table 6.1 lists them. Fortunately, you will generally not find them too restricting.
Table 6.1. Report Specifications and Limitations

Practical Examples: Building Reports Needed for Your Application
The sample application requires several reports. A couple of the simpler ones are built here.
Designing the rptClientListing Report
The rptClientListing report lists all the clients in the tblClients table. The report includes the company name, contact name, intro date, default rate, and term type of each customer. The report is grouped by contact type and sorted by company name. It provides the average default rate by contact type and overall.
The rptClientListing report is based on a query called qryClientListing, which is shown in Figure 6.30. The query includes the CompanyName, IntroDate, and DefaultRate fields from the tblClients table. It joins the tblClients table to the tblContactType table to obtain the ContactType field from tblContactType and joins the tblClients table to the tblTerms table to obtain the TermType field from the tblTerms table. It also includes an expression called ContactName that concatenates the ContactFirstName and ContactLastName fields. The expression looks like this:
ContactName: [ContactFirstName] & " " & [ContactLastName]
Figure 6.30. The qryClientListing query—a foundation for the rptClientListing report.

To build the report, follow these steps:
- Click the Report Wizard tool in the Reports group on the Create tab.
- Use the drop-down list to select the
qryClientListingquery (see Figure 6.31).Figure 6.31. Selecting the
qryClientListingquery.
- Click the >> button to designate that you want to include all the fields in the query within the report. Click Next.
- Indicate that you want to view your data by
tblContactType. Click Next. - Do not add any grouping to the report. Click Next.
- Use the drop-down list to select
CompanyNameas the sort field (see Figure 6.32).Figure 6.32. Selecting
CompanyNameas the sort field.
- Click Summary Options and click the Avg check box to add the average default rate to the report. Click OK to close the Summary Options dialog box and click Next to proceed to the next step of the wizard.
- Select Landscape for the Orientation and click Next.
- Select a style for the report and click Next.
- Give the report the title
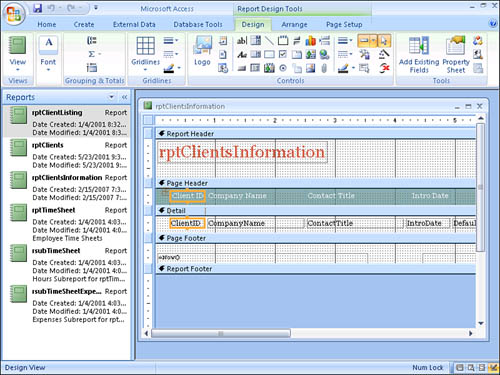
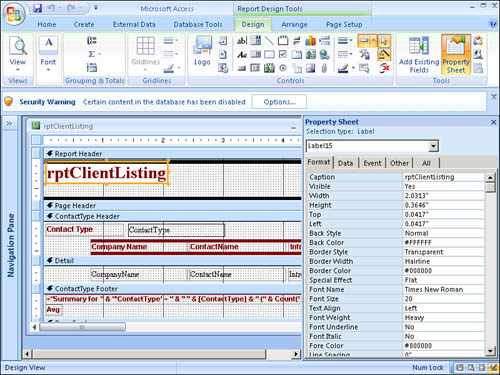
rptClientListing; then click Finish. - The completed report should look like Figure 6.33. Click Design to open the report in Design view. Notice that both the name and title of the report are
rptClientListing(see Figure 6.34). Modify the title of the report so that it readsClient Listing by Contact Type and Company Name.Figure 6.33. A preview of the completed report.
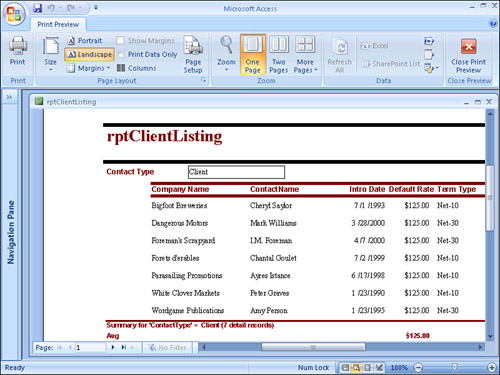
Figure 6.34. Changing the report title.
Designing the rptTimeSheet Report
The rptTimeSheet report is much more complex than the rptClientListing report. It includes two subreports: rsubTimeSheet and rsubTimeSheetExpenses.
The rptTimeSheet report is shown in Figure 6.35. It’s based on a query called qryTimeSheet (see Figure 6.36). It contains fields from both tblTimeCards and tblEmployees.
Figure 6.35. The rptTimeSheet report in Design view.

Figure 6.36. The qryTimeSheet query in Design view.

The rptTimeSheet report has a Page Header that includes the title of the report, but nothing else is found within the Page Header. The TimeCardID header contains the EmployeeName and DateEntered from the qryTimeSheet query. The report’s Detail section contains the two subreports rsubTimeSheet and rsubTimeSheetExpenses. The TimeCardID footer has a text box that contains the grand total of hours and expenses. The expression within the text box is
=[rsubTimeSheet].[Report]![txtTotalHourlyBillings]+[rsubTimeSheetExpenses]._
[Report]![txtTotalExpenseAmount]
The easiest way to build the expression is to use the Expression Builder.
The Page Footer holds two expressions, one for the date and another for the page number. They look like this:
=Now()
="Page " & [Page] & " of " & [Pages]
The rsubTimeSheet report is based on qrySubTimeSheet; this query contains the following fields from the tblProjects and tblTimeCardHours tables:
tblProjects: ProjectName
tblTimeCardsHours: TimeCardID, TimeCardDetailID, DateWorked, WorkDescription,_
BillableHours, BillingRate, and the expression HourlyBillings:_
[tblTimeCardHours].[BillingRate]*[BillableHours]
The design of rsubTimeSheet is shown in Figure 6.37. This subreport can easily be built from a wizard. Select all fields except TimeCardID and TimeCardDetailID from qrySubTimeSheets. View the data by tblTimeCardHours. Don’t add any groupings and don’t sort the report. When you’re finished with the wizard, modify the design of the report. Remove the caption from the Report Header and move everything from the Page Header to the Report Header. Collapse the Page Header, remove everything from the Page Footer, and add a Report Footer with the expression =Sum([HourlyBillings]).
Figure 6.37. The rsubTimeSheet report in Design view.

Change the format of the HourlyBillings and the TotalHourlyBillings controls to Currency. Use the Sorting and Grouping window to sort by TimeCardID and TimeCardDetailID.
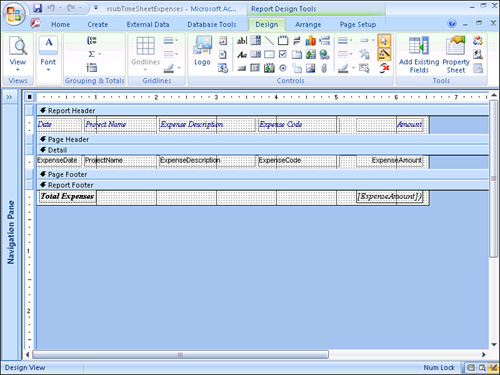
The rsubTimeSheetExpenses report is based on qrySubTimeSheetExpense, which contains the following fields from the tblProjects, tblExpenseCodes, and tblTimeCardExpenses tables:
tblProjects: ProjectName
tblTimeCardsExpenses: TimeCardID, TimeCardExpenseID, ExpenseDate,
ExpenseDescription, and ExpenseAmount
tblExpenseCodes: ExpenseCode
The design of rsubTimeSheetExpenses is shown in Figure 6.38. This subreport can easily be built from a wizard. Select all fields except TimeCardID and TimeCardExpenseID from qrySubTimeSheetExpense. View the data by tblTimeCardExpenses. Don’t add any groupings and don’t sort the report. When you’re finished with the wizard, modify the design of the report. Remove the caption from the Report Header and move everything from the Page Header to the Report Header. Collapse the Page Header, remove everything from the Page Footer, and add a Report Footer with the expression =Sum(ExpenseAmount).
Figure 6.38. The rsubTimeSheetExpenses report in Design view.
Change the format of the ExpenseAmount and the TotalExpenseAmount controls to Currency and use the Sorting and Grouping window to sort by TimeCardID and TimeCardExpenseID.
Summary
Reports give you valuable information about the data stored in your database. Many types of reports can be built in Access 2007, including Detail reports, Summary reports, reports that look like printed forms, and reports containing graphs and other objects. Access offers many properties for customizing the look and behavior of each report to fit your users’ needs. Understanding how to work with each property is integral to the success of your application-development projects. For more information about reports and their use, refer to Chapter 11.