
Chapter 11. Advanced Report Techniques
IN THIS CHAPTER
- Why This Chapter Is Important
- Events Available for Reports and When to Use Them
- Order of Events for Reports
- Events Available for Report Sections and When to Use Them
- Programmatically Manipulating Report Sections
- Taking Advantage of Special Report Properties
- Controlling the Printer
- Using Automatic Error Checking
- Propagating Field Properties
- Incorporating Practical Applications of Report Events and Properties
- Practical Examples: Practicing What You Learned
Why This Chapter Is Important
Chapter 6, “What Every Developer Needs to Know About Reports,” covers all the basics of report design. Reports are an integral part of almost every application, so fortunately for you, the Access 2007 report design tool is very powerful. Although it’s easy to create most reports, as you mature as an Access developer, you’ll probably want to learn the intricacies of Access report design. This chapter covers report events, advanced techniques, and tips and tricks of the trade.
Events Available for Reports and When to Use Them
Although report events aren’t as plentiful as form events, the report events you can trap for allow you to control what happens as your report runs. The following sections discuss report events, and the section “Events Available for Report Sections and When to Use Them” covers events specific to report sections.
The Open Event
The Open event is the first event that occurs in a report, before the report begins printing or displaying. In fact, it happens even before the query underlying the report is run. Listing 11.1 provides an example of using the Open event.
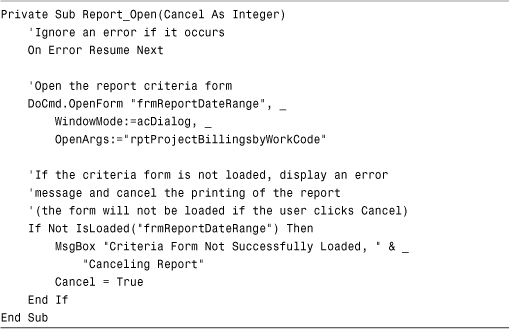
You can find this code in rptProjectBillingsByWorkCode in CHAP11.ACCDB on the sample code website. It tries to open the frmReportDateRange form, the criteria form that supplies the parameters for the query underlying the report. The code cancels the report if it is unable to load the form.
The Close Event
The Close event occurs as the report is closing, before the Deactivate event occurs. Listing 11.2 illustrates the use of the Close event.
Listing 11.2. The Close Event
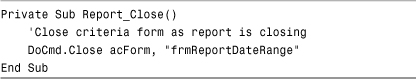
You can find this code in the rptProjectBillingsByWorkCode report in CHAP11.ACCDB on the sample code website. It closes the criteria form frmReportDateRange when the report is closing, in case the form is still open.
The NoData Event
If no records meet the criteria of the recordset underlying a report’s RecordSource, the report prints without data and displays #Error in the report’s Detail section. To eliminate this problem, you can code the NoData event of the report, which executes when no records meet the criteria specified in the report’s RecordSource (see Listing 11.3).
Listing 11.3. The NoData Event
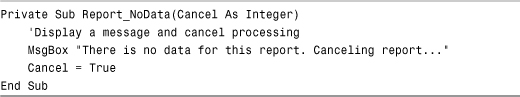
You can find this code in the NoData event of rptProjectBillingsByWorkCode in CHAP11.ACCDB on the sample code website. In case no data is returned by the report’s underlying recordset, a message is displayed to the user, and Cancel is set equal to True. This exits the report without running it.
The Page Event
The Page event gives you the opportunity to do something immediately before the formatted page is sent to the printer. For example, the Page event can be used to place a border around a page, as shown in Listing 11.4.
Listing 11.4. The Page Event
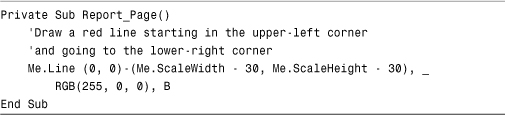
You will find this code in the rptTimeSheet report, in CHAP11.ACCDB. It draws a red line on the report, starting in the upper-left corner and going to the lower-right corner. It uses the ScaleWidth and ScaleHeight properties to determine where the lower-right corner of the report’s printable area is. The B in the third parameter creates a rectangle by using the coordinates as opposite corners of the rectangle.
The Error Event
If an Access Database Engine error occurs when the report is formatting or printing, the Error event is triggered. This error usually occurs if there’s no RecordSource for the report or if someone else has exclusive use over the report’s RecordSource. Listing 11.5 provides an example.
Listing 11.5. The Error Event
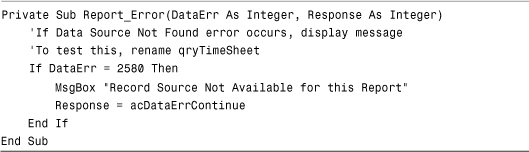
Note
If you have Name Autocorrect turned on, the process of renaming the query will not cause the desired error to occur.
This code responds to a DataErr of 2580, which means that the report’s RecordSource isn’t available. A custom message is displayed to the user, and the Access error is suppressed.
Order of Events for Reports
Understanding the order of events for reports is important. When the user opens a report, previews it, and then closes it, the following sequence of events occurs:
Open->Activate->Close->Deactivate
When the user switches to another report or to a form, the following sequence occurs:
Deactivate(Current Report)->Activate(Form or Report)
Note
The Deactivate event doesn’t occur when the user switches to a dialog box, to a form whose PopUp property is set to Yes, or to a window of another application.
Events Available for Report Sections and When to Use Them
Just as the report itself has events, so does each section of the report. The three section events are the Format event, Print event, and Retreat event, covered in the following sections.
The Format Event
The Format event happens after Access has selected the data to be included in a report section but before it formats or prints the data. With the Format event, you can affect the layout of the section or calculate the results of data in the section, before the section actually prints. Listing 11.6 shows an example.
Listing 11.6. Using the Format Event to Affect the Report Layout

This code is found in the rptInvoice report included in the CHAP11EX.ACCDB database found on the sample code website. The report has controls that track how many rows of detail records should be printed on each page. If the maximum number of rows has been reached, a control with the text Continued on Next Page... is visible. If the control is visible, the page break control is also made visible, and all the controls that display the detail for the report are hidden. The report is kept from advancing to the next record.
Another example of the Format event is found in the Page Header of the rptEmployeeSales report, found in the CHAP11EX.ACCDB database. Because the report is an unbound report whose controls are populated by using Visual Basic for Applications (VBA) code at runtime, the report needs to determine what’s placed in the report header. This varies depending on the result of the crosstab query on which the report is based. The code is shown in Listing 11.7.
Listing 11.7. Using the Format Event to Populate Unbound Controls at Runtime
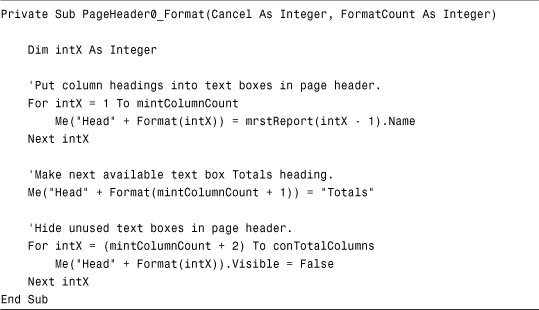
The code loops through each column of the recordset that results from executing the crosstab query (in the Open event of the report). The code populates the controls in the report’s Page Header with the name of each column in the query result. The final column header is set equal to Totals. Finally, any remaining (extra) text boxes are hidden. This is one of several examples in the chapter that covers the Format event.
Note
The example in Listing 11.7 and several other examples in this chapter use an ActiveX Data Objects (ADO) recordset. ADO is covered in Chapter 15, “What Are ActiveX Data Objects, and Why Are They Important?” If you are unfamiliar with ADO, you might want to review Chapter 15 before reviewing the examples.
Tip
By placing logic in the Format event of a report’s Detail section, you can control what happens as each line of the Detail section is printed.
The Print Event
The code in the Print event executes when the data formats to print in the section but before it’s actually printed. The Print event occurs at the following times for different sections of the report:
- Detail Section—Just before the data is printed.
- Group Headers—Just before the Group Header is printed; the Group Header’s
Printevent has access to both the Group Header and the first row of data in the group. - Group Footers—Just before the Group Footer is printed; the
Printevent of the Group Footer has access to both the Group Footer and the last row of data in the group.
Listing 11.8 is in the Print event of the rptEmployeeSales report’s Detail section; this report is included in the CHAP11EX.ACCDB database and is called from frmEmployeeSalesDialogBox.
Listing 11.8. Using the Print Event to Calculate Column and Row Totals

The code begins by evaluating the PrintCount property. If it’s equal to 1, meaning this is the first time the Print event has occurred for the Detail section, the row total is set equal to 0. The code then loops through each control in the section, accumulating totals for each column of the report and a total for the row. After the loop has been exited, the routine places the row total in the appropriate control and adds the row total to the report’s grand total. The report’s Detail section is now ready to be printed.
Note
Many people are confused about when to place code in the Format event and when to place code in the Print event. If you’re doing something that doesn’t affect the page layout, you should use the Print event. However, if you’re doing something that affects the report’s physical appearance (the layout), use the Format event.
The Retreat Event
Sometimes Access needs to move back to a previous section when printing, such as when a group’s Keep Together property is set to With First Detail or Whole in the Property Sheet. Access needs to format the Group Header and the first detail record or, in the case of Whole, the entire group. It then determines whether it can fit the section on the current page. It retreats from the two sections and then formats and prints them; a Retreat event occurs for each section. Here’s an example of the Retreat event for a report’s Detail section:
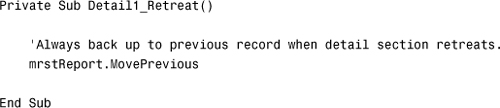
This code is placed in the Retreat event of the rptEmployeeSales report that’s part of CHAP11EX.ACCDB. Because the report is unbound, it needs to return to the previous record in the recordset whenever the Retreat event occurs.
Caution
Whenever you’re working with an unbound report, you need to be careful that the record pointer remains synchronized with the report. For example, if the record pointer has been advanced and the Retreat event occurs, the record pointer must be moved back to the previous record.
Order of Section Events
Just as report events have an order, report sections also have an order of events. All the Format and Print events for each section happen after the report’s Open and Activate events, but before the report’s Close and Deactivate events. The sequence looks like this:
Open(Report)->Activate(Report)->Format(Report Section)->
Print(Report Section)->Close(Report)->Deactivate(Report)
Programmatically Manipulating Report Sections
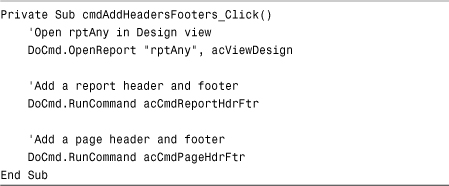
You create and manipulate report sections not only at design time, but also at runtime. You must first open the report in Design view. You use the DoCmd object to add a report header and footer or a page header and footer. The code is shown in Listing 11.9.
Listing 11.9. Using the DoCmd Object to Programmatically Add Sections to Reports at Runtime
You can also add section headers and footers. The code in Listing 11.10 illustrates the process. It is found in frmReportSections on the sample code website.
Listing 11.10. Adding Sections to Reports at Runtime
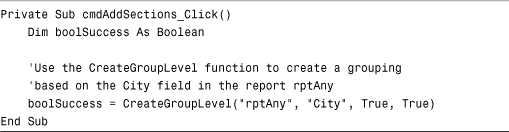
Note that the CreateGroupLevel function receives four parameters. The first is the name of the report you want to affect. The second is an expression designating the expression on which the grouping is based. The third parameter allows you to specify whether you want the group to have a group header, and the final parameter lets you designate whether you want to include a group footer.
Taking Advantage of Special Report Properties
Several report properties are available only at runtime. They let you refine your report’s processing significantly. These properties are covered in the sections that follow. The later section “Incorporating Practical Applications of Report Events and Properties” provides examples of these properties.
MoveLayout
The MoveLayout property indicates to Access whether it should move to the next printing location on the page. When you set the property to False, the printing position is not advanced.
NextRecord
The NextRecord property specifies whether a section should advance to the next record. By setting this property to False, you suppress advancing to the next record.
PrintSection
The PrintSection property indicates whether the section is printed. By setting this property to False, you can suppress printing the section.
Interaction of MoveLayout, NextRecord, and PrintSection
By using the MoveLayout, NextRecord, and PrintSection properties in combination, you can determine exactly where, how, and whether data is printed. Table 11.1 illustrates this point.
Table 11.1. Interaction of MoveLayout, NextRecord, and PrintSection
FormatCount
The FormatCount property evaluates the number of times the Format event has occurred for the report’s current section. The Format event happens more than once whenever the Retreat event occurs. By checking the FormatCount property, you can make sure that complex code placed in the Format event is executed only once.
PrintCount
The PrintCount property identifies the number of times the Print event has occurred for the report’s current section. The Print event happens more than once whenever the Retreat event occurs. By checking the value of the PrintCount property, you can make sure that logic in the Print event is executed only once.
HasContinued
The HasContinued property determines whether part of the current section is printed on a previous page. You can use this property to hide or show certain report controls (for example, Continued From...), depending on whether the section is continued.
WillContinue
The WillContinue property determines whether the current section continues on another page. You can use this property as you do the HasContinued property to hide or display certain controls when a section continues on another page.
Controlling the Printer
Prior to Access 2002, there was no easy way to programmatically control the printer in the applications that you built. Unlike other aspects of Access in which Microsoft provided you with objects, properties, methods, and events that you could easily manipulate, programmatically controlling the printer in versions prior to Access 2002 involved rolling up your sleeves and talking at a low level to operating system objects.
Fortunately, Access 2002 introduced a new Printer object and a Printers collection. The Printer object greatly facilitates the process of programmatically manipulating a printer. The Printers collection allows you to loop through all the Printer objects and perform a task.
The Printer Object
The Printers collection consists of individual Printer objects. You use a Printer object to control each printer in the Printers collection. Listing 11.11 provides an example of the Printer object.
Listing 11.11. The Printer Object
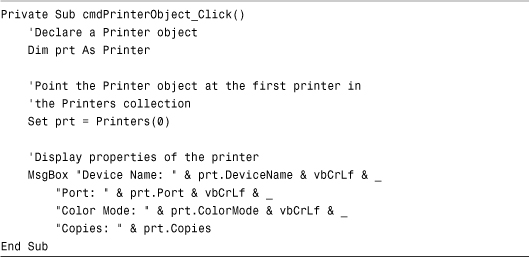
Listing 11.11 begins by instantiating a Printer object. It points the Printer object at the first printer in the Printers collection. It then retrieves the DeviceName, Port, ColorMode, and Copies properties of the printer. These are four of the many properties included for the Printer object. Other properties include LeftMargin, RightMargin, TopMargin, BottomMargin, Orientation, and PrintQuality. Most properties of the Printer object are read/write. This means that you can programmatically manipulate the properties at runtime, easily controlling the behavior of the printer.
The Printers Collection
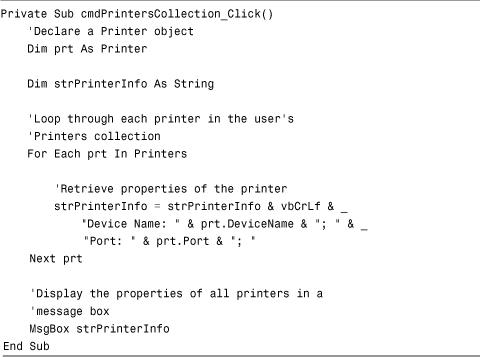
Using the Printers collection, you can loop through all the printers available for a user, programmatically manipulating each one. Listing 11.12 provides an example. It is found in frmPrinterObjectAndPrintersCollection on the sample code website.
Listing 11.12. The Printers Collection
Using Automatic Error Checking
In Access 2007, you can enable automatic error checking of reports. Error checking not only points out errors in a report but also provides suggestions for correcting them.
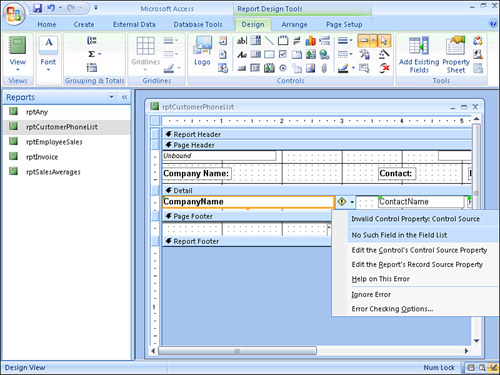
To activate error checking, click the Microsoft Office Access button and then select Access Options. Click to select the Object Designers tab (see Figure 11.1). Click the Enable Error Checking check box to enable error checking. After you enable error checking, indicators appear on your report, letting you know that something is wrong (see Figure 11.2). You then click the indicator, and an explanation along with suggestions for correcting the error appear (see Figure 11.3).
Figure 11.1. You can activate error checking from the Object Designers tab of the Access Options dialog box.
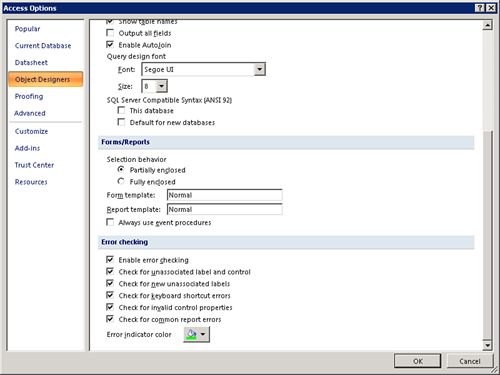
Figure 11.2. Indicators appear on your report, letting you know that something is wrong.

Figure 11.3. A menu appears, providing you with an explanation and suggestions for correcting the error.
The error checker will identify several categories of errors, which are described in Table 11.2.
Table 11.2. Categories of Errors Identified by the Error Checker
If Access identifies several errors for the same control, the error indicator remains until all errors are corrected. If you choose to ignore an error, simply select the Ignore Error option on the Error Checking Options menu. This will clear the error indicator until you close and open the report again. Remember that you can turn off error checking entirely via Access Options (although I find this feature to be extremely valuable).
Propagating Field Properties
When you make a change to an inherited property in a table’s Design view, you can opt to propagate that change to the controls on your reports that are bound to that field. Here’s how it works:
- Open the table whose design you want to modify in Design view.
- Click in the field whose property you want to change.
- Click in the property whose value you want to change.
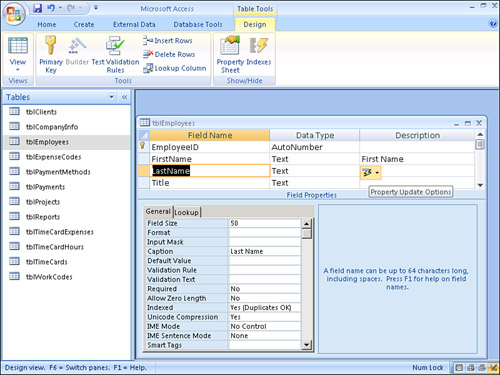
- Change the property and press Enter. If the property that you changed is inheritable, the Property Update Options button appears (see Figure 11.4).
Figure 11.4. The Property Update Options button appears for inheritable properties.
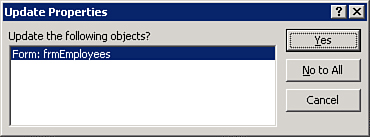
- Open the menu and select Update (see Figure 11.5). The Update Properties dialog box appears (see Figure 11.6). Select the forms and reports that contain the controls that you want to update. Click Yes to complete the process.
Figure 11.5. Open the menu and select Update.
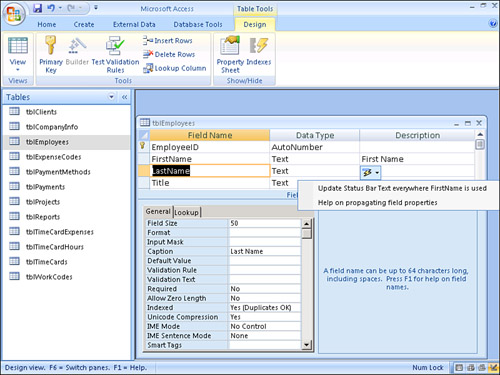
Figure 11.6. The Update Properties dialog box allows you to select the forms and reports that you want to update.
Incorporating Practical Applications of Report Events and Properties
When developing reports, you should make sure that you can use the report in as many situations as possible—that you build as much flexibility into the report as you can. Instead of managing several similar reports, making changes to each one whenever something changes, you can manage one report that handles different situations. Using the events and properties covered in this chapter will help you do just that. This might involve changing the report’s RecordSource at runtime; using the same report to print summary data, detail data, or both; changing the print position; or even running a report based on a crosstab query with unbound controls. All these aspects of report design are covered in the following sections.
Changing a Report’s RecordSource
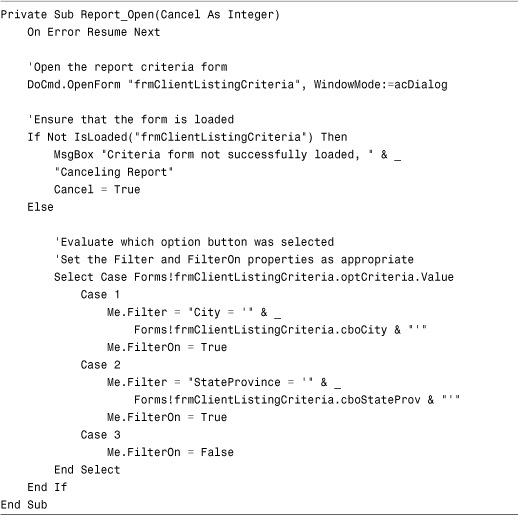
Often you might want to change a report’s RecordSource at runtime. By doing this, you can allow your users to alter the conditions for your report and transparently modify the query on which the report is based. The rptClientListing report in CHAP11.ACCDB contains the code in Listing 11.13 in its Open event.
Listing 11.13. An Example of Using the Report Open Event to Modify a Report’s RecordSource
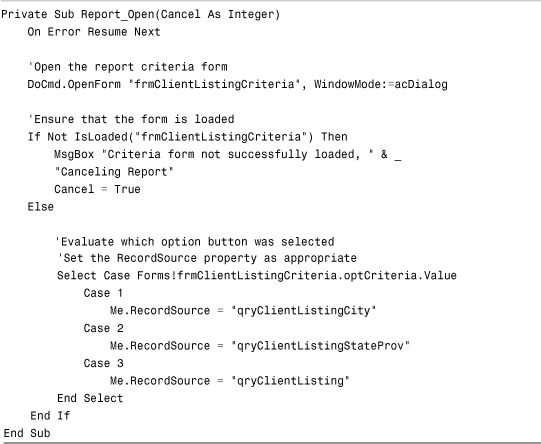
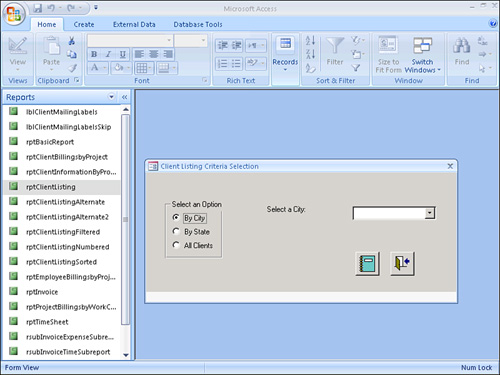
This code begins by opening the frmClientListingCriteria form, if it isn’t already loaded. It loads the form modally and waits for the user to select the report criteria (see Figure 11.7). After the user clicks to preview the report, the form sets its own Visible property to False. This causes execution to continue in the report but leaves the form in memory so that its controls can be accessed with VBA code. The code evaluates the value of the form’s optCriteria option button. Depending on which option button is selected, the report’s RecordSource property is set to the appropriate query. The following code is placed in the Close event of the report:
![]()
Figure 11.7. The criteria selection used to determine the RecordSource.
This code closes the criteria form as the report is closing. The frmClientListingCriteria form has some code that’s important to the processing of the report. It’s found in the AfterUpdate event of the optCriteria option group (see Listing 11.14).
Listing 11.14. The AfterUpdate Event of the optCriteria Option Group
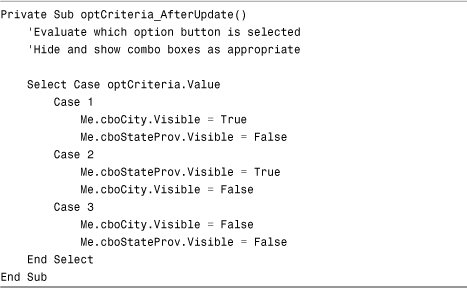
This code evaluates the value of the option group. It hides and shows the visibility of the cboCity and cboStateProv combo boxes, depending on which option button the user selects. The cboCity and cboStateProv combo boxes are then used as appropriate criteria for the queries that underlie the rptClientListing report.
The example shown in Listing 11.13 uses three stored queries to accomplish the task of switching the report’s record source. An alternative to this technique is to programmatically set the RecordSource property of the report to the appropriate SQL statement. This technique is illustrated in Listing 11.15 and is found in rptClientListingAlternate on the sample code website.
Listing 11.15. Using the Report Open Event to Modify a Report’s RecordSource to the Appropriate SQL Statement
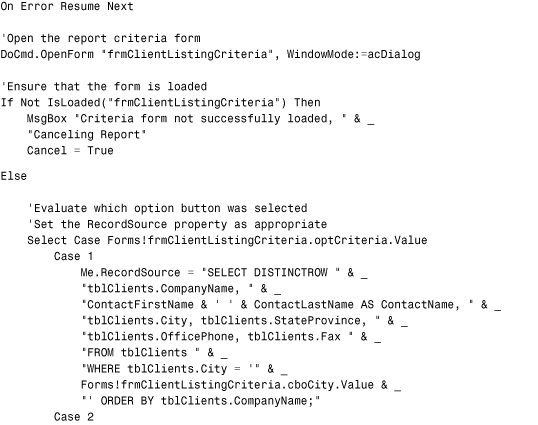
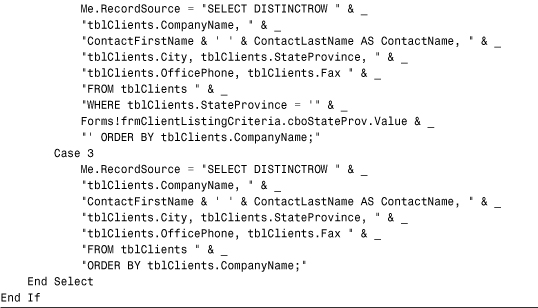
This example programmatically builds a SQL statement based on the option selected on the criteria form. It uses the cboCity and cboStateProv combo boxes to build the WHERE clause in the appropriate SQL strings.
Listing 11.16 shows my favorite alternative. It is somewhat of a compromise between the first two alternatives. You will find the code in frmClientListingCriteriaAlternate. Unlike in the previous two examples, the criteria form drives this entire example. In other words, you will not find any code behind the report. Listing 11.16 looks like this.
Listing 11.16. The Code Behind the frmClientListingCriteriaAlternate Form
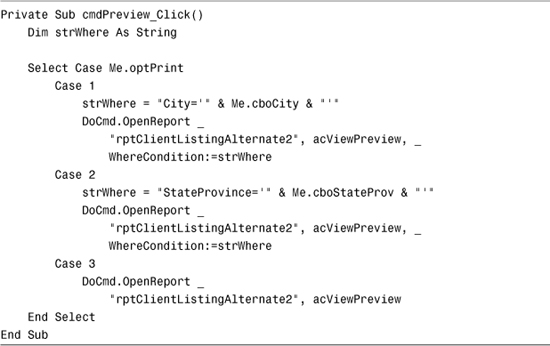
The code begins by determining which option button the user selected. Based on which option button the user selected, the code enters the appropriate branch of the Case statement to build the necessary Where clause. The code uses the Where clause as the WhereCondition parameter of the OpenReport method of the DoCmd object. The RecordSource of the report is always the same. It is the WhereCondition parameter that differentiates the data that appears in the report.
Working with Report Filters
The Filter and FilterOn properties allow you to set a report filter and to turn it on and off. Three possible scenarios can apply:
- No filter is in effect.
- The
Filterproperty is set but is not in effect because theFilterOnproperty is set toFalse. - The filter is in effect. This requires that the
Filterproperty is set, and theFilterOnproperty is set toTrue.
You can set filtering properties either at design time or at runtime. This solution provides another alternative to the example provided in Listing 11.13. With this alternative, the RecordSource of the report is fixed. The Filter and FilterOn properties are used to display the appropriate data. Listing 11.17 provides an example. You can find the code in rptClientListingFiltered on the sample code website.
Listing 11.17. Using the Filter and FilterOn Properties
In this example, the RecordSource property of the report is the qryClients query. The query returns clients in all cities and all states. The example uses the Open event of the report to filter the data to the appropriate city or state.
Caution
Listings 11.13, 11.15, and 11.16 are much more efficient than the code in Listing 11.17. In a client/server environment, such as Microsoft SQL Server, with the code in Listings 11.13, 11.15, and 11.16, only the requested data comes over the network wire. For example, only data for the requested city comes over the wire. On the other hand, the Filter property is applied after the data comes over the wire. This means that, in the example, all clients come over the wire, and the filter for the requested City or State is applied at the workstation.
Working with the Report Sort Order
The OrderBy and OrderByOn properties are similar to the Filter and FilterOn properties. They allow you to apply a sort order to the report. As with filters, three scenarios apply:
- No sort is in effect.
- The
OrderByproperty is set but is not in effect because theOrderByOnproperty is set toFalse. - The order is in effect. This requires that the
OrderByproperty is set, and theOrderByOnproperty is set toTrue.
You can set ordering properties either at design time or at runtime. The OrderBy and OrderByOn properties are used to determine the sort order of the report and whether the sort is in effect. Listing 11.18 provides an example. You can find the code in rptClientListingSorted on the sample code website.
Listing 11.18. Using the Report Open Event to Modify the Sort Order of a Report
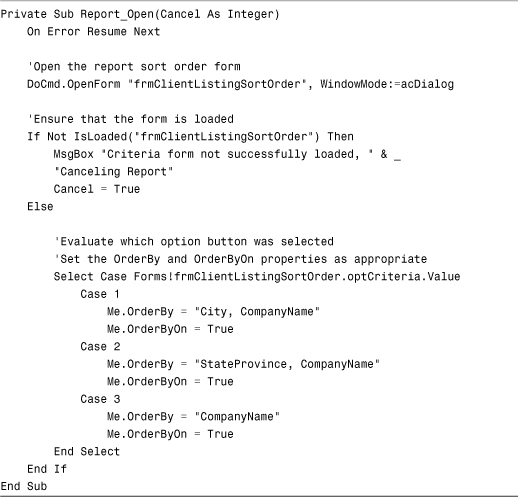
The code appears in the Open event of the report. It evaluates which option button the user selected on the frmClientListingSortOrder form. It then sets the OrderBy property as appropriate and sets the OrderByOn property to True so that the OrderBy property takes effect.
Caution
The OrderBy property augments, rather than replaces, the existing sort order of the report. If the OrderBy property is in conflict with the sort order of the report, the OrderBy property is ignored. For example, if the sort order in the Sorting and Grouping window is set to CompanyName and the OrderBy property is set to City combined with CompanyName, the OrderBy property is ignored.
Using the Same Report to Display Summary, Detail, or Both
Many programmers create three reports for their users: one that displays summary only, one that displays detail only, and another that displays both. Creating all these reports is unnecessary. Because you can hide and display report sections as necessary at runtime, you can create one report that meets all three needs. The rptClientBillingsByProject report included in the CHAP11.ACCDB database illustrates this point. Place the code shown in Listing 11.19 in the report’s Open event.
Listing 11.19. Using the Report Open Event to Hide and Show Report Sections as Appropriate
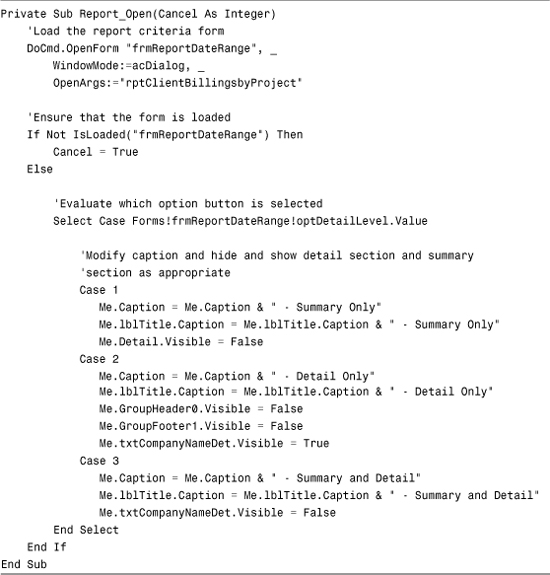
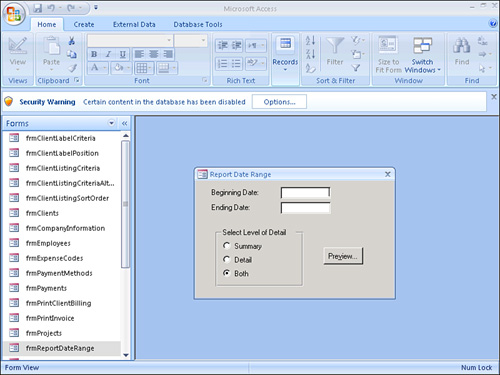
The code begins by opening frmReportDateRange included in CHAP11.ACCDB (see Figure 11.8). The form has an option group asking users whether they want a Summary report, Detail report, or a report that contains both Summary and Detail. If the user selects Summary, the caption of the Report window and the lblTitle label are modified, and the Visible property of the Detail section is set to False. If the user selects Detail Only, the captions of the Report window and the lblTitle label are modified, and the Visible property of the Group Header and Footer sections is set to False. A control in the Detail section containing the company name is made visible. The CompanyName control is visible in the Detail section when the Detail Only report is printed, but it’s invisible when the Summary and Detail report is printed. When Both is selected as the level of detail, no sections are hidden. The captions of the Report window and the lblTitle label are modified, and the CompanyName control is hidden.
Figure 11.8. The criteria selection used to determine detail level.
The code behind the form’s Preview button looks like that shown in Listing 11.20.
Listing 11.20. Code That Validates the Date Range Entered by the User
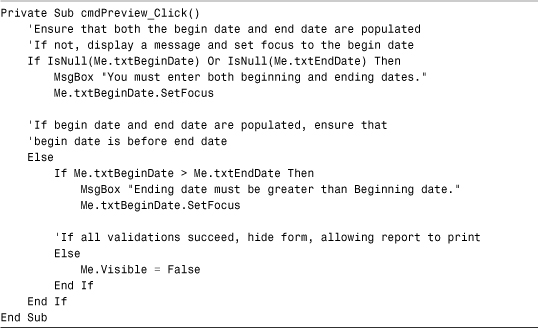
This code makes sure that both the beginning date and the ending date are filled in and that the beginning date comes before the ending date. If both of these rules are fulfilled, the code sets the Visible property of the form to False. Otherwise, the code displays an appropriate error message.
Numbering Report Items
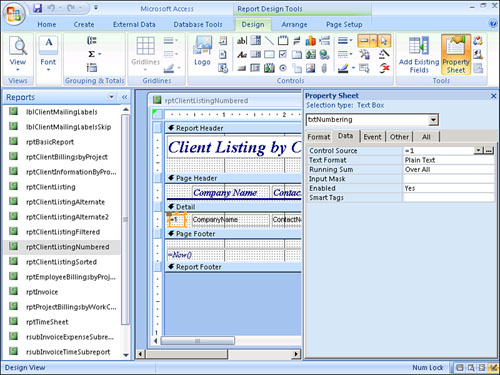
Many people are unaware how simple it is to number the items on a report. Figure 11.9 provides an example of a numbered report. This report is called rptClientListingNumbered and is located on the sample code website. The process of creating such a report is extremely simple. Figure 11.10 shows the Data properties of the txtNumbering text box. The Control Source property allows you to set the starting number for a report. The Running Sum property allows you to determine when the numbering is reset to the starting value. The Control Source property of the text box is set to =1, and the Running Sum property is set to Over All. The combination of these two properties causes the report to begin numbering with the number 1 and to continue the numbering throughout the report. Setting the Running Sum property to Over Group causes the numbering to reset itself at the beginning of each report grouping.
Figure 11.9. You can add numbering to items on a report easily.
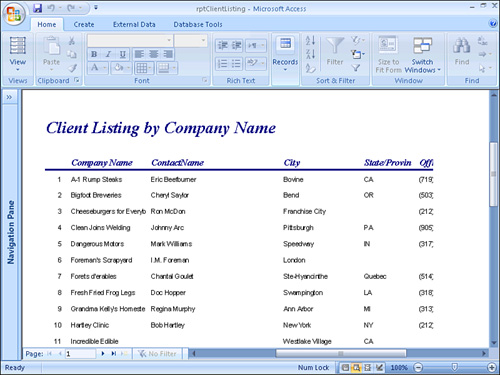
Figure 11.10. The Control Source property and the Running Sum property.
Printing Multiple Labels
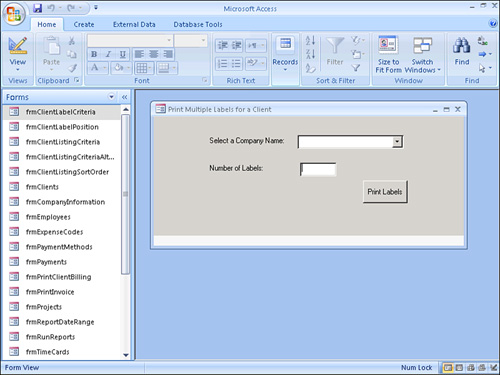
Many times, users want to print multiple copies of the same label. The report’s MoveLayout, NextRecord, PrintSection, and PrintCount properties help us to accomplish the task. The form shown in Figure 11.11 is called frmClientLabelCriteria and is found in CHAP11.ACCDB. It asks users to select a company and the number of labels they want to print for that company. The code for the Print Labels command button looks like that shown in Listing 11.21.
Figure 11.11. The criteria selection used to specify the company name and number of labels to print.
Listing 11.21. Code That Prints the lblClientMailingLabels Report for the Selected Company
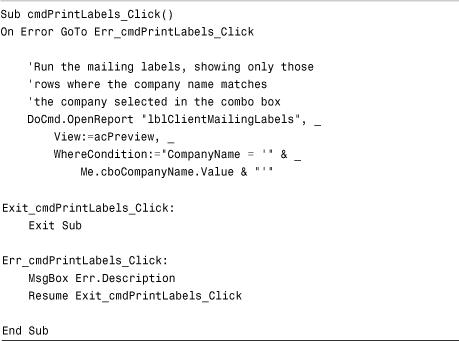
Notice that the routine uses the company name selected from the combo box as a criterion to run the lblClientMailingLabels report. The Open event of lblClientMailingLabels is shown in Listing 11.22.
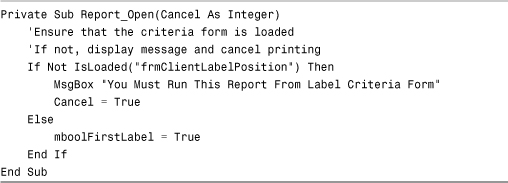
Listing 11.22. The Open Event of lblClientMailingLabels
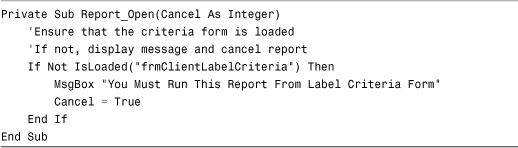
This code tests to make sure the frmClientLabelCriteria form is open. If it’s not, the code displays a message and cancels the report. The Detail section’s Print event, which compares the requested number of labels with the number of labels printed, is the key to the whole process (see Listing 11.23).
Listing 11.23. The Code in the Print Event
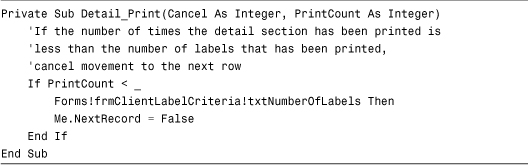
This code compares the PrintCount property to the number of labels the user wants to print. As long as the PrintCount is less than the number of labels requested, the record pointer is not advanced. This causes multiple labels to be printed for the same record.
Determining Where a Label Prints
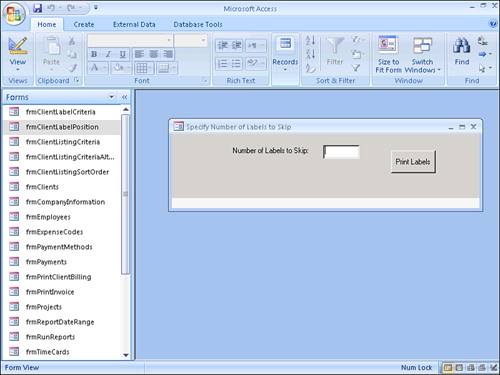
Users often want to print several copies of the same label, but they might also want to print mailing labels in a specific position on the page. Users generally do this so that they can begin the print process on the first unused label. The frmClientLabelPosition form from CHAP11.ACCDB lets the user specify the first label location on which to print by designating the number of labels that the user wants to skip (see Figure 11.12). The Open event of lblClientMailLabelsSkip is shown in Listing 11.24.
Figure 11.12. The criteria selection used to indicate the number of labels to skip.
Listing 11.24. The Code in the Open Event of lblClientMailLabelsSkip
The code tests to make sure that the frmClientLabelPosition form is loaded. It also sets a private variable, mboolFirstLabel, equal to True. The Detail section’s Print event, which suppresses printing until the correct number of labels is skipped, is shown in Listing 11.25.
Listing 11.25. The Detail Print Event
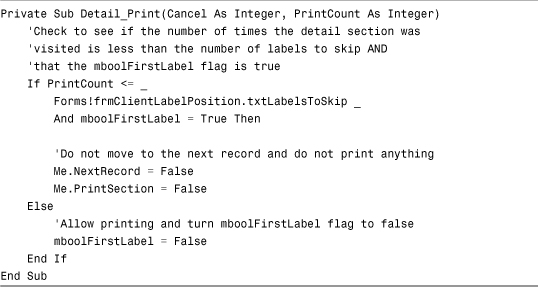
This routine checks to see whether the PrintCount property of the report is less than or equal to the number of the labels to skip. It also checks to make sure that the mboolFirstLabel variable is equal to True. If both conditions are True, the report doesn’t move to the next record and doesn’t print anything. The print position is advanced. When the PrintCount becomes greater than the number of labels to skip, the mboolFirstLabel variable is set to False and printing proceeds as usual. If mboolFirstLabel is not set to False, the designated number of labels is skipped between each record. One additional event makes all this work—the Format event of the Report Header:
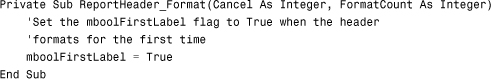
The ReportHeader Format event sets mboolFirstLabel back to True. You must include this step in case the user previews and then prints the labels. If the mboolFirstLabel variable is not reset to True, the selected number of labels isn’t skipped on the printout because the condition that skips the labels is never met.
Building a Report from a Crosstab Query
Basing a report on the results of a crosstab query is difficult because its number of columns usually varies. Look at the example shown in Figure 11.13. Notice that the employee names appear across the top of the report as column headings, and the products are listed down the side of the report. This report is based on the crosstab query called qxtabEmployeeSales, part of the CHAP11.ACCDB database found on the sample code website (see Figure 11.14). The problem is that the number of employees—and, therefore, column headings—can vary. This report is coded to handle such an eventuality.
Figure 11.13. A report based on a crosstab query.
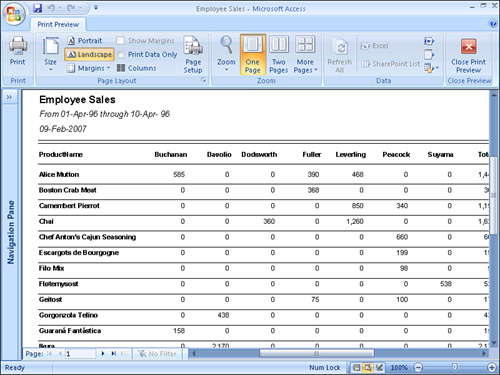
Figure 11.14. A crosstab query underlying a report.

When the rptEmployeeSales (located in CHAP11EX.ACCDB) report runs, its Open event executes (see Listing 11.26).
Listing 11.26. Code That Obtains Criteria Information for the Report and Then Builds a Recordset That Underlies the Report
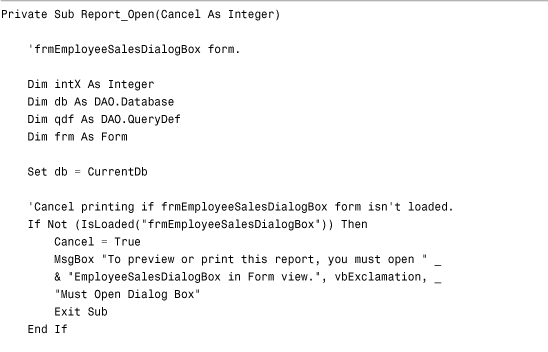
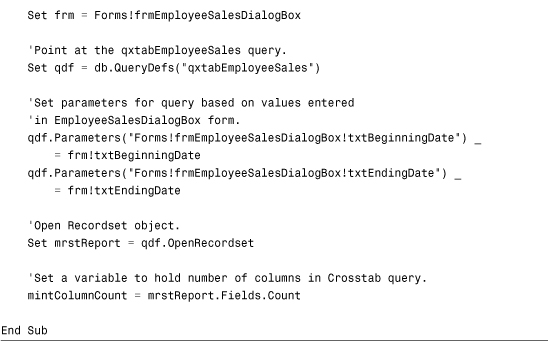
The Open event points a database object variable to the current database. It then checks to make sure the criteria form, frmEmployeeSalesDialogBox, is open. This form supplies the criteria for the qxtabEmployeeSales query that underlies the report. It opens the qxtabEmployeeSales query definition and passes it the parameters from the frmEmployeeSalesDialogBox criteria form. Next, it opens a recordset based on the query definition, using the criteria found on the frmEmployeeSalesDialogBox form. The number of columns returned from the crosstab query is very important. The code stores this number in a Private variable called mintColumnCount and uses it throughout the remaining functions to determine how many columns to fill with data.
Note
This book focuses on the use of ADO (ActiveX Data Objects) rather than DAO (Data Access Objects). You might wonder why this example uses DAO rather than ADO. The query that underlies this example is a crosstab query. The ADO command object does not recognize crosstab queries. It was therefore necessary to use DAO in this example. If you need more information about DAO, see A lison Balter’s Mastering Access 2003 Desktop Development.
Next, the Report Header Format event occurs. It moves to the first record in the recordset created during the Open event (see Listing 11.27). It also calls the InitVars routine shown in Listing 11.28.
Listing 11.27. The Report Header Format Routine
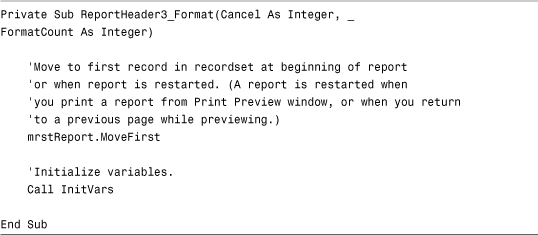
The InitVars routine initializes some variables used in the report.
Listing 11.28. The InitVars Routine

The mlngReportTotal variable is used for the report grand total (all products, all salespeople), and the mlngRgColumnTotal array contains the total for each salesperson. After the Report Header Format event occurs, the Page Header Format event takes place (see Listing 11.29.)
Listing 11.29. The Code in the Page Header Format Event That Inserts the Appropriate Column Headings and Hides the Appropriate Controls
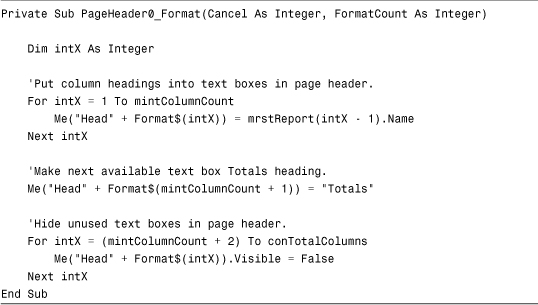
The PageHeader Format event uses the names of the fields in the query results as column headings for the report. This essential routine is “smart” because, after it fills in all the column headings, it hides all the extra controls on the report.
Next, the Detail Section Format event, shown is Listing 11.30, occurs.
Listing 11.30. The Code in the Detail Section Format Event That Inserts Data from the Current Row into the Report and Hides the Appropriate Controls

The Detail Section Format event checks the recordset’s EOF property to determine whether the last record in the query has already been read. If not, the section’s FormatCount property is tested to see whether it’s equal to 1. If so, each column in the current record of the recordset is read. The code fills each control in the Detail section with data from a column in the recordset, and any unused text boxes in the report’s Detail section are hidden. Finally, the code moves to the next record in the recordset, readying the report to print the next line of detail. The xtabCnulls function, which converts Null values into zeros, is called each time the recordset underlying the report is read:
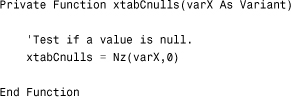
The xtabCnulls function evaluates each value sent to it to check whether the value is Null. If so, it returns zero from the function; otherwise, it returns the value passed to the function.
After the code executes the Detail Section Format event, it executes the Detail Section Print event (shown in Listing 11.31).
Listing 11.31. The Code in the Detail Section Print Event That Accumulates Column Totals and Prints Row Totals
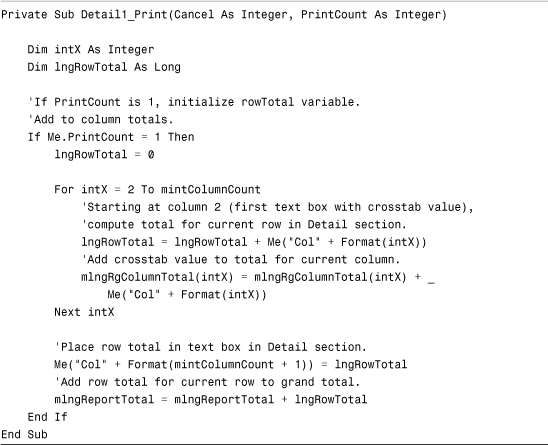
The Detail Section Print event generates the row total value, placing it in the last column of the report, accumulating column totals, and accumulating the mlngReportTotal value, which is the grand total for all columns and rows. It does this by making sure the PrintCount of the section is 1. If so, it resets the lngRowTotal variable to 0. Starting at column 2 (column 1 contains the product name), it begins accumulating a row total by looking at each control in the row, adding its value to lngRowTotal. As it traverses each column in the row, it also adds the value in each column to the appropriate element of the mlngRgColumnTotal private array, which maintains all the column totals for the report. It prints the row total and adds the row total to the report’s grand total.
When the Retreat event occurs, the following code executes:
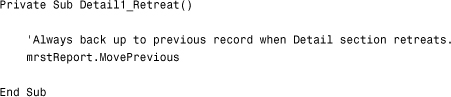
This code forces the record pointer to move back to the previous record in the recordset. Finally, the report footer prints, which causes the Report Footer Print event to execute. In turn, this event prints the grand totals and hides the appropriate controls (see Listing 11.32).
Listing 11.32. The Code in the Report Footer Print Event
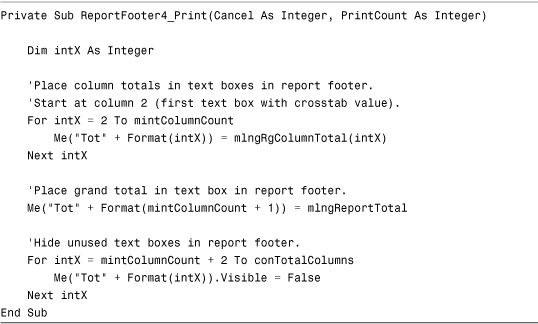
The Report Footer Print event loops through each control in the footer, populating each control with the appropriate element of the mlngRgColumnTotal array. This gives you the column totals for the report. Finally, the grand total is printed in the next available column. Any extra text boxes are hidden from display.
Printing the First and Last Page Entries in the Page Header
Another useful technique is printing the first and last entries from a page in the report’s header. The rptCustomerPhoneList report, found in the CHAP11EX.ACCDB database located on the sample code website, illustrates this (see Figure 11.15). The code for this report relies on Access making two passes through the report. During the first pass, a variable called gboolLastPage is equal to False. The gboolLastPage variable becomes True only when the Report Footer Format event is executed at the end of the first pass through the report. Keep this in mind as you review the code behind the report.
Figure 11.15. The first and last entry printed in the report header.

Note
To view the desired results, make sure that you click Options and enable code to run; also make sure you view this report in Print Preview mode.
The first routine that affects the report processing is the Page Header Format event routine shown in Listing 11.33.
Listing 11.33. The Code in the Page Header Format Event That Updates the Appropriate Text Boxes with the First and Last Entries on the Page
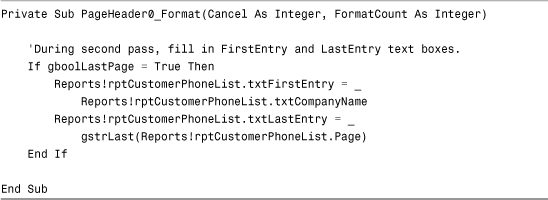
The Page Header Format routine tests to see whether the gboolLastPage variable is equal to True. During the first pass through the report, the gboolLastPage variable is equal to False. During the second pass, the txtFirstEntry and txtLastEntry text boxes (both of which appear in the report’s header) are populated with data. The txtFirstEntry text box is filled with the value in the txtCompanyName control of the current record (the first record on the page), and the txtLastEntry text box is populated with the appropriate element number from the CustomerPhoneList array. Each element of the CustomerPhoneList array is populated by the Format event of the Page Footer for that page during the first pass through the report.
Next, the Page Footer Format event, which populates the array with the last entry on a page, is executed (see Listing 11.34).
Listing 11.34. The Code in the Page Footer Format Event
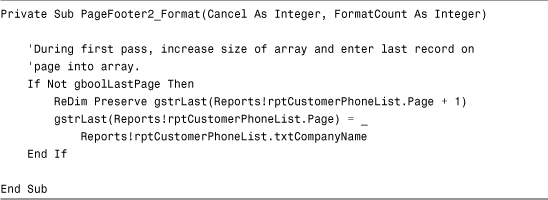
The Page Footer Format event determines whether the gboolLastPage variable is equal to False. If so (which it is during the first pass through the report), the code redimensions the gstrLast array to add an element. The value from the txtCompanyName control of the last record on the page is stored in the new element of the gstrLast array. This value eventually appears in the Page Header of that page as the last company name that appears on the page. Finally, the Report Footer Format event executes, as shown in Listing 11.35. This event inserts data from the last row in the recordset into the last element of the array.
Listing 11.35. The Code in the Report Footer Format Event
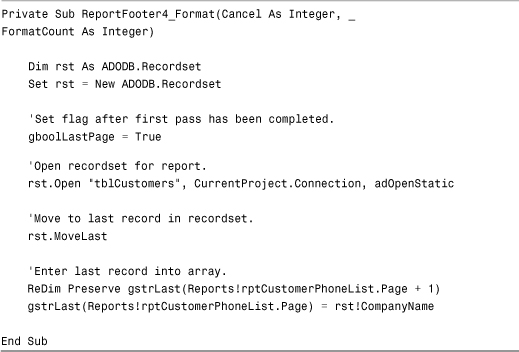
The Report Footer routine sets the gboolLastPage variable equal to True and opens a recordset based on the Customers table. This is the recordset on which the report is based. It moves to the last record in the recordset and adds the CompanyName value from the recordset’s last record in an additional element of the array.
Now the first pass of the report has finished. As the user moves to each page of the report during a print preview, or as each page is printed to the printer, the Format event executes for the Page Header. The company name from the first record on the page is placed in the txtFirstEntry control, and the appropriate element from the gstrLast array is placed in the txtLastEntry control.
Creating a Multifact Crosstab Report
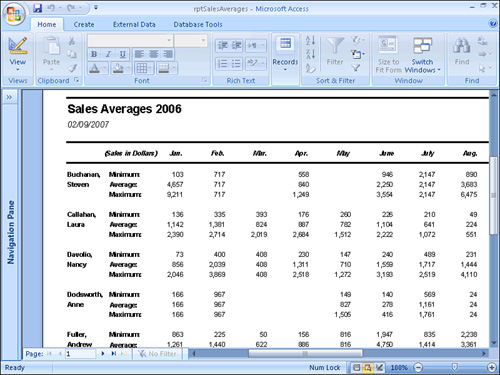
By nature, crosstab queries are limited because they don’t allow you to place multiple rows of data in the result. For example, you can’t display months as column headings and then show the minimum, average, and maximum sales for each employee as row headings. The rptSalesAverages report, found in the CHAP11EX database and shown in Figure 11.16, solves this problem.
Figure 11.16. An example of a multifact crosstab report.
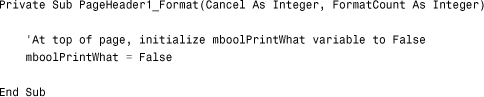
Each time the Format event of the Page Header executes, the variable mboolPrintWhat is reset to False:
After the Page Header Format event executes, the Group Header Format event launches, as shown in Listing 11.36.
Listing 11.36. The Code in the Group Header Format Event Used to Hide and Show the Appropriate Controls
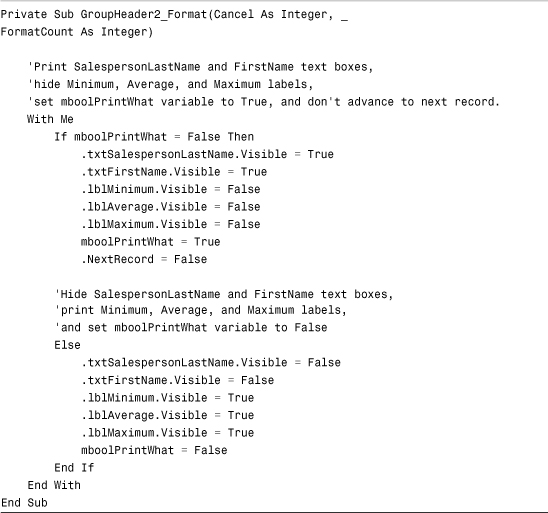
The first time the Format event for the LastName Group Header (GroupHeader2) executes, the value of the mboolPrintWhat variable is equal to False. The txtSalesPersonLastName and the txtFirstName controls are made visible, and the lblMinimum, lblAverage, and lblMaximum controls are hidden. The mboolPrintWhat variable is set to True, and movement to the next record is suppressed by setting the value of the NextRecord property to False.
The second time the Format event for the LastName Group Header executes, the code hides the txtSalespersonLastName and txtFirstName controls. The code makes the lblMinimum, lblAverage, and lblMaximum controls visible and sets the value of the mboolPrintWhat variable to False.
The only other code for the report, shown in Listing 11.37, is in the Format event of the Shipped Date Header (GroupHeader3).
Listing 11.37. The Code in the Group Header Format Event Used to Determine When Printing Occurs

This code compares the report’s Left property to the result of an expression. The Left property is the amount that the current section is offset from the page’s left edge. This number is compared to the value in the txtLeftMargin control added to the current month plus one, and then it’s multiplied by the value in the txtColumnWidth control. If this expression evaluates to True, the code sets the NextRecord and PrintSection properties of the report to False. This causes the printer to move to the next printing position but to remain on the same record and not print anything, which forces a blank space in the report. You might wonder what the complicated expression is all about. Simply put, it’s an algorithm that makes sure printing occurs and that Access moves to the next record only when the data is ready to print.
Practical Examples: Practicing What You Learned
I use the techniques covered in this section in many of the applications that I distribute to my users. The report that you’ll build here could be included in the hypothetical time and billing application. It covers generic techniques that you can use in any application that you build.
One report not covered in the chapter is the rptEmployeeBillingsByProject report. This report has the following code in its NoData event:
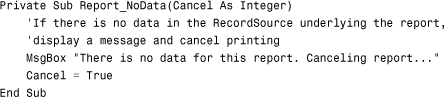
If there’s no data in the report’s RecordSource, a message box is displayed, and the report is canceled. The Open event of the report looks like this:
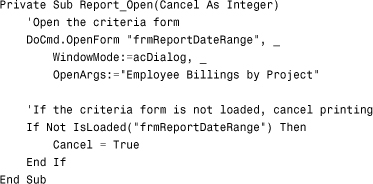
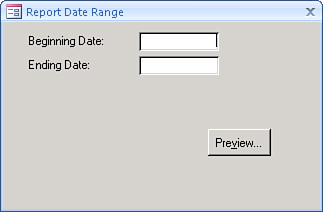
The report’s Open event opens a form called frmReportDateRange (see Figure 11.17). This form is required because it supplies criteria to the query underlying the report. If the form isn’t loaded successfully, the report is canceled.
Figure 11.17. A criteria selection form.
Note
You must open this form by running the rptEmployeeBillingsbyProject report. The report will open the form and then will apply the designated criteria. Also, don’t forget to click Options and enable code to run.
Finally, the report’s Close event looks like this:
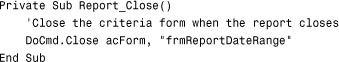
The report cleans up after itself by closing the criteria form.
Summary
To take full advantage of what the Access reporting tool has to offer, you must understand—and be able to work with—report and section events. This chapter described the report and section events, giving you detailed examples of when to use each event.
In addition to the report events, several special properties are available to you only at runtime. By manipulating these properties, you can have more control over your reports’ behavior. After covering the report and section events, this chapter covered the properties you can manipulate only at runtime. Examples highlighted the appropriate use of each property.
There are many tips and tricks of the trade that help you do things you might otherwise think are impossible to accomplish. This chapter gave you several practical examples of these tips and tricks, making it easy for you to use them in your own application development.