Appendix A
Statistical Tables and Charts
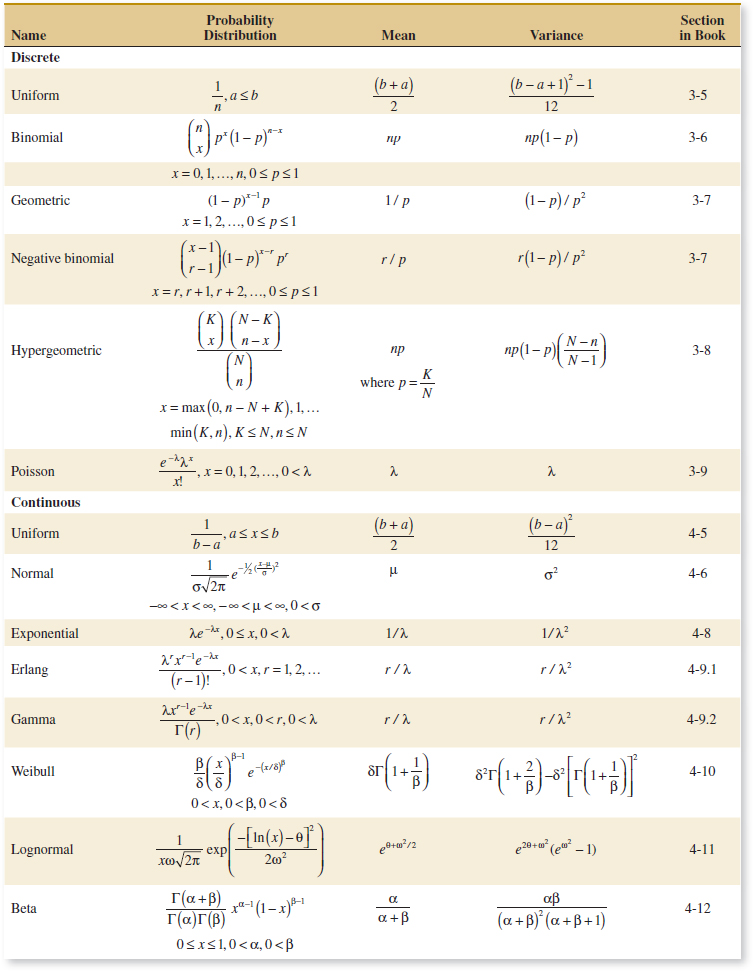
![]() TABLE • I Summary of Common Probability Distributions
TABLE • I Summary of Common Probability Distributions
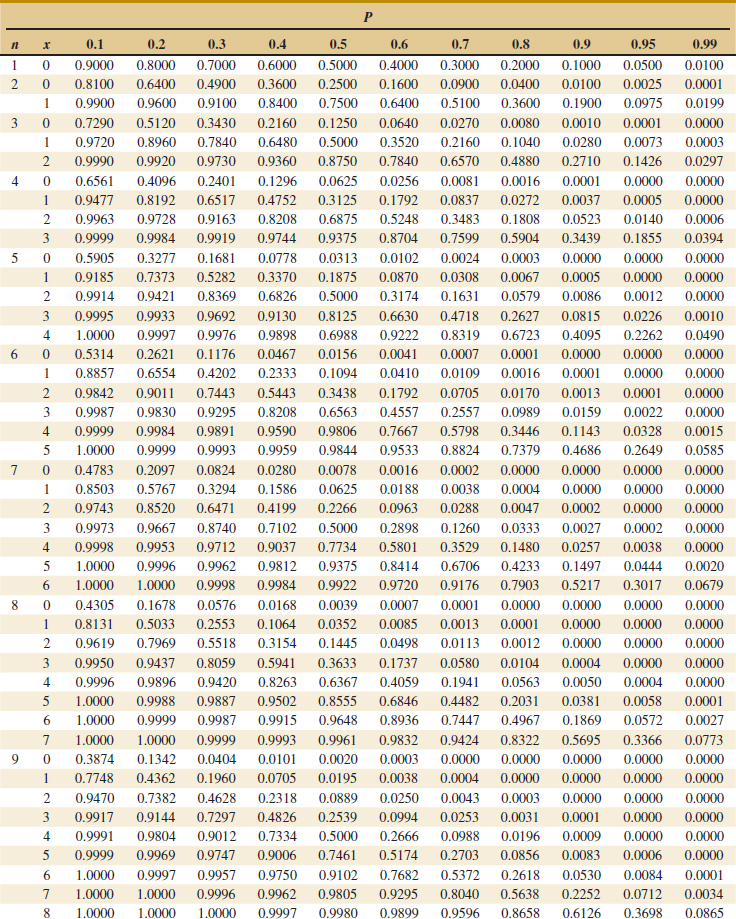
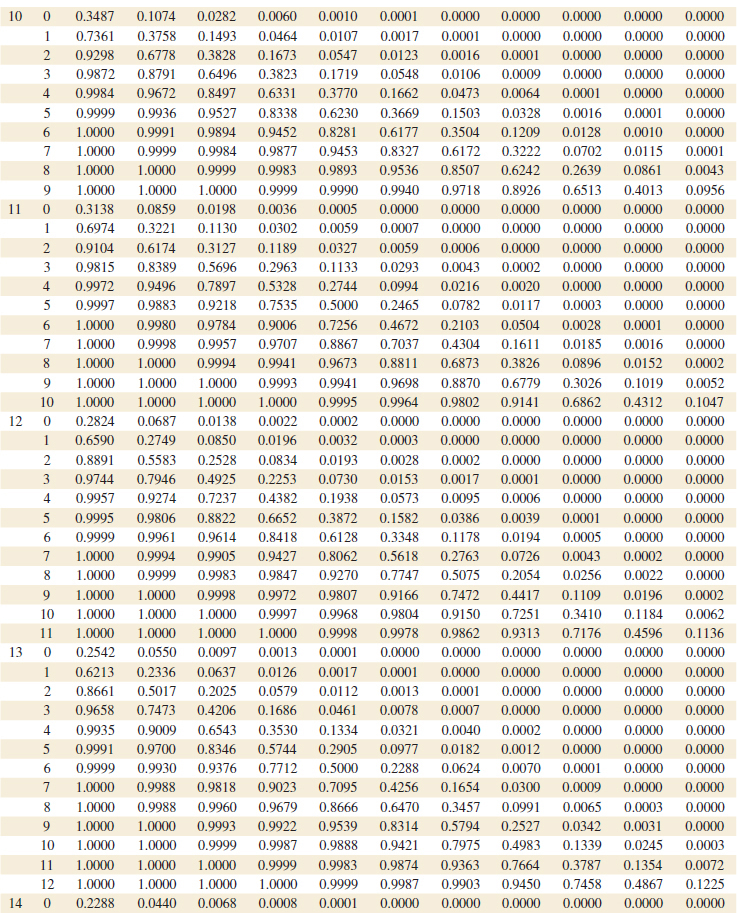
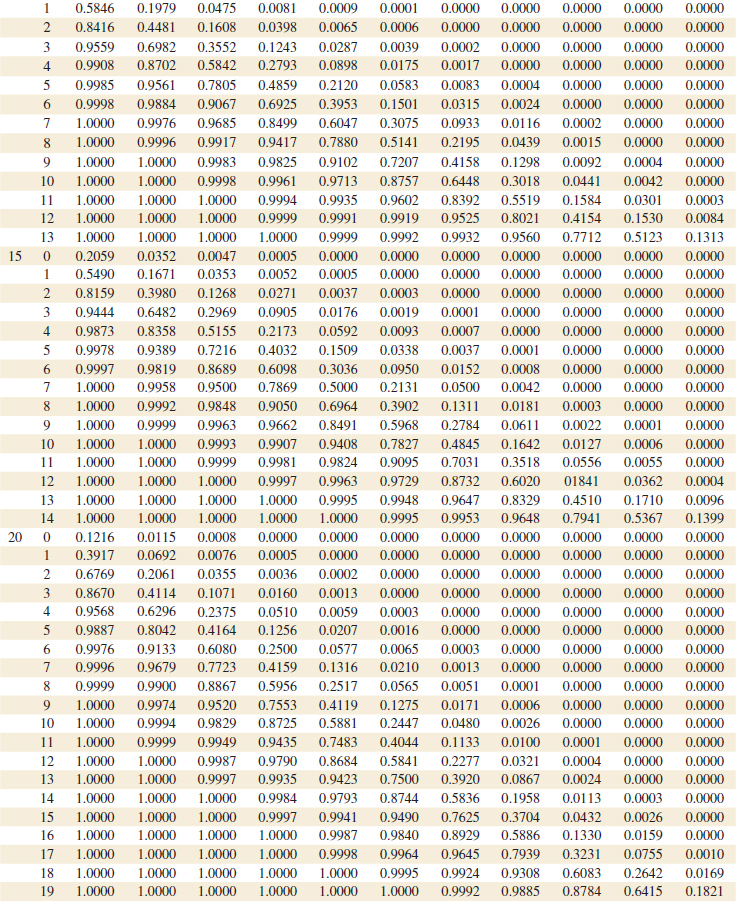
![]() TABLE • II Cumulative Binomial Probabilities P(X ≤ x)
TABLE • II Cumulative Binomial Probabilities P(X ≤ x)
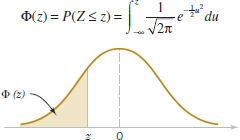
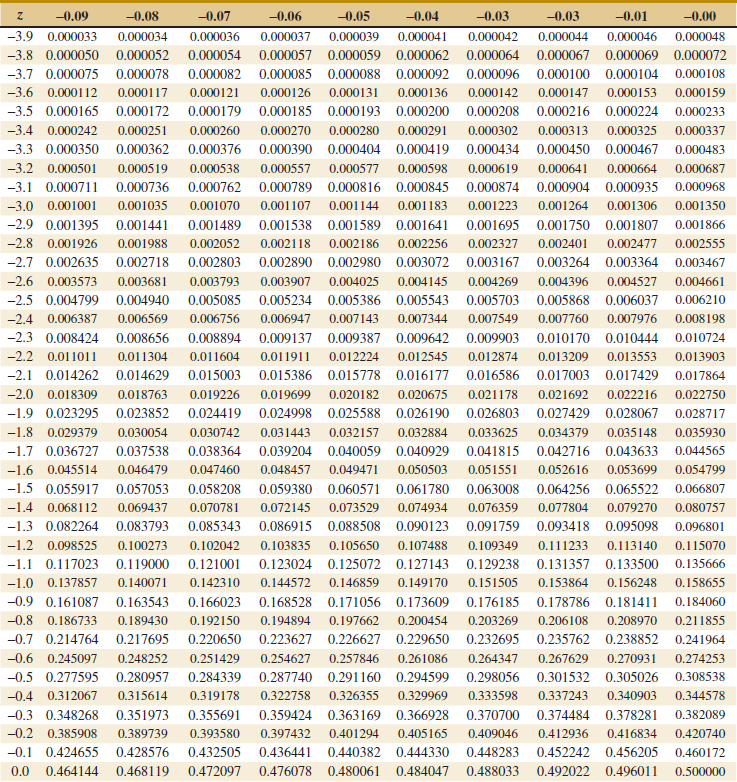
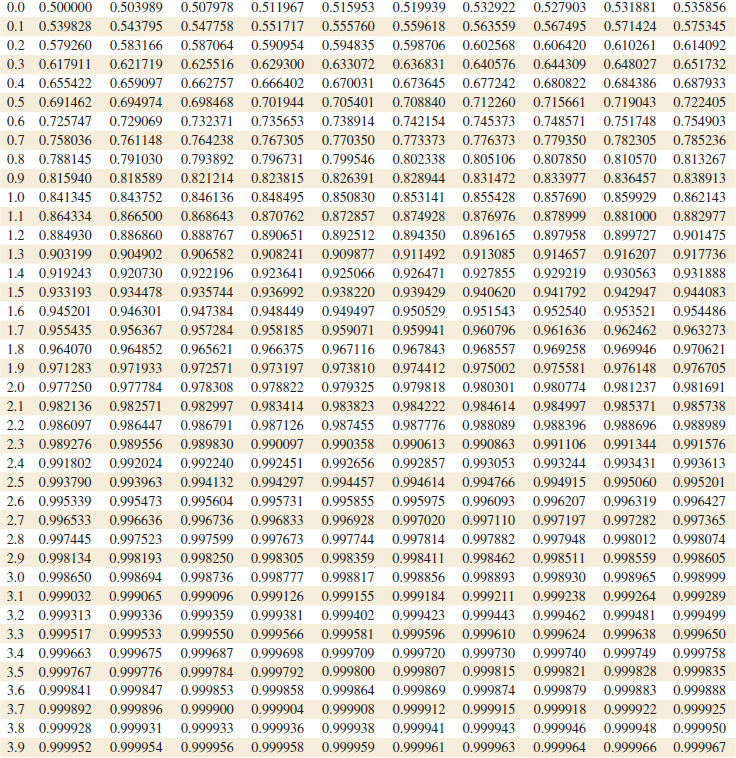
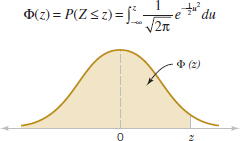
![]() TABLE • III Cumulative Standard Normal Distribution
TABLE • III Cumulative Standard Normal Distribution
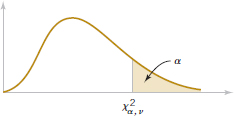
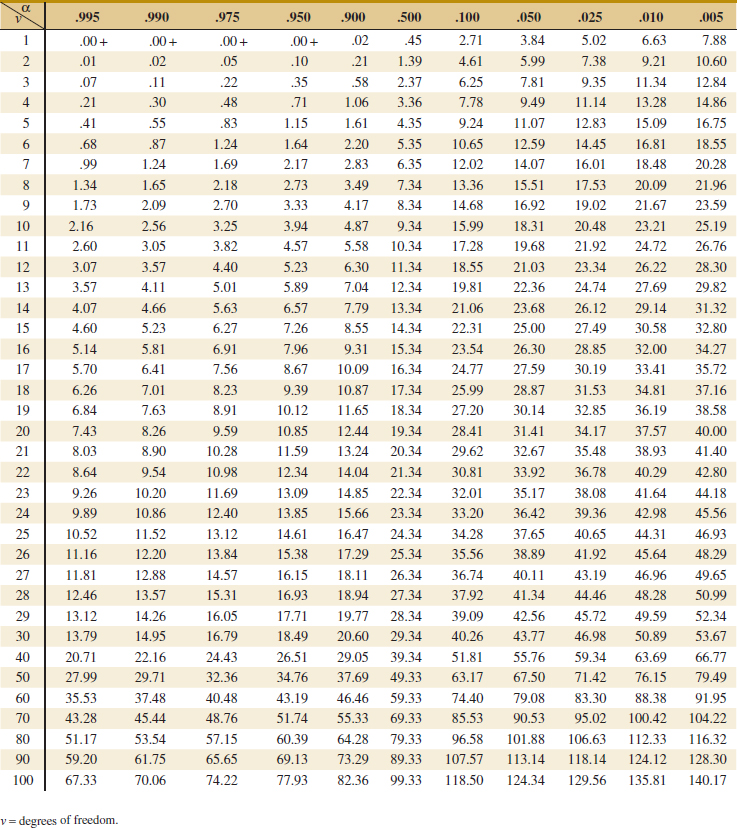
![]() TABLE • IV Percentage Points
TABLE • IV Percentage Points ![]() of the Chi-Squared Distribution
of the Chi-Squared Distribution
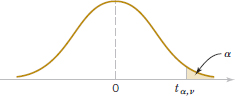
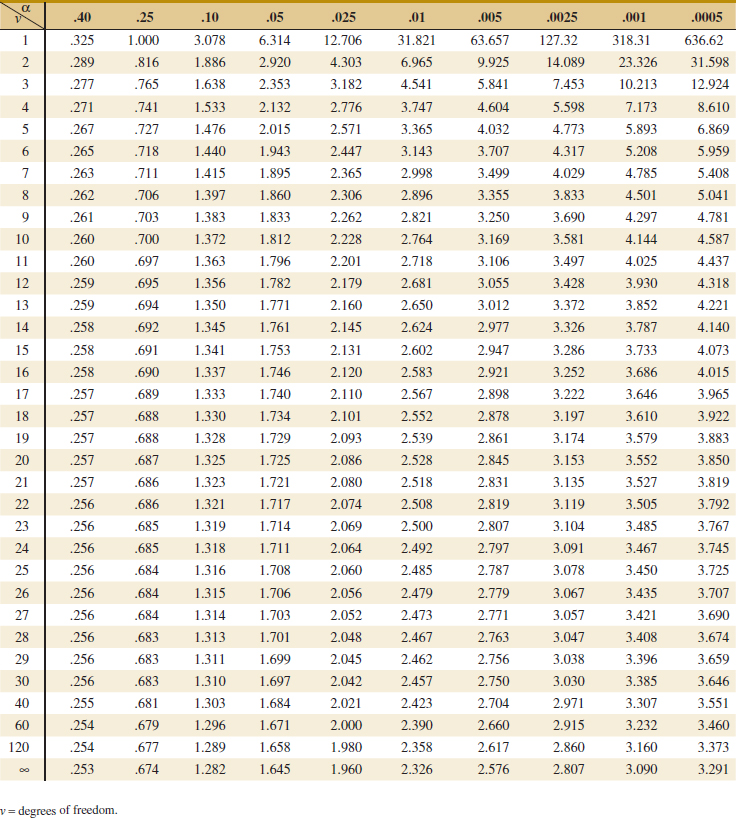
![]() TABLE • V Percentage Points tα,v of the t Distribution
TABLE • V Percentage Points tα,v of the t Distribution
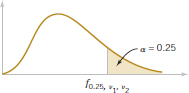
![]() TABLE • VI Percentage Points fα,ν1,ν2 of the F Distribution
TABLE • VI Percentage Points fα,ν1,ν2 of the F Distribution
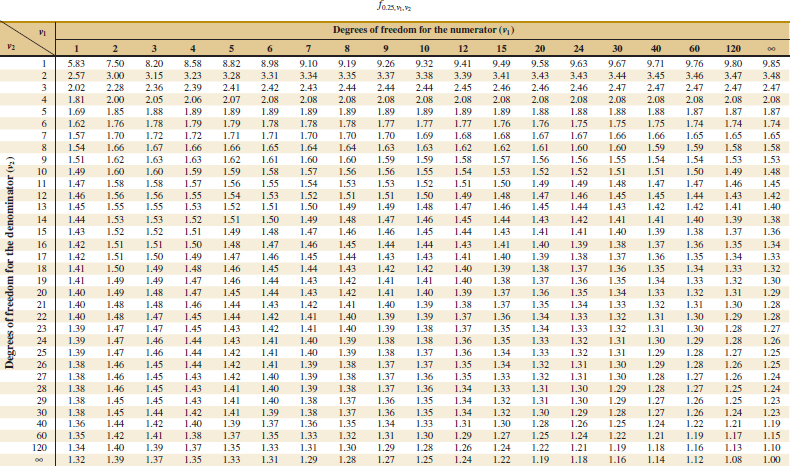


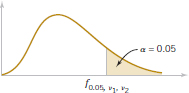
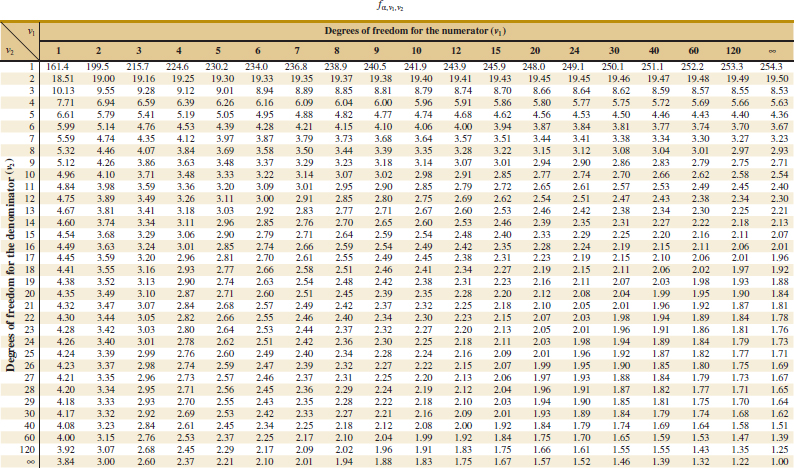

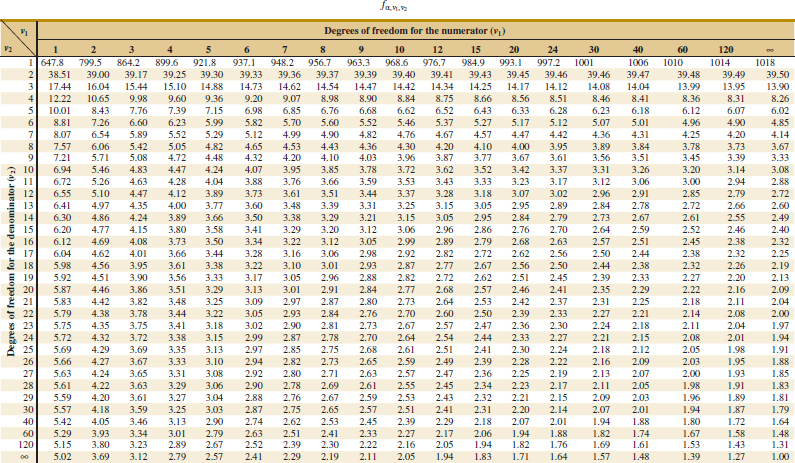
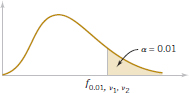
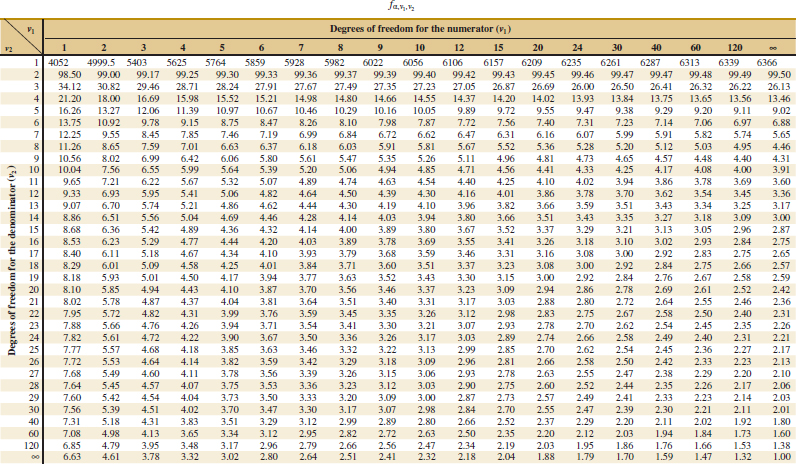
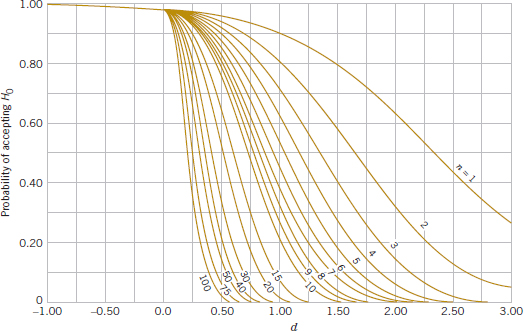
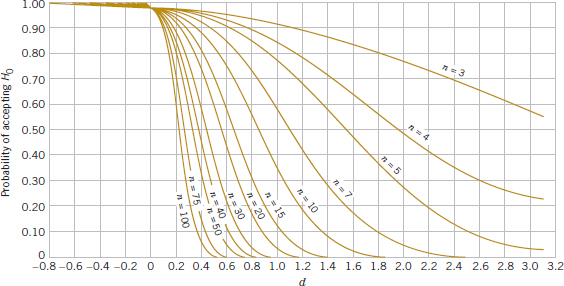
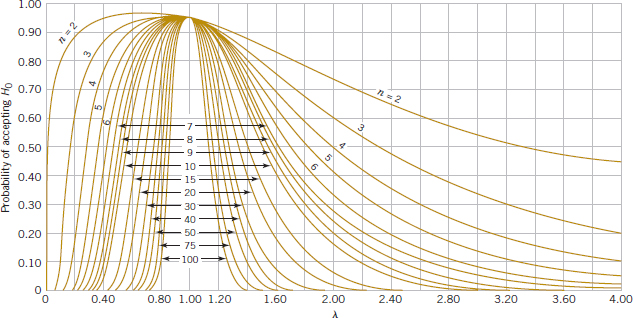
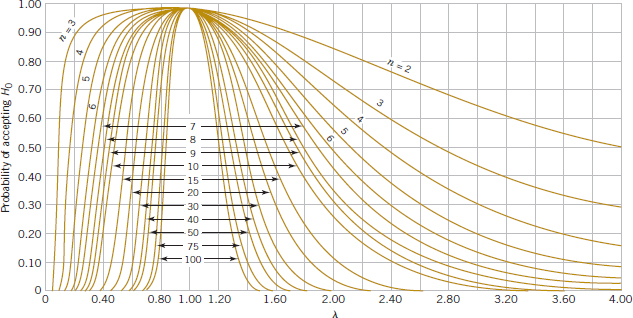
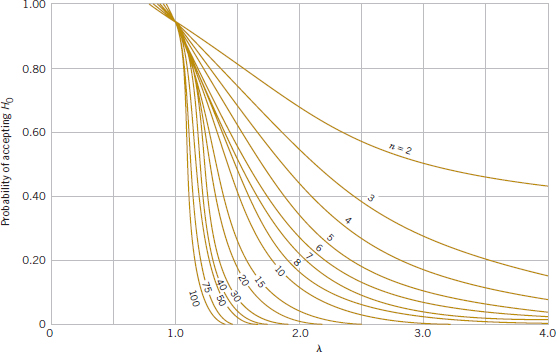
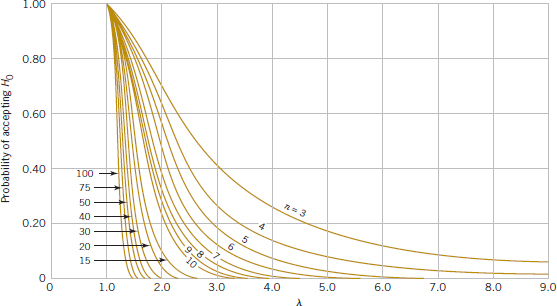
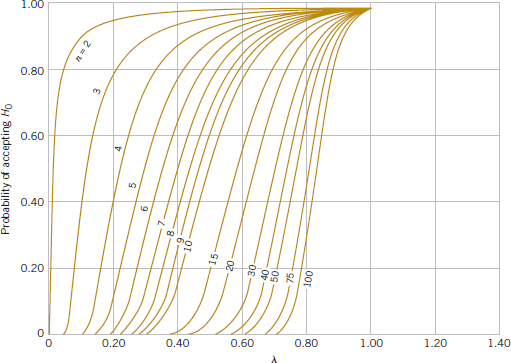
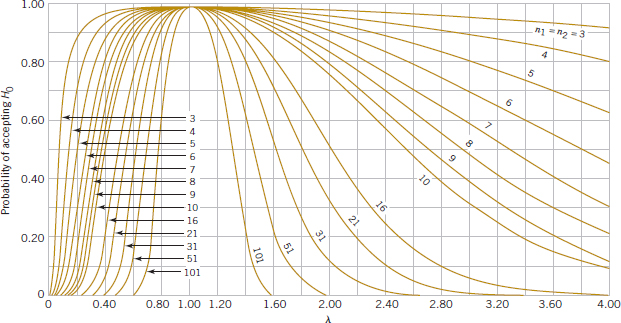
Chart • VII Operating Characteristic Curves
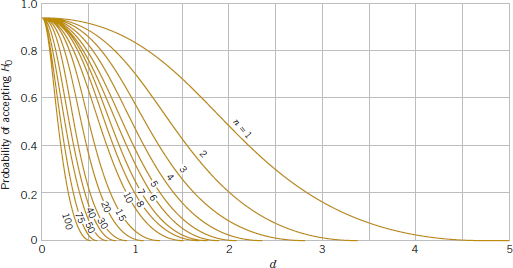
(a) O.C. curves for different values of n for the two-sided normal test for a level of significance α = 0.05.
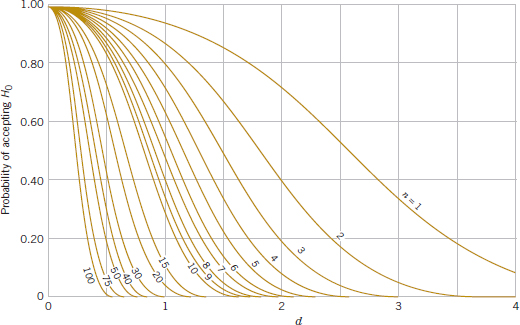
(b) O.C. curves for different values of n for the two-sided normal test for a level of significance α = 0.01.
Source: Charts VIa, e, f, k, m, and q are reproduced with permission from “Operating Characteristics for the Common Statistical Tests of Significance,” by C. L. Ferris, F. E. Grubbs, and C. L. Weaver, Annals of Mathematical Statistics, June 1946.
Charts VIb, c, d, g, h, i, j, l, n, o, p, and r are reproduced with permission from Engineering Statistics, 2nd Edition, by A. H. Bowker and G. J. Lieberman, Prentice-Hall, 1972.
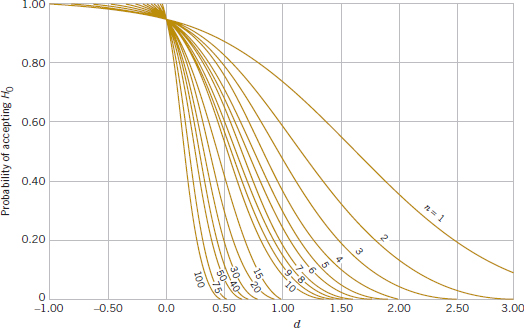
(c) O.C. curves for different values of n for the one-sided normal test for a level of significance α = 0.05.
(d) O.C. curves for different values of n for the one-sided normal test for a level of significance α = 0.01.
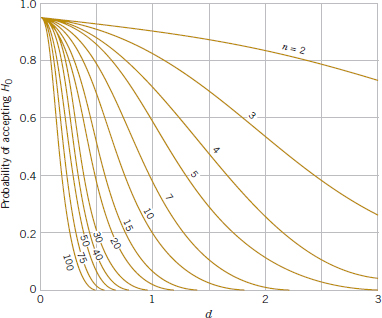
(e) O.C. curves for different values of n for the two-sided t-test for a level of significance α = 0.05.
(f) O.C. curves for different values of n for the two-sided t-test for a level of significance α = 0.01.
(g) O.C. curves for different values of n for the one-sided t-test for a level of significance α = 0.05.
(h) O.C. curves for different values of n for the one-sided t-test for a level of significance α = 0.01.
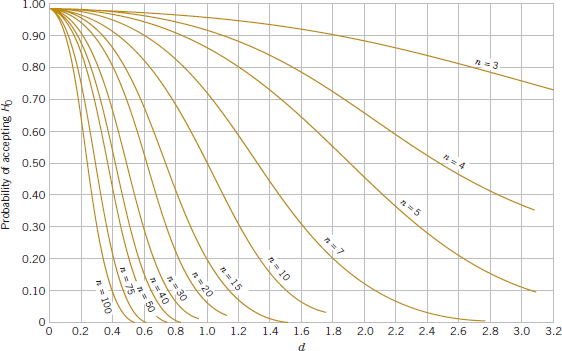
(i) O.C. curves for different values of n for the two-sided chi-square test for a level of significance α = 0.05.
(j) O.C. curves for different values of n for the two-sided chi-square test for a level of significance α = 0.01.
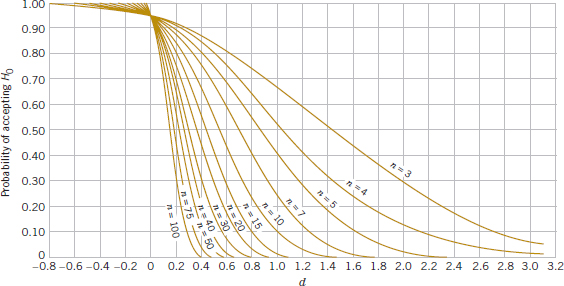
(k) O.C. curves for different values of n for the one-sided (upper-tail) chi-square test for a level of significance α = 0.05.
(l) O.C. curves for different values of n for the one-sided (upper-tail) chi-square test for a level of significance α = 0.01.
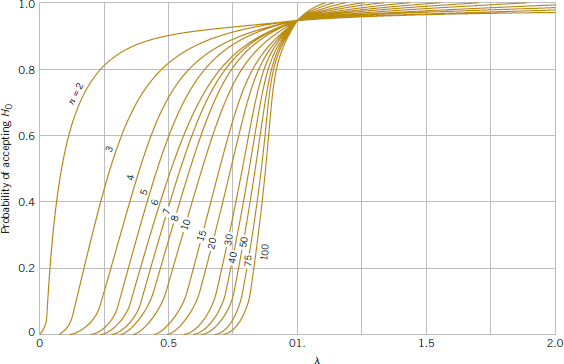
(m) O.C. curves for different values of n for the one-sided (lower-tail) chi-square test for a level of significance α = 0.05.
(n) O.C. curves for different values of n for the one-sided (lower-tail) chi-square test for a level of significance α = 0.01.
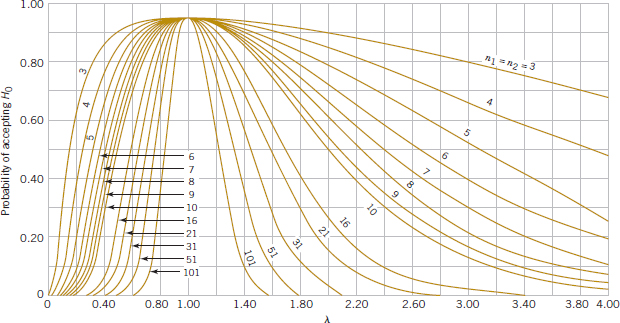
(o) O.C. curves for different values of n for the two-sided F-test for a level of significance α = 0.05.
(p) O.C. curves for different values of n for the two-sided F-test for a level of significance α = 0.01.
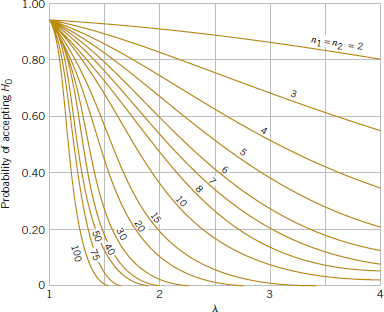
(q) O.C. curves for different values of n for the one-sided F-test for a level of significance α = 0.05.
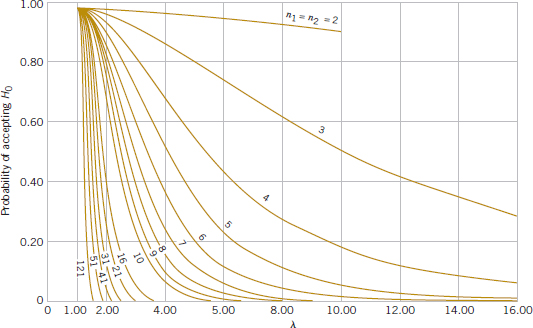
(r) O.C. curves for different values of n for the one-sided F-test for a level of significance α = 0.01.
![]() TABLE • VIII Critical Values for the Sign Test
TABLE • VIII Critical Values for the Sign Test
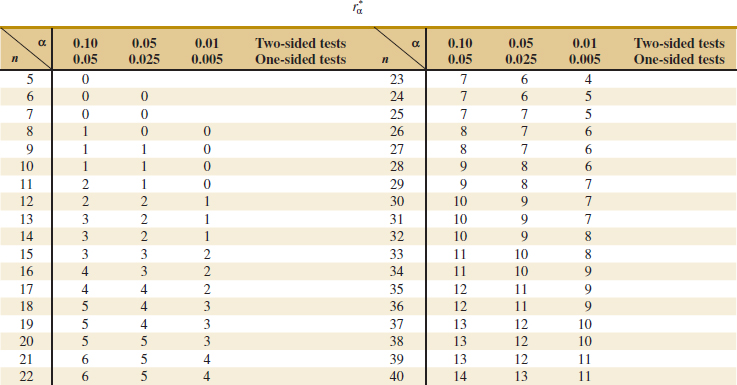
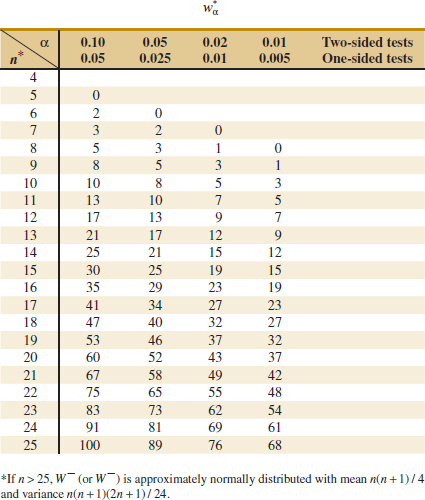
![]() TABLE • IX Critical Values for the Wilcoxon Signed-Rank Test
TABLE • IX Critical Values for the Wilcoxon Signed-Rank Test
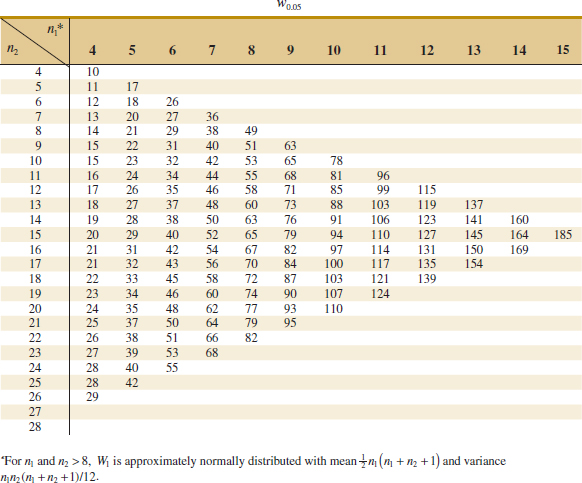
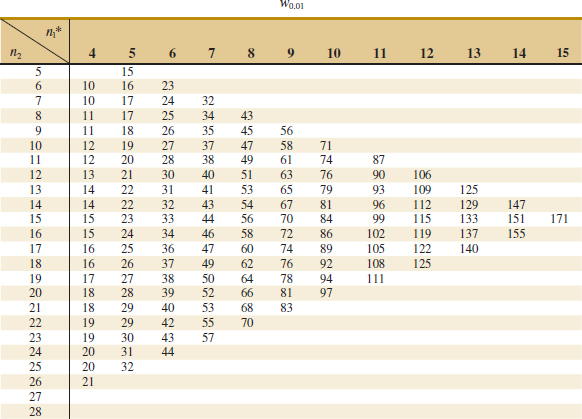
![]() TABLE • X Critical Values for the Wilcoxon Rank-Sum Test
TABLE • X Critical Values for the Wilcoxon Rank-Sum Test
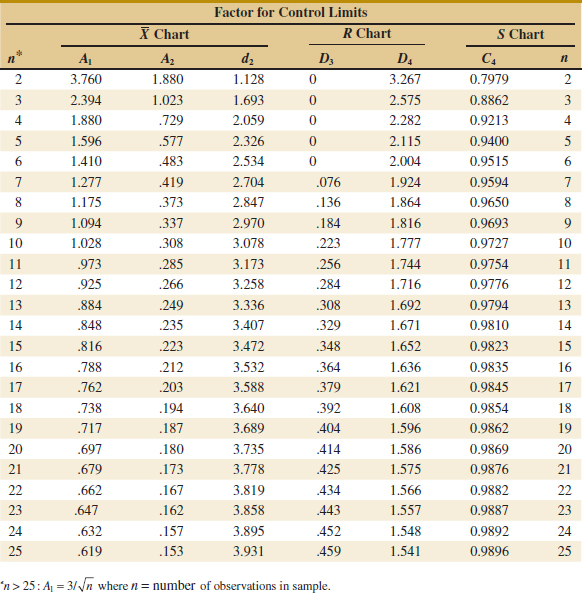
![]() TABLE • XI Factors for Constructing Variables Control Charts
TABLE • XI Factors for Constructing Variables Control Charts
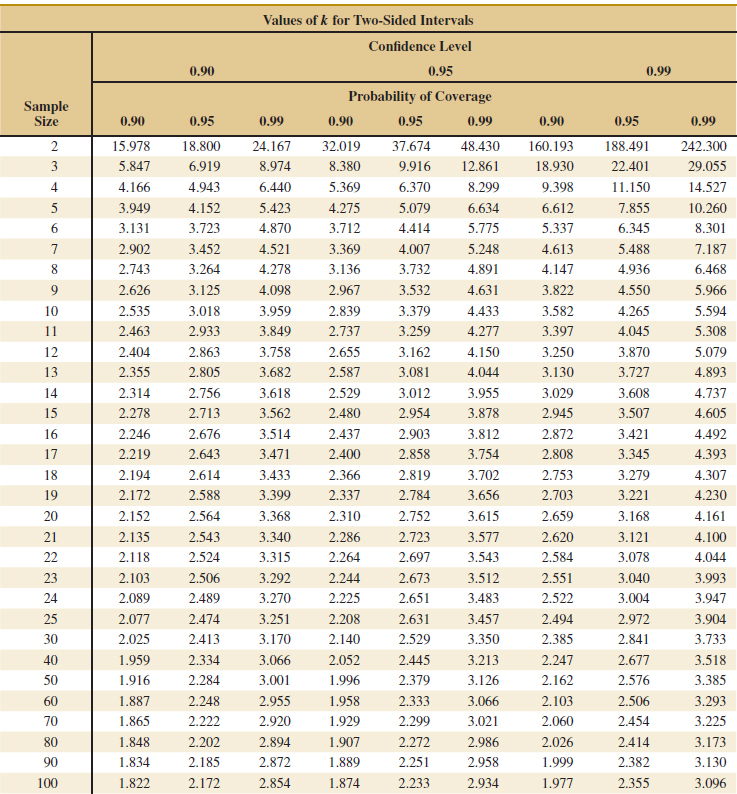
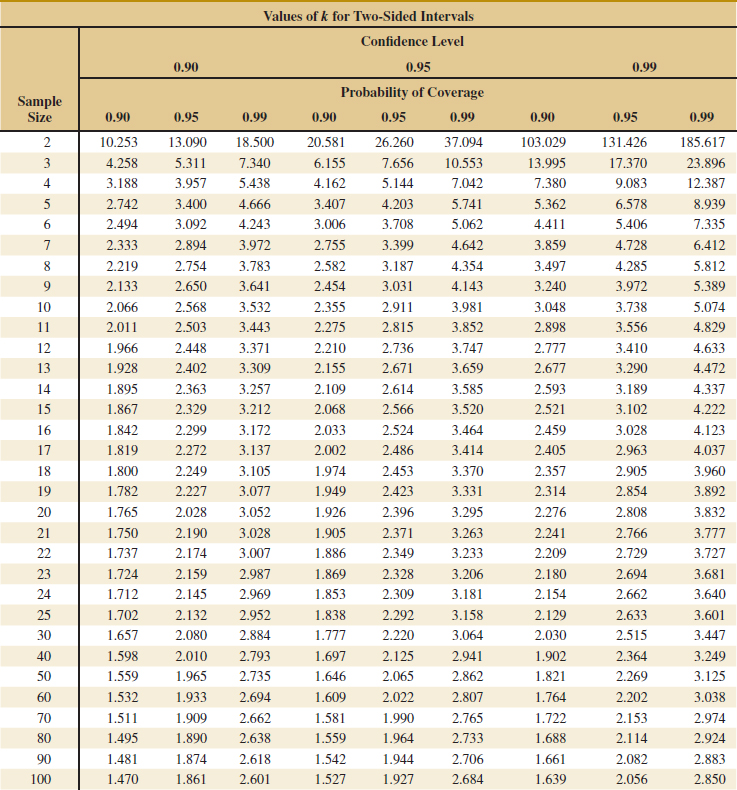
![]() TABLE • XII Factors for Tolerance Intervals
TABLE • XII Factors for Tolerance Intervals