Preface
INTENDED AUDIENCE
This is an introductory textbook for a first course in applied statistics and probability for undergraduate students in engineering and the physical or chemical sciences. These individuals play a significant role in designing and developing new products and manufacturing systems and processes, and they also improve existing systems. Statistical methods are an important tool in these activities because they provide the engineer with both descriptive and analytical methods for dealing with the variability in observed data. Although many of the methods we present are fundamental to statistical analysis in other disciplines, such as business and management, the life sciences, and the social sciences, we have elected to focus on an engineering-oriented audience. We believe that this approach will best serve students in engineering and the chemical/physical sciences and will allow them to concentrate on the many applications of statistics in these disciplines. We have worked hard to ensure that our examples and exercises are engineering- and science-based, and in almost all cases we have used examples of real data—either taken from a published source or based on our consulting experiences.
We believe that engineers in all disciplines should take at least one course in statistics. Unfortunately, because of other requirements, most engineers will only take one statistics course. This book can be used for a single course, although we have provided enough material for two courses in the hope that more students will see the important applications of statistics in their everyday work and elect a second course. We believe that this book will also serve as a useful reference.
We have retained the relatively modest mathematical level of the first five editions. We have found that engineering students who have completed one or two semesters of calculus and have some knowledge of matrix algebra should have no difficulty reading all of the text. It is our intent to give the reader an understanding of the methodology and how to apply it, not the mathematical theory. We have made many enhancements in this edition, including reorganizing and rewriting major portions of the book and adding a number of new exercises.
ORGANIZATION OF THE BOOK
Perhaps the most common criticism of engineering statistics texts is that they are too long. Both instructors and students complain that it is impossible to cover all of the topics in the book in one or even two terms. For authors, this is a serious issue because there is great variety in both the content and level of these courses, and the decisions about what material to delete without limiting the value of the text are not easy. Decisions about which topics to include in this edition were made based on a survey of instructors.
Chapter 1 is an introduction to the field of statistics and how engineers use statistical methodology as part of the engineering problem-solving process. This chapter also introduces the reader to some engineering applications of statistics, including building empirical models, designing engineering experiments, and monitoring manufacturing processes. These topics are discussed in more depth in subsequent chapters.
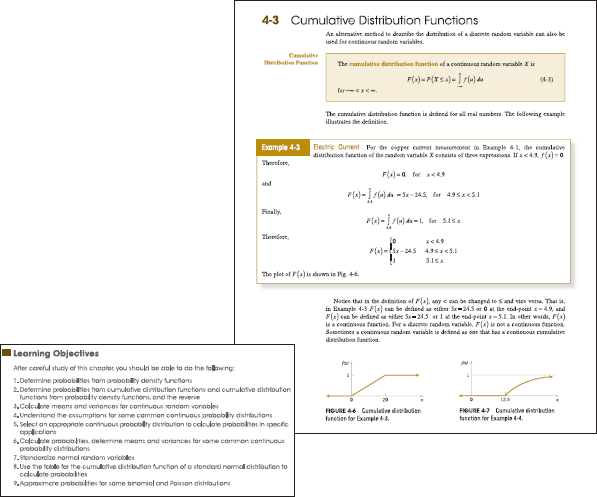
Chapters 2, 3, 4, and 5 cover the basic concepts of probability, discrete and continuous random variables, probability distributions, expected values, joint probability distributions, and independence. We have given a reasonably complete treatment of these topics but have avoided many of the mathematical or more theoretical details.
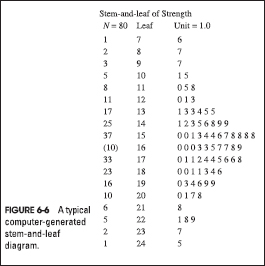
Chapter 6 begins the treatment of statistical methods with random sampling; data summary and description techniques, including stem-and-leaf plots, histograms, box plots, and probability plotting; and several types of time series plots. Chapter 7 discusses sampling distributions, the central limit theorem, and point estimation of parameters. This chapter also introduces some of the important properties of estimators, the method of maximum likelihood, the method of moments, and Bayesian estimation.
Chapter 8 discusses interval estimation for a single sample. Topics included are confidence intervals for means, variances or standard deviations, proportions, prediction intervals, and tolerance intervals. Chapter 9 discusses hypothesis tests for a single sample. Chapter 10 presents tests and confidence intervals for two samples. This material has been extensively rewritten and reorganized. There is detailed information and examples of methods for determining appropriate sample sizes. We want the student to become familiar with how these techniques are used to solve real-world engineering problems and to get some understanding of the concepts behind them. We give a logical, heuristic development of the procedures rather than a formal, mathematical one. We have also included some material on nonparametric methods in these chapters.
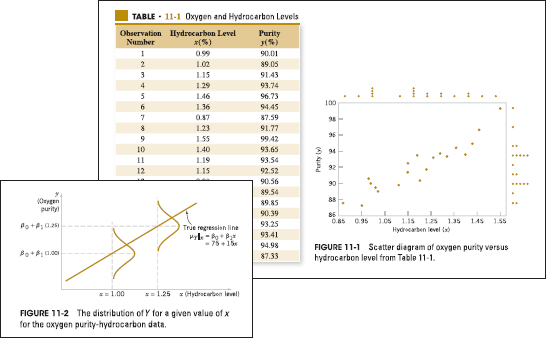
Chapters 11 and 12 present simple and multiple linear regression including model adequacy checking and regression model diagnostics and an introduction to logistic regression. We use matrix algebra throughout the multiple regression material (Chapter 12) because it is the only easy way to understand the concepts presented. Scalar arithmetic presentations of multiple regression are awkward at best, and we have found that undergraduate engineers are exposed to enough matrix algebra to understand the presentation of this material.
Chapters 13 and 14 deal with single- and multifactor experiments, respectively. The notions of randomization, blocking, factorial designs, interactions, graphical data analysis, and fractional factorials are emphasized. Chapter 15 introduces statistical quality control, emphasizing the control chart and the fundamentals of statistical process control.
WHAT'S NEW IN THIS EDITION
We received much feedback from users of the fifth edition of the book, and in response we have made substantial changes in this new edition.
- Because computer intensive methods are so important in the modern use of statistics, we have added material on the bootstrap and its use in constructing confidence intervals.
- We have increased the emphasis on the use of P-value in hypothesis testing. Many sections of several chapters were rewritten to reflect this.
- Many sections of the book have been edited and rewritten to improve the explanations and try to make the concepts easier to understand.
- The introductory chapter on hypothesis testing now includes coverage of equivalence testing, a technique widely used in the biopharmaceutical industry, but which has widespread applications in other areas.
- Combining P-values when performing mutiple tests is incuded.
- Decision theory is briefly introduced in Chapter 15.
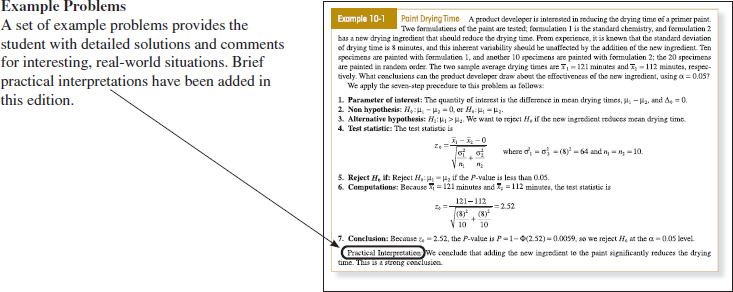
- We have added brief comments at the end of examples to emphasize the practical interpretations of the results.
- Many new examples and homework exercises have been added.
FEATURED IN THIS BOOK
Definitions, Key Concepts, and Equations
Throughout the text, definitions and key concepts and equations are highlighted by a box to emphasize their importance.
Learning Objectives
Learning Objectives at the start of each chapter guide the students in what they are expected to take away from this chapter and serve as a study reference.
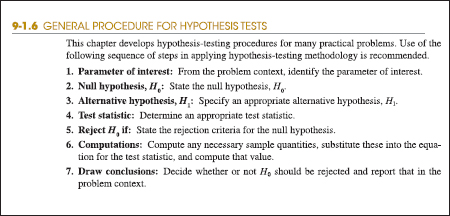
Seven-Step Procedure for Hypothesis Testing
The text introduces a sequence of seven steps in applying hypothesis-testing methodology and explicitly exhibits this procedure in examples.
Numerous figures throughout the text illustrate statistical concepts in multiple formats.
Computer Output
Example throughout the book, use computer output to illustrate the role of modern statistical software.
Each chapter has an extensive collection of exercises, including end-of-section exercises that emphasize the material in that section, supplemental exercises at the end of the chapter that cover the scope of chapter topics and require the student to make a decision about the approach they will use to solve the problem, and mind-expanding exercises that often require the student to extend the text material somewhat or to apply it in a novel situation. Answers are provided to most odd-numbered exercises in Appendix C in the text, and the WileyPLUS online learning environment includes for students complete detailed solutions to selected exercises.
Important Terms and Concepts
At the end of each chapter is a list of important terms and concepts for an easy self-check and study tool.

STUDENT RESOURCES
- Data Sets Data sets for all examples and exercises in the text. Visit the student section of the book Web site at www.wiley.com/college/montgomery to access these materials.
- Student Solutions Manual Detailed solutions for selected problems in the book. The Student Solutions Manual may be purchased from the Web site at www.wiley.com/college/montgomery.
INSTRUCTOR RESOURCES
The following resources are available only to instructors who adopt the text:
- Solutions Manual All solutions to the exercises in the text.
- Data Sets Data sets for all examples and exercises in the text.
- Image Gallery of Text Figures
- PowerPoint Lecture Slides
- Section on Logistic Regression
These instructor-only resources are password-protected. Visit the instructor section of the book Web site at www.wiley.com/college/montgomery to register for a password to access these materials.
COMPUTER SOFTWARE
We have used several different packages, including Excel, to demonstrate computer usage. Minitab can be used for most exercises. A student version of Minitab is available as an option to purchase in a set with this text. Student versions of software often do not have all the functionality that full versions do. Consequently, student versions may not support all the concepts presented in this text. If you would like to adopt for your course the set of this text with the student version of Minitab, please contact your local Wiley representative at www.wiley.com/college/rep.
Alternatively, students may find information about how to purchase the professional version of the software for academic use at www.minitab.com.
WileyPLUS
This online teaching and learning environment integrates the entire digital textbook with the most effective instructor and student resources to fit every learning style.
With WileyPLUS:
- Students achieve concept mastery in a rich, structured environment that's available 24/7.
- Instructors personalize and manage their course more effectively with assessment, assignments, grade tracking, and more.
WileyPLUS can complement your current textbook or replace the printed text altogether.
For Students
Personalize the learning experience
Different learning styles, different levels of proficiency, different levels of preparation—each of your students is unique. WileyPLUS empowers them to take advantage of their individual strengths:
- Students receive timely access to resources that address their demonstrated needs, and get immediate feedback and remediation when needed.
- Integrated, multi-media resources—including audio and visual exhibits, demonstration problems, and much more—provide multiple study-paths to fit each student's learning preferences and encourage more active learning.
- WileyPLUS includes many opportunities for self-assessment linked to the relevant portions of the text. Students can take control of their own learning and practice until they master the material.
For Instructors
Personalize the teaching experience
WileyPLUS empowers you with the tools and resources you need to make your teaching even more effective:
- You can customize your classroom presentation with a wealth of resources and functionality from PowerPoint slides to a database of rich visuals. You can even add your own materials to your WileyPLUS course.
- With WileyPLUS you can identify those students who are falling behind and intervene accordingly, without having to wait for them to come to office hours.
- WileyPLUS simplifies and automates such tasks as student performance assessment, making assignments, scoring student work, keeping grades, and more.
COURSE SYLLABUS SUGGESTIONS
This is a very flexible textbook because instructors' ideas about what should be in a first course on statistics for engineers vary widely, as do the abilities of different groups of students. Therefore, we hesitate to give too much advice, but will explain how we use the book.
We believe that a first course in statistics for engineers should be primarily an applied statistics course, not a probability course. In our one-semester course we cover all of Chapter 1 (in one or two lectures); overview the material on probability, putting most of the emphasis on the normal distribution (six to eight lectures); discuss most of Chapters 6 through 10 on confidence intervals and tests (twelve to fourteen lectures); introduce regression models in Chapter 11 (four lectures); give an introduction to the design of experiments from Chapters 13 and 14 (six lectures); and present the basic concepts of statistical process control, including the Shewhart control chart from Chapter 15 (four lectures). This leaves about three to four periods for exams and review. Let us emphasize that the purpose of this course is to introduce engineers to how statistics can be used to solve real-world engineering problems, not to weed out the less mathematically gifted students. This course is not the “baby math-stat” course that is all too often given to engineers.
If a second semester is available, it is possible to cover the entire book, including much of the supplemental material, if appropriate for the audience. It would also be possible to assign and work many of the homework problems in class to reinforce the understanding of the concepts. Obviously, multiple regression and more design of experiments would be major topics in a second course.
USING THE COMPUTER
![]()
In practice, engineers use computers to apply statistical methods to solve problems. Therefore, we strongly recommend that the computer be integrated into the class. Throughout the book we have presented typical example of the output that can be obtained with modern statistical software. In teaching, we have used a variety of software packages, including Minitab, Statgraphics, JMP, and Statistica. We did not clutter up the book with operational details of these different packages because how the instructor integrates the software into the class is ultimately more important than which package is used. All text data are available in electronic form on the textbook Web site. In some chapters, there are problems that we feel should be worked using computer software. We have marked these problems with a special icon in the margin.
In our own classrooms, we use the computer in almost every lecture and demonstrate how the technique is implemented in software as soon as it is discussed in the lecture. Student versions of many statistical software packages are available at low cost, and students can either purchase their own copy or use the products available through the institution. We have found that this greatly improves the pace of the course and student understanding of the material.
Users should be aware that final answers may differ slightly due to different numerical precision and rounding protocols among softwares.
ACKNOWLEDGMENTS
We would like to express our grateful appreciation to the many organizations and individuals who have contributed to this book. Many instructors who used the previous editions provided excellent suggestions that we have tried to incorporate in this revision.
We would like to thank the following who assisted in contributing to and/or reviewing material for the WileyPLUS course:
Michael DeVasher, Rose-Hulman Institute of Technology
Craig Downing, Rose-Hulman Institute of Technology
Julie Fortune, University of Alabama in Huntsville
Rubin Wei, Texas A&M University
We would also like to thank the following for their assistance in checking the accuracy and completeness of the exercises and the solutions to exercises.
Dr. Abdelaziz Berrado
Dr. Connie Borror
Aysegul Demirtas
Kerem Demirtas
Patrick Egbunonu, Sindhura Gangu
James C. Ford
Dr. Alejandro Heredia-Langner
Dr. Jing Hu
Dr. Busaba Laungrungrong
Dr. Fang Li
Dr. Nuttha Lurponglukana
Sarah Streett Yolande Tra
Dr. Lora Zimmer
We are also indebted to Dr. Smiley Cheng for permission to adapt many of the statistical tables from his excellent book (with Dr. James Fu), Statistical Tables for Classroom and Exam Room. Wiley, Prentice Hall, the Institute of Mathematical Statistics, and the editors of Biometrics allowed us to use copyrighted material, for which we are grateful.
Douglas C. Montgomery
George C. Runger