
CHAPTER 3
Examining Some Key Electronic Components |  |
MANY DIFFERENT TYPES OF ELECTRONIC components are available to you as an electronics hobbyist, and each has its own particular characteristics. This chapter introduces you to some of the common electronic components.
To build electronic devices, you connect components together in a particular way to create an electronic circuit like the one shown in the circuit diagram in Figure 3-1. This type of diagram is also sometimes called a schematic.

FIGURE 3-1 A typical circuit diagram
A circuit diagram uses various circuit symbols that represent each of the electronic components used in the device; these components are linked together by lines that represent the electrical wires that join the individual components together. As you work through this book you will soon learn how to read and understand this type of circuit diagram. Schematic symbols are international symbols, and when you master them, you will be able to understand any device schematic created by anybody anywhere in the world. When you learn to read circuit diagrams, you’re joining a special club.
Wires that are joined or attached together look like this on a circuit diagram:
Wires that are not joined together (overlapping wires) are shown like this on a circuit diagram:

Power Supply
Before you learn about some of the common electronic components, you need to understand the fundamentals of how electricity flows through an electronic circuit. If you read Chapter 2, you know that every electronic circuit needs a power supply to make it work; the power supply that you will be using in each of the experiments is a common low-voltage household battery, the same type that you use to power your TV remote control.
To understand how electricity flows in an electronic circuit, take a look at a basic circuit diagram shown in Figure 3-2. The diagram shows the circuit symbol for a battery on the left side (B1), which is connected to a rectangular block on the right side, which represents the electronic circuitry. The arrows show the direction of current flow through the circuit.

FIGURE 3-2 A basic circuit diagram showing the conventional flow of electricity
A battery power source is packed with electrons, tiny subatomic particles that are determined to escape. When a battery is connected to a circuit using some interconnecting wire, the electrons inside the battery are able to flow out of one side of the battery, around the electronic circuit, and then back to the other side of the battery. So long as this continuous electronic circuit is unbroken, the flow of electricity continues in a never-ending loop.
 INTERESTING FACT
Diagrams showing conventional current flow show electricity flowing from the positive side (+) to the negative side (–) of the battery. In reality, electrons flow from the negative side of a battery to its positive side. The apparent reason for why circuit diagrams show current flow from positive to negative is that in the early days of electricity being discovered it was assumed that current flowed this way, and circuit diagrams have remained this way ever since.
Two main measurements relate to a power supply: current and voltage.
The amount of electrons that flow through an electronic circuit determines the amount of current that flows. Current is measured in amperes, or amps, and the measurement is shown as a symbol A. The experiments in this book have a low-current consumption, drawing less than 100 milliamps (0.1 amp); 1000 milliamps equals 1 amp. You will see that electronic calculations and circuit diagrams identify current with the letter I, and the arrows on the circuit diagram identify the direction of the current flow.
Voltage is the value of a battery and is measured in volts. This is also known as the potential difference, because this equals the energy difference between two points. Volts are shown using the symbol V on circuit diagrams and in electronic formulae.
Famous Scientists
The measurement of current is the ampere, which was named after the French physicist Andre Marie Ampere (shown left) who was born in 1775. The measurement of potential difference is the volt, which was named after the Italian physicist Alessandro Volta (shown right) who was born in 1745.

You will be using various voltages to power each of your experiments; these voltages are created by connecting multiple 1.5 volt (AA type) batteries together in a series, as shown in Figure 3-3. Each 1.5 volt battery has two different poles, one at each end, and these are marked as positive (+) and negative (–).

FIGURE 3-3 Batteries connected in series increase the overall voltage. Connecting in series means connecting the batteries end to end, with the positive (+) pole of one battery connected to the negative (–) pole of the next battery
So, for example, if you connect two 1.5 volt batteries together in series, you can create a 3 volt power supply. And if you connected three 1.5 volt batteries together in series, you would create 4.5 volts of power.
The easiest way to connect batteries together like this to create different voltages is to use special battery holders that are prewired and allow you to fit batteries into them. A selection of battery holders is shown in Figure 3-4. You will be using battery holders in your experiments, which are easily obtainable from electronics supply companies, or you may be able to salvage some from broken electronic devices.

FIGURE 3-4 Various battery holder configurations
Switches
Switches let you either make or break an electronic circuit—that is, they let you either switch on or off the electricity flow in a circuit. Switches are available in various configurations and can be used to switch on or off your project or to make something happen. A selection of switches is shown in Figure 3-5.

FIGURE 3-5 A selection of switches
Some switches are classed as normally open; this means that in the switch’s normal state, the contacts inside it are open (not touching each other). When you press or activate the switch, the contact closes, which activates the circuit in some way. The circuit symbol for a normally open switch that could be used to switch a circuit on and off looks like this:
The experimental circuits in this book don’t use this type of switch, but if you decide to make your experiments more permanent, you could include one of these switches just after the positive battery connection (shown in Figure 3-2), so that you can switch the circuit off when it is not being used.
The circuit symbol for a push-button switch, which could be used as part of a keypad, for example, looks like this:
This type of switch is called a momentary switch, because the circuit closes when you press the switch and then opens when you take your finger off the switch.
Some switches are classed as normally closed; this means that in the switch’s normal state, the contacts inside the switch are closed (touching each other), so when you press or activate the switch, the contact opens, which deactivates the circuit. You won’t be using this type of switch in any of the experiments in this book.
Resistor
A resistor, like the examples shown in Figure 3-6, is a component that restricts the flow of electricity and can therefore reduce the amount of current that flows in a circuit. You might be wondering why you would want to restrict the amount of electricity flow in a circuit. One reason is because some components can be damaged if the current flow is too high—you will discover more about this as you read through the book.

FIGURE 3-6 A selection of resistors
A resistor has two leads, and its value is measured in ohms. The symbol for ohms is the Greek letter Omega (Ω). In electronic calculations, the letter R represents resistance.
Resistors are available in many different values, from 1 ohm up to many millions of ohms. There is a range of resistors called E12, and these are available in 85 different values. The values of a resistor are normally shown in the following formats:
Kilo-ohms = KΩ 1KΩ = 1000 ohms
Mega-ohms = MΩ 1MΩ = 1 million ohms
Famous Scientists
 The measurement of a resistor, ohms, is named after the German physicist Georg Simon Ohm who was born in 1787. Ohm also discovered the formula called Ohm’s Law, which you will read about in Chapter 4.
Two types of circuit symbols can be used for a resistor in a circuit diagram, as shown here:
There are slight differences in some circuit symbols depending on which country you live in. In the preceding example of the resistor, both symbol styles represent the same type of component. The style on the left is used in the circuit diagrams in this book.
Calculating the Value of a Resistor
You can work out the value of a resistor using its color code; normally, four (sometimes five) color bands encircle the resistor, and you can calculate the value of the resistor by reading the color bands and working out their value.
Here’s how to read the first three values of a resistor with four color bands:
• The first color band of a resistor denotes the “tens” value of the resistor.
• The second color band of a resistor denotes the “units” value.
• The third color band is the multiplier.
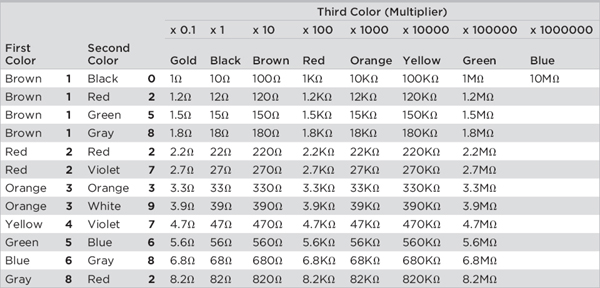
So, for example, if the first three bands of a resistor are brown, black, and red, you can see by looking at Table 3-1 that you take the values 1 (brown) and 0 (black) to make 10. You then multiply this number by the third band multiplier, which is 100 (red). This gives us a value of 1000Ω, which is actually 1KΩ.
TABLE 3-1 Resistor Color Codes for E12 Type Resistors with Four Color Bands
Finally, the fourth color band denotes the tolerance of the resistor:
Brown = ±1% Red = ±2%
Gold = ±5% Silver = ±10%
So, for example, if the fourth band of the example resistor is gold, the resistor has a manufacturer’s tolerance of ±5%. This means that the value of the resistor could actually be
1KΩ + 5% tolerance = 1050Ω
Or it could be
1KΩ – 5% tolerance = 950Ω
If it is not easy to read the color code of a resistor, you can always check its value by using your multimeter. You can do this by setting your multimeter to a resistance setting, and then connecting the positive lead to one lead of the resistor and the negative lead to the other lead of the resistor, like the photograph in Figure 3-7.
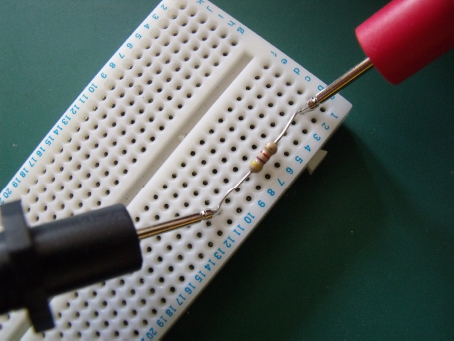
FIGURE 3-7 Using the probes of a multimeter to check the value of a resistor
It doesn’t matter which way around you connect the leads, because the resistance can be measured either way around. If your meter is not an auto-ranging meter and you don’t see a reading on the meter display, you need to switch the meter setting to a different resistance range until the meter’s display shows the resistance value. You can see this in Figure 3-8, which shows a 4.7KΩ resistor being measured using a multimeter, and you can see that in reality the meter is showing that the resistor has an actual value of 4.61KΩ. Note that the dial is set to point to 20K in the Ω section of the multimeter. This means that the meter is set for you to measure a resistor with a value up to 20KΩ.
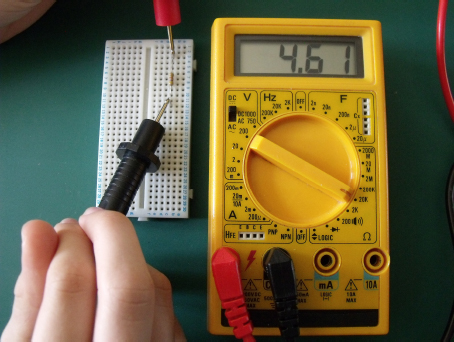
FIGURE 3-8 Make sure that the multimeter is set to read resistance.
Resistors are also available in various power (wattage) ratings, and it is important that the correct wattage rating is used. The required wattage rating of the resistors used in this book are outlined in the parts list in each experiment.
Variable Resistor
A variable resistor is also sometimes known as a potentiometer or a preset. It works like a resistor to restrict the flow of electricity, but the resistance value of the component can be altered from 0Ω to its maximum resistance value by you manually adjusting it. This can normally be performed by rotating the central part of the component using a flat bladed screwdriver. Other types of variable resistor have a metal or plastic shaft that allows you to rotate the central part of the component using your fingers. A selection of three different types of circuit board–mounted variable resistors is shown in Figure 3-9. The top line shows the tops of the resistors, and the bottom line shows the underside views of the same variable resistors; you can see that normally this component has three connection leads: two on one end and the third on the opposite end.

FIGURE 3-9 A selection of variable resistors
Like fixed resistors, variable resistors are available in many different ohm and wattage ratings. You will have probably already used variable resistors at home—for example, these devices are used to change the volume on your home stereo.
Two types of circuit symbols can be used for a variable resistor in a circuit diagram, as shown here:
If you fit a 1KΩ variable resistor to a piece of breadboard and measure the resistance across the two end connections, as shown in Figure 3-10, your multimeter should read around 1KΩ (note that the actual meter reading is not shown in this photograph).
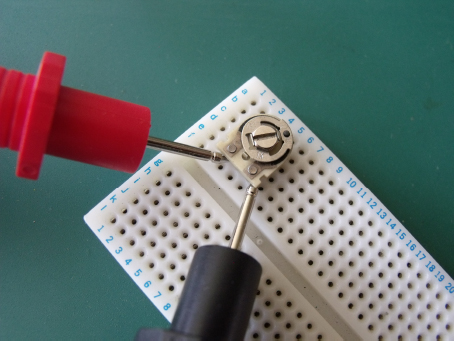
FIGURE 3-10 Measuring the two outer pins will show the overall resistance value on your multimeter (make sure that your meter is set to read resistance).
If you keep one end of the multimeter lead connected to one of the outer pins and connect the other multimeter lead to the center pin, you can see that adjusting the position of the central section of the variable resistor alters the value of the reading from 0 to 1KΩ. The photograph shown in Figure 3-11 shows that the central position of the variable resistor is at the 7 o’clock position and the meter shows a resistance reading of 0.7KΩ (which is 700Ω).
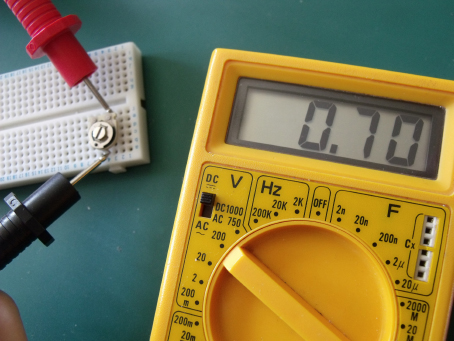
FIGURE 3-11 Adjusting the position of the spindle varies the resistance value.
Light-Dependent Resistor
A light-dependent resistor (LDR) works like a normal resistor, but its resistance value changes depending on the amount of light that shines on it. This type of device can be used in circuits to switch something when the light changes from light to dark, or from dark to light. They are often used in photographic light meters. Figure 3-12 shows a typical LDR.

FIGURE 3-12 A typical LDR
The circuit symbol for an LDR is shown here:

If you insert an LDR into a piece of breadboard, you can measure the resistance value of the device in the same way you would for a normal fixed resistor. You will also see how the resistance of the device changes whenever you shine a light onto the device or cover it up.
Capacitor
A capacitor is a component that can store an electrical charge and is used mainly to remove unwanted electronic signals in an electronic circuit; or it may be used in timing circuits.
A capacitor is basically two metal plates that are connected to two wire leads; the two plates are insulated from each other by a dielectric, which is normally a plastic film. This sandwich is then rolled up to produce a compact component.
Capacitors can be polarized or non-polarized. The polarized version is called an electrolytic capacitor and must be connected in the circuit so that the positive connection of the capacitor is connected to the positive battery leg of the circuit. Non-polarized capacitors can be connected in a circuit in any direction; it doesn’t matter which way around it is connected.
Figure 3-13 shows a selection of various capacitors and demonstrates the different shapes and sizes of these components. The top row are non-electrolytic (non-polarized) capacitors, and the bottom row are electrolytic capacitors.

FIGURE 3-13 A selection of capacitors
The circuit symbol for a non-electrolytic capacitor is shown here:
Two types of circuit symbol can be used for an electrolytic capacitor in a circuit diagram, as shown next:
Capacitance is measured in farads (F), and the common values are as follows:
Picofarads = pF 1pF = 0.000000000001 farad
Nanofarads = nF 1nF = 0.000000001 farad
Microfarads = μF 1μF = 0.000001 farad
Famous Scientists
 The measurement of a capacitor is farad, which is named after the physicist Michael Faraday who was born in 1791. Faraday experimented with electricity and proved the concepts for the operation of an electric motor.
The multimeter that I use has a connection that allows you to plug in a capacitor to measure its value. In Figure 3-14, for example, the meter is showing a capacitance of 30.2nF, though I was measuring a 22nF capacitor at the time. The reason for the difference between the rating and the multimeter measurement is that components have manufacturing tolerances, and this means that they are not always the exact value that is stated on the side of the component. In addition, variances in the temperature can cause changes in the readings, or the multimeter may not always be 100 percent accurate, and this can also contribute to the difference in the reading.

FIGURE 3-14 Some multimeters allow you to measure capacitance.
Some (though uncommon) non-electrolytic capacitors use a color code that is similar (but not the same) to the resistor color coding, and this allows you to identify the value of the capacitor. Electrolytic capacitors do have markings on them that help you identify which lead is positive and which is negative. Capacitors also have a voltage range, and you must make sure that the voltage rating of the capacitor value is higher than the voltage of the circuit.
Diodes
A diode allows electricity to flow in one direction but not the other, and this means that a diode can be used to protect certain parts of a circuit by blocking signals from flowing where they shouldn’t. A selection of diodes is shown in Figure 3-15.
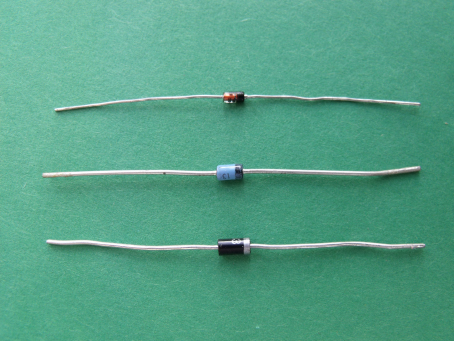
FIGURE 3-15 A selection of diodes. The band around a diode identifies the cathode lead.
The circuit symbol for a diode looks like this:
One leg of a diode is called the anode, and this is normally connected to the positive side of a circuit; this is sometimes shown with a letter A next to it on a circuit diagram. The other leg is called the cathode, and this is connected to the negative side of a circuit and is sometimes shown with a letter C or a K next to it on a circuit diagram. If a diode is connected in a circuit this way, it is said to be in a forward bias, which means that current will flow. If the polarity of the battery is reversed, it is said to be reverse biased, which means that current will not flow.
A diode also has a small voltage drop, which varies from 0.4 to 0.7 volts, depending on whether the diode is made from silicon or germanium.
INTERESTING FACTThere is another type of diode called a Zener diode, as shown in middle of the photograph in Figure 3-15. These devices are manufactured to have a specific voltage drop rating and can be used in circuits where you want something to happen whenever a specific voltage is reached; or they can also be used to create a specific voltage in a circuit. Zener diodes are not covered in this book.
Your multimeter should have a diode setting, which is normally identified by the circuit symbol for a diode. Figure 3-16 shows how you can use your multimeter to test the volt drop of a standard diode.

FIGURE 3-16 Testing a diode with a multimeter
If you were to connect the multimeter probes the other way around, the multimeter would not show any reading, because the diode conducts electricity in one direction only.
Light Emitting Diode (LED)
A light emitting diode (LED) is similar to a standard diode in that it allows current to flow in one direction only; the difference between the two is that the LED also produces a light output when it is forward biased. Various sizes, shapes, and sizes are available, and some display packages contain many LEDs to create number and letter shapes. You may have seen a seven-segment LED display in a digital alarm clock. A selection of LEDs is shown in Figure 3-17.

FIGURE 3-17 A selection of LEDs
The circuit symbol for an LED looks like this:

The symbol looks similar to the symbol for a standard diode, with the addition of the arrows, which indicate that the diode illuminates.
To avoid damaging an LED, you should always wire a resistor in series with it, and make sure that it is connected the correct way around in the circuit. This is explained in more detail in the experiment in Chapter 4.
Figure 3-18 shows a standard 5mm LED that you will be using in the experiments in this book.
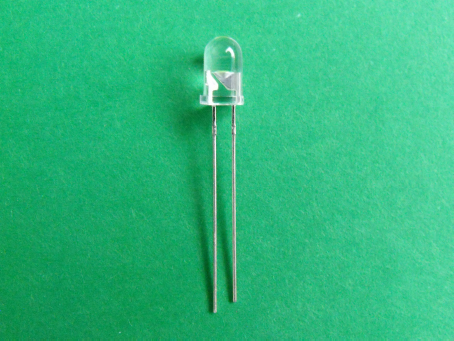
FIGURE 3-18 A typical 5mm LED
The longer lead of the LED is normally the anode (+) connection, and this is connected to the smaller electrode inside the LED. The shorter lead is the cathode (–) connection, and this is usually connected to the larger electrode inside the LED. The shorter cathode (–) lead is also usually positioned next to the flat edge of the LED.
Transistor
A transistor is basically an electronic switch that allows you to switch a large current by applying a smaller current to the device. They are often used inside an audio amplifier in a home sound system, where they can be used to convert a small sound signal into a much louder one. Transistors come in two main types, NPN and PNP, and both types have three pin connections, base, collector, and emitter. Figure 3-19 shows the BC108 and BC178 transistors that are used in the experiments in this book and also the position of its component leads compared to the tab on its metal casing.
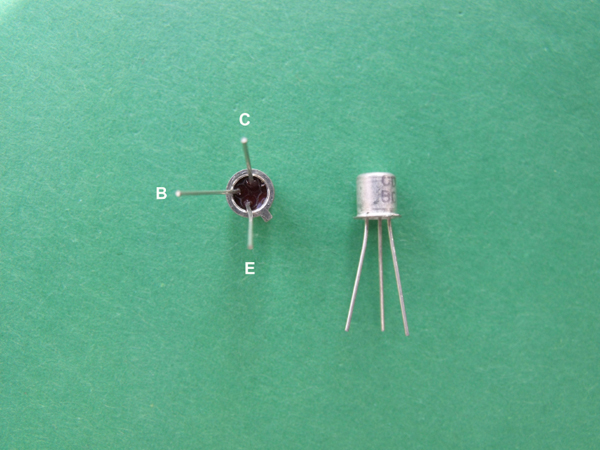
FIGURE 3-19 The type of transistor used in this book has a metal tab on its casing to help you to identify its leads; the B marks the base, C marks the collector, and E marks the emitter which is next to the metal tab.
The circuit symbol for an NPN transistor looks like this:

And the circuit symbol for a PNP transistor looks like this:

If you apply a small signal to the base connection of the transistor, you can amplify this signal through the collector and emitter pins. This is explained in more detail in the relevant experimental chapters.
The measure of amplification of a transistor is called hFE—so, for example, a transistor with an hFE of 300 means that it is able to amplify the base signal by up to 300 times. Transistors come in various shapes and sizes, and each has its own application; some are suited to high-current applications and may be able to connect to a heatsink (which transfers heat to reduce the component’s temperature) to cool the device down in the circuit, and others can be used for general switching purposes. Some multimeters have a connection that allows you to test transistors, but basic multimeters may not have this feature.
Integrated Circuits
Integrated circuits (ICs) are small, rectangular packages that hold miniature electronic circuits inside, which could include many tiny capacitors, resistors, and transistors. The miniature internal circuitry allows you to reduce the amount of external components that you need to create a working circuit and helps to reduce the size of the overall circuit. A vast range of ICs are available and can be used in many different applications, such as for timers, LED drivers, sound effects, and audio amplifiers, to name a few. If we didn’t have ICs, the electronic products that you use every day would be much larger in general.
ICs normally come in packages that have 8, 14, 16, 18, or sometimes more pins that allow you to connect it to a circuit. The pin numbers of an IC can be easily identified by looking for a circle or a semicircle that identifies the top of the IC. Pin number 1 is the upper-leftmost pin (shown with white arrows in Figure 3-20) and the pin numbers then follow the direction of the black arrows shown in the figure. ICs with 8, 14, 16, and 18 pins follow this format.

FIGURE 3-20 A selection of various size ICs showing the direction of the pins
Sometimes ICs don’t use a circle to identify pin 1, but once you have identified the top of the IC, the pin numbers are easy to figure out. ICs don’t have a specific circuit symbol; they are normally shown on a circuit diagram as a rectangular block with connections coming out of it, like the 555 IC shown in the middle of Figure 3-1 at the beginning of this chapter.
To give you an idea of what the inside of an integrated circuit looks like, have a look at Figure 3-21, which shows an integrated circuit that contains a clear circular window through which you can see the miniature circuits inside.

FIGURE 3-21 Take a look inside an IC.
See how the fine wires that are linked to the tiny circuit disappear off inside the IC? These are connected to each of the ICs pins, which you connect to various parts of the circuit. You can see that you would need a microscope to see how the tiny circuit is constructed, and if you did this, you would find that it contains many tiny components that are linked together. It’s amazing how IC manufacturers can make circuits this small; imagine how big this circuit would be if we constructed it using normal sized components!
INTERESTING FACTHere are some examples of how consumer electronics have shrunk in size over the years:
• 1930s Cabinet-sized radios became available and used valves, or vacuum tubes, (a predecessor of the transistor) to amplify sound.
• 1950s The first computers were built; they were huge—the size of an entire room—and used many valves.
• 1960s Pocket-sized radios were available and used transistors.
• 1970s Pocket-sized calculators were produced using integrated circuits.
• 1980s Personal computers became available; some were as small as a shoe box.
• 1990s Second generation (2G) mobile phones became commercially available. Earlier mobile phones were about the size of a brick; 2G phones began the move toward smaller devices.
• 2000s Matchbox-sized personal audio players became available and used ICs to store many thousands of song tracks using a compressed digital data format (such as MP3).
Converting Circuit Diagrams to Breadboard Layouts
Each experiment in this book contains a circuit diagram that uses the component symbols that are shown in this chapter. The operation of the circuit is explained in detail to help you understand how it works.
Each experiment will show you how to build the circuit on a piece of breadboard; you don’t need to convert the circuit diagrams into breadboard layouts, however, because this has already been done for you. By the time you have built the last experiment in the book, you should find it fairly easy to convert your own circuit diagrams into breadboard layouts. If you use a breadboard that’s slightly different from the one that I use in the experiments, you should find it fairly easy to convert the book’s breadboard layouts to suit your breadboard. Figure 1-3 in Chapter 1 shows how the internal connections of a typical breadboard are configured.
Experiment Building and Testing Guidelines
When you build the experiments in each chapter, follow the circuit diagrams and the close-up photographs of the breadboard layouts. Watch for some common errors when you’re building the breadboard layouts, which are outlined here. Work through this checklist before you connect the battery to the circuit:
• Make sure that the battery leads are connected the correct way around in the circuit, as shown in the chapter photographs. Normally the red battery lead identifies the positive (+) battery connection and the black battery lead identifies the negative (-) battery connection.
• Are the batteries fresh? Old, depleted batteries may not have enough electricity to operate your experiment.
• Are you using the suggested battery voltage outlined in the experiment?
• Make sure that the component leads are connected the correct way around—for example, transistors, LEDs, electrolytic capacitors, and ICs must all be connected the correct way; otherwise, they may not work and could be irreparably damaged.
• Are you using the component values that are specified in the parts list? If you are using alternative component values, this could make the circuit operate in an unusual or erratic way.
• Check that you have not missed any of the wire links that connect various components together.
• Make sure that the components are fitted snugly into the breadboard; otherwise, they may not be making the correct electrical connection.
If you find that the circuit does not work as expected, don’t panic; just immediately remove the battery from the circuit and check your layout again. You may have damaged a component or you may be lucky; you will need to check your layout again and if necessary alter some of the components if they are damaged. Fault-finding can be frustrating, but it’s worthwhile in the end after you have a working circuit.
The best advice that I can give you is to take your time when building the experiments, making careful note of the images and recommendations in each chapter. If you do this, you should be able to get your experiments working the first time.
Time to Play!
A few other electronic components have not been described yet, but you will come across these in the experiments ahead and they will be explained in more detail in each project chapter. Now that you have learned about the key electronic components used in this book, it is time for you to play! So read on to the next section of the book, which shows you how to experiment with some telephone circuits.
..................Content has been hidden....................
You can't read the all page of ebook, please click here login for view all page.