
No matter how trivial the project or how sure we are about developing a project, we inevitably run into the need for troubleshooting. The need is so often greater for an embedded computing project because you don’t have the luxury of a core file dump to be analyzed like you would under Linux. You might also not have a display device at the point of the error.
In this chapter, we’ll first look at the debugging facilities that are available to the STM32 platform. Then, some troubleshooting techniques will be examined, along with other resources.
Gnu GDB
The Gnu GDB debugger is quite powerful and worth taking the time to learn. Using the ST-LINK V2 USB programmer, it is possible to access the STM32 from your desktop and step through the code, examining memory and registers and setting breakpoints. The first step is to get the GDB server up and running.
GDB Server
Open another terminal session where you can run your GDB server. The st-util command will have been installed with your st-flash software install. If you launch st-util without the programmer being plugged into the USB port, your session will appear something like this:
$ st-util
st-util 1.3.1-4-g9d08810
2018-02-08T21:09:22 WARN src/usb.c: Couldn't find any ST-Link/V2 devices
If you see this, check that your ST-LINK V2 programmer is connected and plugged in.
If your programmer is plugged in but it doesn’t see the STM32 device attached to it, your session will appear something like this:
$ st-util
st-util 1.3.1-4-g9d08810
2018-02-08T21:10:52 INFO src/usb.c: -- exit_dfu_mode
2018-02-08T21:10:52 INFO src/common.c: Loading device parameters....
2018-02-08T21:10:52 WARN src/common.c: unknown chip id! 0xe0042000
If your device is attached, unplug the programmer immediately to avoid damage and recheck the wiring. If you are using individual DuPont wires between the programmer and the STM32, it is easy to make a mistake. To avoid that, I recommend that you make a custom cable for this purpose.
If everything goes well, you should have a session like the following:
$ st-util
st-util 1.3.1-4-g9d08810
2018-02-08T21:07:18 INFO src/usb.c: -- exit_dfu_mode
2018-02-08T21:07:18 INFO src/common.c: Loading device parameters....
2018-02-08T21:07:18 INFO src/common.c: Device connected is: F1
    Medium-density device, id 0x20036410
2018-02-08T21:07:18 INFO src/common.c: SRAM size: 0x5000 bytes (20 KiB),
    Flash: 0x20000 bytes (128 KiB) in pages of 1024 bytes
2018-02-08T21:07:18 INFO src/gdbserver/gdb-server.c: Chip ID is 00000410,
    Core ID is  1ba01477.
2018-02-08T21:07:18 INFO src/gdbserver/gdb-server.c: Listening at *:4242..
From this, we observe that we are connected to an F1 device (STM32F103) and that it found 20K bytes of static RAM. Depending upon your device and the version of your st-util command installed, it may show only 64K bytes of flash, or, as it does here, it may show 128K bytes instead. Last of all, notice that it is listening at *:4242. The asterisk indicates that it is listening on all interfaces at port 4242.
When you want to terminate this server, press ^C (Control-C).
Remote GDB
With the st-util server running, it is now possible to use GDB to connect to that server to start a debug session. Let’s use the RTC project as a working example:
$ cd ~/stm32f103c8t6/rtos/rtcIt is critical that you use the version of GDB that matches your compiler tools. Most of you will likely be using arm-none-eabi-gdb, though it may differ by your install. Since this is tedious to type, you may want to use a shell alias for this purpose:
$ alias g='arm-none-eabi-gdb'This allows you to just type “g” to invoke it. I’ll list the command in full in this chapter, but do use the alias to save typing if you like. Just start up the command to get started:
$ arm-none-eabi-gdb
GNU gdb (GNU Tools for ARM Embedded Processors 6-2017-q2-update) 7.12.1.20170417-git
Copyright (C) 2017 Free Software Foundation, Inc.
License GPLv3+: GNU GPL version 3 or later
...
For help, type "help".
Type "apropos word" to search for commands related to "word".
(gdb)
At this point, we have not yet attached to the st-util server. The next step is optional but is necessary if you want to have source-level symbols and debugging in your session:
(gdb) file main.elf
Reading symbols from main.elf...done.
Notice that it confirms that the symbols were extracted from the file main.elf in the current directory. Next, connect to the st-util server:
(gdb) target extended-remote :4242
Remote debugging using :4242
0x08003060 in ?? ()
(gdb)
As a shortcut, no IP address is typed before the :4242. This implies that we are connecting through the local loopback 127.0.0.1:4242. The connection is confirmed with the message “Remote debugging using :4242.”
Now, let’s load the program into flash:
(gdb) load main.elf
Loading section .text, size 0x30e8 lma 0x8000000
Loading section .data, size 0x858 lma 0x80030e8
Start address 0x8002550, load size 14656
Transfer rate: 8 KB/sec, 7328 bytes/write.
The st-util server will automatically flash the file’s image into flash (note that it loads it starting at address 0x8000000). There are also data areas programmed into flash starting at address 0x80030e8. The startup code will locate this and copy that data to its proper location in SRAM before the main() function is called.
Next, we set a breakpoint for the main() function:
(gdb) b main
Breakpoint 1 at 0x800046c: file main.c, line 252.
(gdb)
If we don’t set a breakpoint, the software will run away and execute when we launch it. Setting the breakpoint at main allows all the initialization to run, but it stops at the first statement in the main() program. Note that the breakpoint command will fail if you leave out the file command (earlier) because it won’t know about the symbol main.
Now, let’s start the program:
(gdb) cContinuing.Breakpoint 1, main () at main.c:252252 main(void) {(gdb)
The program has started and then paused at the breakpoint that we set. Now, we can step over source statements with the “n” (next) GDB command:
(gdb) n
254     rcc_clock_setup_in_hse_8mhz_out_72mhz(); // Use this for "blue pill"
(gdb) n
256     rcc_periph_clock_enable(RCC_GPIOC);
(gdb) n
257     gpio_set_mode(GPIOC,GPIO_MODE_OUTPUT_50_MHZ,
                      GPIO_CNF_OUTPUT_PUSHPULL,GPIO13);
(gdb)
This has allowed us to step over these three statements. If you want to trace inside any function, issue the “s” (step) GDB command instead.
To just run the program from this point forward, use the “c” (continue) GDB command:
(gdb) c
Continuing.
Notice that no new (GDB) prompt is returned. To interrupt the program and regain control, press ^C (Control-C):
^C
Program received signal SIGTRAP, Trace/breakpoint trap.
0x08000842 in xPortPendSVHandler () at rtos/port.c:403
403        __asm volatile
(gdb)
Where the program is interrupted at will vary. To view the call stack, use the bt (backtrace) GDB command:
(gdb) bt
#0  0x08000842 in xPortPendSVHandler () at rtos/port.c:403
#1  <signal handler called>
#2  0x08000798 in prvPortStartFirstTask () at rtos/port.c:270
#3  0x080008d6 in xPortStartScheduler () at rtos/port.c:350
Backtrace stopped: Cannot access memory at address 0x20005004
(gdb)
This tells us that we interrupted execution inside of the FreeRTOS scheduler code.
To exit GDB, type the command “quit.”
GDB Text User Interface
To make debugging sessions more convenient, GDB supports a few different layouts. Figure 21-1 is the layout obtained by typing the command “layout split.” This gives you both the source code and the assembler-level instruction view.

Figure 21-1 GDB “layout split” display
Other views are possible. For example, to trace what happens in assembler language programs you’ll want to use the “layout regs” view, shown in Figure 21-2. This view shows the assembler language instructions as well as the register content. Changed registers are highlighted. Unfortunately, the small terminal window size used for Figure 21-2 doesn’t do it justice. When you use a wider terminal window, you will see all of the registers.
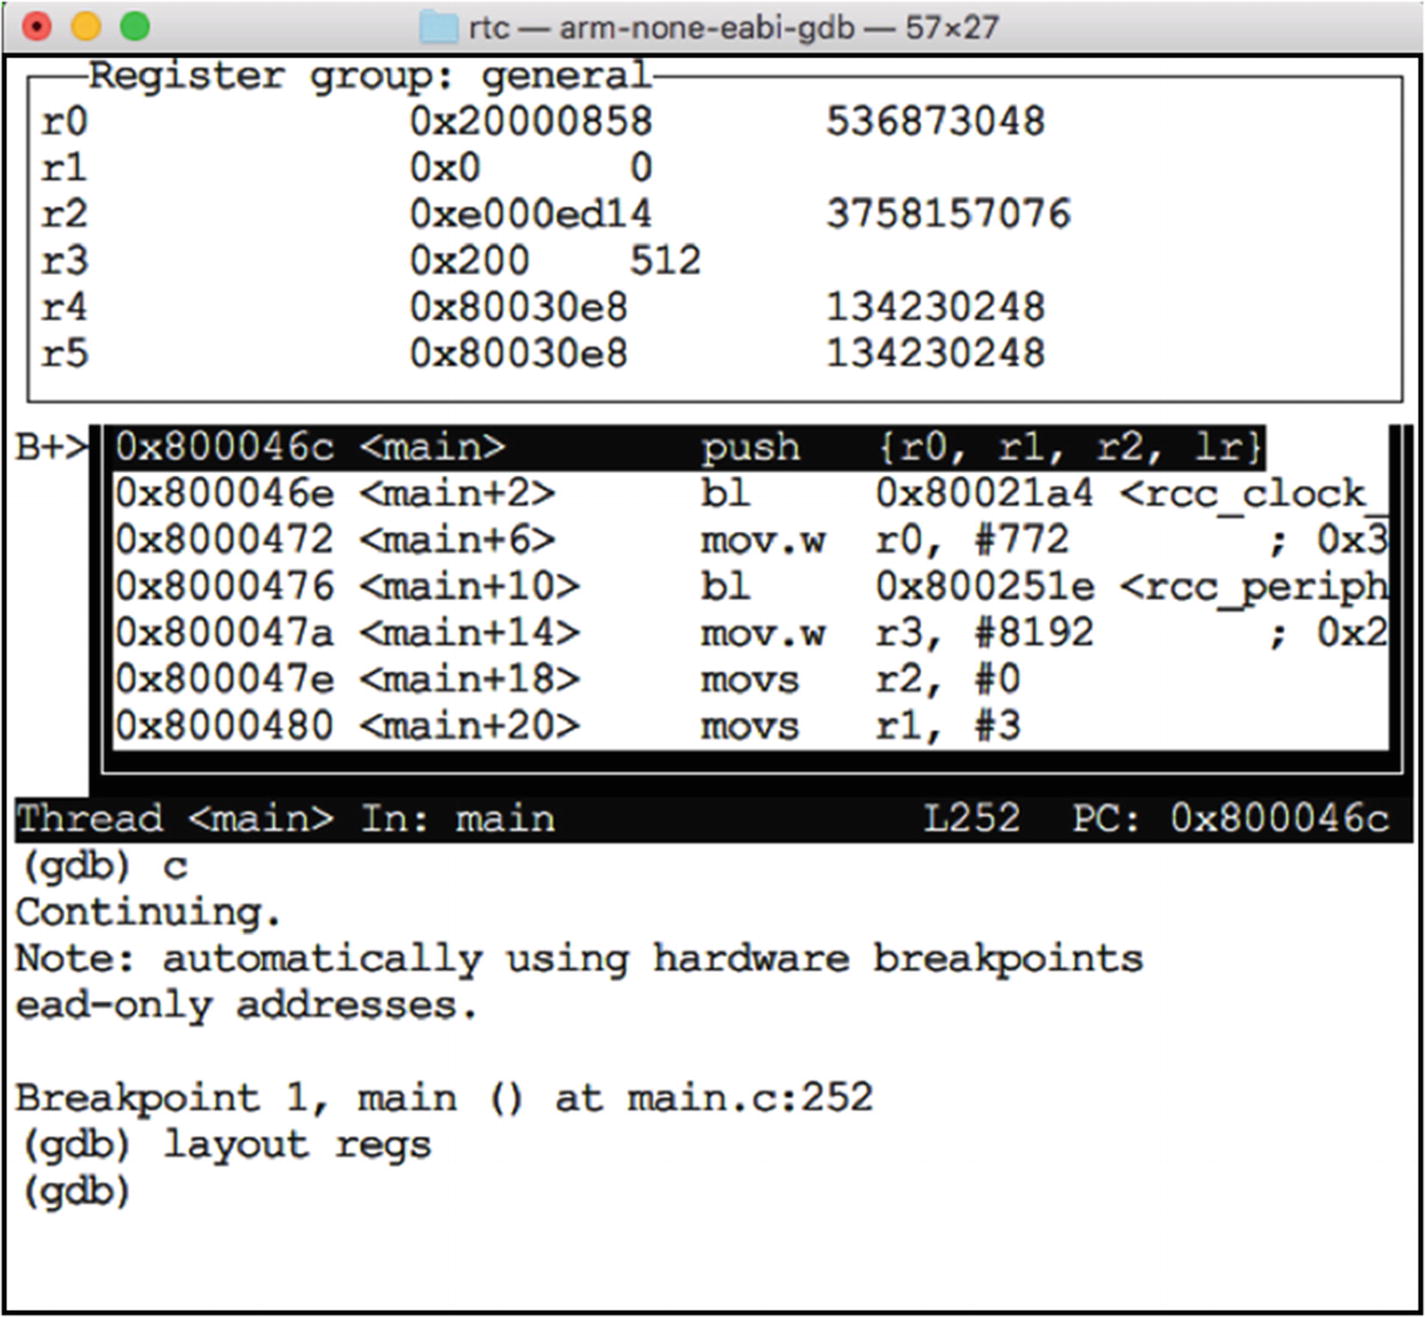
Figure 21-2 GDB “layout regs” view (full register set displayed with wider terminal window)
There is quite a bit more to GDB than can be described here. An investment in reading the GDB manual or online tutorials can save you time in the long run.
Peripheral GPIO Trouble
You write a new program using the UART peripheral, which requires the use of a GPIO output. You configure it, yet the output doesn’t work. Hopefully, this book has already prepared you for the answer. What is wrong with this code fragment?
rcc_periph_clock_enable(RCC_GPIOA);rcc_periph_clock_enable(RCC_USART1);// UART TX on PA9 (GPIO_USART1_TX)gpio_set_mode(GPIOA,GPIO_MODE_OUTPUT_50_MHZ,GPIO_CNF_OUTPUT_PUSHPULL,GPIO_USART1_TX);
I am repeating myself here because this is such an easy mistake to make. Yes, the code has configured PA9 for GPIO output. But this is not the same as the peripheral output. For that, you must configure it as an alternate function output (note argument three):
// UART TX on PA9 (GPIO_USART1_TX)
gpio_set_mode(GPIOA,
    GPIO_MODE_OUTPUT_50_MHZ,
    GPIO_CNF_OUTPUT_ALTFN_PUSHPULL,  // NOTE!!
    GPIO_USART1_TX);
This is what causes the peripheral to be connected to the GPIO pin and disconnects the regular GPIO function. Get this wrong, and you can be driven to madness. The code will look correct but will be laughing behind your back. Burn that into your consciousness early.
Alternate Function Fail
Your code performs some initialization for a peripheral to use a GPIO output, and you even use the correct GPIO_CNF_OUTPUT_ALTFN_OPENDRAIN macro for the CAN bus, but still no joy. Where is the bug?
rcc_peripheral_enable_clock(&RCC_APB1ENR,RCC_APB1ENR_CAN1EN);
rcc_periph_clock_enable(RCC_GPIOB);
gpio_set_mode(GPIOB,
    GPIO_MODE_OUTPUT_50_MHZ,
    GPIO_CNF_OUTPUT_ALTFN_OPENDRAIN,
    GPIO_CAN_PB_TX);
gpio_set_mode(GPIOB,
    GPIO_MODE_INPUT,
    GPIO_CNF_INPUT_FLOAT,
    GPIO_CAN_PB_RX);
gpio_primary_remap(
    AFIO_MAPR_SWJ_CFG_JTAG_OFF_SW_OFF,
    AFIO_MAPR_CAN1_REMAP_PORTB); // CAN_RX=PB8, CAN_TX=PB9
Give yourself a pat on the back if you said that the AFIO clock needs to be enabled:
rcc_periph_clock_enable(RCC_AFIO);If you omit this call, the GPIO remapping won’t function. It needs a clock. An omission like this can be insidious.
Peripheral Fail
This should be obvious, but peripherals need their own clocks enabled. For CAN bus, it required this call:
rcc_peripheral_enable_clock(&RCC_APB1ENR,RCC_APB1ENR_CAN1EN);For other peripherals like the UART, the call may be simpler:
rcc_periph_clock_enable(RCC_USART1);Obviously, if the peripheral’s clock is disabled, as it is after reset, then it will act like a dead piece of silicon.
ISR FreeRTOS Crash
FreeRTOS has a rule about what can and can’t be called from within an ISR. While a task may call xQueueSend() anytime, an ISR must use the xQueueSendFromISR() function (note the FromISR on the end of the function name). The reasons may vary by platform, but ISRs generally operate under very strict conditions.
Interrupts are asynchronous in nature, so any function call is suspect if it is not known to be reentrant. FreeRTOS takes special measures to make certain that the called function is safe when you use the correct name. Break this rule, and you may experience sporadic fails.
Stack Overflow
Unfortunately, stack sizes must be determined upfront when creating a task. For example:
xTaskCreate(monitor_task,"monitor",350,NULL,1,NULL);Argument three in the call allocates 350 words of storage for that task’s stack (each word is four bytes in length). Function xTaskCreate() allocates the stack from the heap. If the stack size is insufficient, memory corruption will follow, with unpredictable results.
An improvement would be to check for this condition and do something about it. FreeRTOS provides three ways to address this. This is determined by the configCHECK_FOR_STACK_OVERFLOW macro as defined in your FreeRTOSConfig.h file:
configCHECK_FOR_STACK_OVERFLOW is defined as 0. FreeRTOS will not check for overflow; this is the most efficient for operation.
configCHECK_FOR_STACK_OVERFLOW is defined as 1 so that FreeRTOS will perform a quick stack check. Less efficient than approach 1, but more efficient than 3.
configCHECK_FOR_STACK_OVERFLOW is defined as 2 so that FreeRTOS will perform a more thorough stack check. This is the least efficient operation.
When the macro is defined as non-zero, you must supply a function to be called when the stack has overflowed:
void
vApplicationStackOverflowHook(
  xTaskHandle *pxTask,
  signed portCHAR *pcTaskName
) {
    // do something, perhaps
    // flash an LED
}
When the stack overflow is detected, the hook function is called. Some memory corruption is likely to have already occurred by the time this hook is called, so it is best to signal it using the simplest of methods, like turning on an LED or flashing it so many times.
Estimating Stack Size
Estimating the stack size required can be difficult for functions that call into library routines, especially third-party ones. So, how do you confirm how much space is needed? FreeRTOS provides a function that helps:
#include "FreeRTOS.h"#include "task.h"// Returns # of words:UBaseType_t uxTaskGetStackHighWaterMark(TaskHandle_t task);
The FreeRTOS documentation doesn’t state what it returns, but the return value is in words. The function, when given the handle of a task, will return the number of unused stack words. If the task was created with 350 words of stack and used a maximum of 100 words so far, then the return value will be 250. In other words, the closer the return value is to zero, the more likely it is that the task is will overflow its stack.
The FreeRTOS documentation states that the function call can be costly and thus should only be used in debugging. But be careful even then because stack usage can vary with usage patterns. Even so, it is better than nothing when attempting to arrive at an estimate.
When a Debugger Doesn’t Help
There are times when a debugger is impractical. When debugging device drivers, for example, there may be interrupts and timeouts involved where stepping through the code is not going to help. In this situation, you may want to collect clues like where it crashes or what the last successfully processed event was. In many of these difficult situations, having access to an LED or a GPIO can provide insights.
Within an ISR, you don’t have the luxury of sending a message to an LCD display or a serial message to a terminal. Instead, you need to find simple ways to convey events, like activating LEDs. If you have a DSO (digital storage scope) or logic analyzer, emitting signals on multiple GPIOs can be very informative, especially when determining how much time is spent within an ISR.
In more extreme cases, you may need to set aside a trace buffer that your ISR can populate. Then, using GDB, you can interrupt the execution of the STM32 and examine that trace buffer.
Push/Pull or Open Drain
Some problems are centered on the use of the GPIO output. For example, many forum posts claim that the hardware slave select doesn’t work for SPI. It does work, however, if you use open-drain configuration and a pull-up resistor. While this might be surprising, it does make sense when you consider that the STM32 supports multi-master mode SPI.
Any multi-mastered bus element must use a pull-up resistor because if one controller is holding the bus signal high, another MCU would have to fight in order to pull the same signal low. The pull-up resistor allows the signal to go high when no controller is active on the signal. It also allows any bus participant to pull the signal low without a fight.
This highlights another issue. When reading through STMicroelectronics datasheets, it helps to keep an eye out for the fine print and footnotes. A lot of tricky stuff lurks there.
Peripheral Defects
In rare cases, you may encounter peripheral behavior that is incorrect. The STM32 peripherals are complex silicon-state machines, and they sometimes have deficiencies in certain situations or in certain configurations. Search for and download the “STM32F1 Errata Sheet” PDF file for insight into what can go wrong. Usually a work-around is provided.
Reading the errata, you may notice that many of the problems pertain to debugging. This is a head’s up that not everything you might see in a remote GDB session is representative of reality. Remote debugging is very useful but can run into difficulties in special situations.
Resources
Most of your time will likely be spent getting the STM32 peripherals to work the way you want them to. The more advanced your application is, the more likely it is that you will spend time working through peripheral issues.
The very best source of information about the peripherals is contained in STMicroelectronics’ “reference manual” RM0008. At a minimum, you’ll want to download this PDF and have it available for working through difficult issues. But this is not the only resource you want.
Search for and download the “STM32F103x8 STM32F103xB PDF” document. The one very important table contained in that document is table 5, “Medium-density STM32F103xx pin definitions.” You might not be concerned about the pin definitions, but you’ll find it a gold mine for summarizing what each GPIO pin is able to become with the correct configuration. To use Table 5, look down the column for LQFP48 for the STM32F103C8T6. Following down the column, you will find pin numbers. Pin 11, for example, is GPIO PA1 after reset and is configurable to be one of the following:
USART2_RTS
ADC12_IN1
TIM2_CH2
And it is not 5-volt tolerant.
All of this is essential information that seems to belong in the reference manual, but isn’t found there.
The section titled “Electrical Characteristics” will be of interest to those who are looking for estimates of power consumption. For example, Table 17, “Typical current consumption in Run mode, code with data processing running from Flash,” indicates that the MCU running at 72 MHz will consume about 27 mA with all of the peripherals disabled. Several other tables and charts of this nature are available in that document.
libopencm3
Even though libopencm3 has an API wiki, I find myself needing answers that are not supplied or not obvious. I suspect that you will experience the same when developing new applications. Questions like these occur:
When can I combine different values in a function call argument?
When must they be supplied in separate calls?
These are two sides of the same question. First, here is the direct link to the API wiki pages:
http://libopencm3.org/docs/latest/htmlAlong the left side, the documentation is split up by STM32 family member. For the STM32F103, you want to drill down on “STM32F1.” In some cases, the details are spelled out. For example, the function
void gpio_set(uint32_t gpioport,uint16_t gpios);is described with the following:
Set a Group of Pins Atomic.
Set one or more pins of the given GPIO port to 1 in an atomic operation.
This tells us clearly that you can combine multiple GPIO references using the C or (|) operator in argument two; for example:
gpio_set(GPIOB,GPIO5|GPIO5);It probably goes without saying that you cannot combine values for gpioport.
There are other types of calls like this one:
bool usart_get_flag(uint32_t usart,uint32_t flag);The singular name “flag” and the description “USART Read a Status Flag” both indicate the singular. What happens if you combine flags? While this may not be a safe or normal thing to do, the only way to answer that is to look at the source code. At the bottom of the description, you will find a link “Definition at line 107 of file usart_common_f124.c.” If you click on that, it brings up the source-file listing of the module containing the function. From there, you can search or scroll down to the function definition and see that it is defined as follows:
bool usart_get_flag(uint32_t usart, uint32_t flag)
{
    return ((USART_SR(usart) & flag) != 0);
}
This tells you a couple of things:
If you supply multiple flags, you only get a bool result (any of the flags may cause it to return true). This is not likely what you want.
It tells you how to obtain the status flags yourself by use of the macro USART_SR(usart). You may need, however, to include another header file to make this available.
The point of this section is to make you aware that you need to read the libopencm3 API descriptions carefully. If the argument type is an enum type, that almost guarantees that you shouldn’t combine arguments. If the argument type is a signed or unsigned integer, you might be able to combine. Check the documentation before you assume. Where you don’t find those necessary answers, “use the source, Luke.”
FreeRTOS Task Priorities
FreeRTOS provides multi-tasking with multiple priority levels. Be aware that the priority mechanism may not be what you expect. Task priorities are arranged so that level zero is the lowest priority. Level configMAX_PRIORITIES-1 is the highest task priority. The macro configMAX_PRIORITIES is defined within FreeRTOSConfig.h.
The idle task has priority zero. It runs when no other task is ready to run. There are some FreeRTOS configurable options for what happens during idle, which you can read about in their manual. The default is to just spin the CPU until a higher-priority task changes to the Ready state.
The FreeRTOS scheduler is designed to give CPU to tasks that are in the Ready or Running state. If you have one or more tasks in the Ready or Running state at a higher priority, then no lower-priority task will run. This is different than Linux, for example, where the CPU is shared with lower-priority processes. Under FreeRTOS, lower-priority processes require that all of the higher-priority tasks be in one of the following states:
Suspended by calls like vTaskSuspend()
Blocked by a blocking call like xTaskNotifyWait()
This has consequences for tasks that wait for a peripheral event. If the driver within a task performs a busy loop, then CPU is not given up until the preemptive interrupt occurs. Even when the busy loop calls upon taskYIELD(), the CPU is given to the other ready task at the same priority in round-robin sequence. Again, the only way that a lower-priority task will gain the CPU is when all tasks at the higher priority are either suspended or blocked.
This requires an adjustment to your Linux/Unix way of thinking, where the CPU is shared with every process that is ready to run. If you want that, then in FreeRTOS you must run all of your tasks at the same priority level. All tasks at the same level are scheduled in a round-robin fashion.
The way that this problem manifests itself is that the lower-priority tasks appear to be frozen or hung. This is a clear sign that your priority scheme needs adjustment or that tasks are not being blocked/suspended as intended.
Scheduling Within libopencm3
The library libopencm3 was developed independently of FreeRTOS. Consequently, when a peripheral driver waits for a peripheral event, it often includes a busy loop. Let’s look at one example of what I mean:
void usart_wait_send_ready(uint32_t usart)
{
    /* Wait until the data has been transferred into the shift register. */
    while ((USART_SR(usart) & USART_SR_TXE) == 0);
}
The usart_wait_send_ready() function is called prior to sending the data byte to the USART. But notice the while loop—it simply burns CPU waiting for the USART_SR_TXE flag to become true. The effect of this is that the calling task will expend its entire time slice before preemption gives the CPU to another task. This gets the job done but is suboptimal.
To make better use of the CPU, it would be better to have the task yield its time slice to another task so that other useful work can be done. Unfortunately, there are no hooks for this in libopencm3. This leaves you with the following choices:
Live with it (perhaps it’s not critical for your application).
Copy the function into your code and add a taskYIELD() call.
Modify your copy of the libopencm3 library.
Implement hook functionality and submit it to the libopencm3 volunteers.
The easiest fix is the second approach. Copy the function’s code into your own application and amend it slightly to call taskYIELD():
void usart_wait_send_ready(uint32_t usart)
{
    /* Wait until the data has been transferred into the shift register. */
    while ((USART_SR(usart) & USART_SR_TXE) == 0)
        taskYIELD(); // Make FreeRTOS friendly
}
Summary
We have concentrated on the STM32F103C8T6 member of the STM32 family in this book. This has allowed us to concentrate on a fixed number of features. There are, of course, other family member devices with additional peripherals, like the DAC (digital-to-analog converter), to name only one. If you now have an appetite for more-advanced challenges, consider a STM32F407 family device, like the Discovery board. If you’re on a student budget, there are other choices, like the Core407V, on eBay. The STM32F4 provides much more in the way of SRAM, flash, and peripherals than we have considered in this book. It also includes hardware floating point, which can be performance critical to some applications.
I hope that this book has left you well informed about the STM32 platform and has given you fun challenges to work through. In celebration of this, there will be no exercises in this chapter! Thank you for allowing me to be your guide.