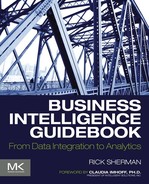
The BI architecture framework helps all of an enterprise's BI projects complement one another and create cohesive, cost-effective BI solutions. The framework accommodates expansion and renovation based on evolving requirements, capabilities, and skills. It is made up of four parts. The first is the information architecture, which defines the purpose of the project, the business processes and analytics, who will have access, and where the data is and how it will be integrated and consumed. The second is data architecture, which defines the data along with the schemas, integration, transformations, storage, and workflow required to enable the analytical requirements of the information architecture. Third is the technical architecture, which defines the technologies that are used to implement and support a BI solution that fulfills the information and data architecture requirements. Fourth is the product architecture, which defines the products, their configurations, and how they are interconnected to implement the technology requirements of the BI framework. The overall architecture must also accommodate metadata and requirements for security and privacy. Companies that do not plan end up with an accidental architecture, which leads to data silos and other inefficiencies.
Keywords
Accidental architecture; BI architecture framework; Data architecture; Information architecture; Product architecture; Technical architecture
Information in This Chapter
• BI architecture framework
• Information architecture
• Data architecture
• Technical architecture
• Product architecture
• Metadata
• Planning for security and privacy
• Avoiding the accidental architecture
The Need for Architectural Blueprints
BI environments and houses have something in common. When you plan to build a house, you start with its purpose: a place to live, a place to live and work, a place to raise kids, a place to grow old, etc. Knowing that, you put together a wish list on the architectural style, size, and types of rooms. Then you hire an architect to design the house and create a detailed blueprint. The architect gives you feedback on how the various rooms can fit together, what the building codes are, and how to fit in the infrastructure such as wiring and plumbing. Most importantly, the architect advises you on what is really possible or practical given your location, house size, wishes, budget, and timetable. In addition, she offers ideas for things you had not thought of.
What happens if you skip the architect and go straight to a builder? The house may not meet building codes, the flow of the rooms will be awkward, and the style will not be as attractive. The process will take longer as the builder tries to figure out what you want. Meanwhile, you do not really know what you want until you see it, and then you probably do not like what you see. And, you certainly do not like paying for all this extra time.
Like the unfortunate house without blueprints, many enterprises today have a BI environment that did not have the benefit of an architecture. It is a hodgepodge of the following pieces:
• Many application-specific reporting environments in addition to an enterprise BI environment. Business people are forced to switch between these environments based on what they are trying to analyze.
• Various databases created for BI outside the application environments (above) that were created at different times, by different teams for different purposes. These databases might be referred to as data warehouses (DW), data marts, operational data stores (ODS), repositories, online analytical processing (OLAP) cubes, or by some internal acronym.
• Several different BI tools, either associated with the application-specific reporting environments or the enterprise BI solution. It is not unusual to see the enterprise BI environment supporting several BI tools because different BI tools were designated as the enterprise standard at different times. And once a BI tool becomes a standard, it is likely to become entrenched in an enterprise for a long time, even if a new BI tool has been selected as the new or latest standard.
• A data-integration tool selected as the enterprise standard for loading the DW, yet people use a lot of manually created custom SQL code or other extract transform and load (ETL) tools to load the databases used by the BI tools.
Business people are grouped by business function and processes, so enterprises tend to build (or purchase) business applications in discrete silos. The initial wave of reporting that business people use is from these application silos. Enterprises then try to expand this reporting, but they typically focus the BI projects on the same applications that the business groups have been using without examining how these projects should fit into an overall architecture. As a result, many BI environments have become a collection of technology, product, and data silos that are loosely connected and require an intensive commitment of resources to operate, upgrade, maintain, and enhance.
Business people are frustrated with the state of their BI environments, which take longer and longer to enhance over time, and are always a release away from becoming pervasive throughout the enterprise. They remember the significant investments of time, resources, and budget for BI projects, and they ask why they still have to use spreadsheets (i.e., data shadow systems or spreadmarts) as the superglue for reporting and analysis.
IT people are also frustrated as more and more of their time is spent on reconciling data between these silos and maintaining these systems rather than expanding the breadth and value of BI for the business. The temptation, too often reinforced by industry hype, is that an enterprise can get out of this mess by simply using the latest technology marvel; but it always ends up as the next silo.
Architectural Framework
Successful enterprise BI solutions with enduring business value are not completed in a “one and done” project, but rather evolve over time. BI will, if done right, expand in terms of the number of business people using it, business processes affected, data consumed, and analytics performed. An architectural framework, i.e., a set of architectural blueprints, is needed as each new BI project is undertaken to enable these projects to complement each other and create a cohesive, cost-effective BI solution. The framework needs to be designed to accommodate expansion and renovation based on evolving requirements, capabilities, and skills. Although the framework designer will not know the future, she can design the framework to meet those challenges. Besides adding BI capabilities for the enterprise, the designer needs to include support for development, testing, ongoing operations, performance monitoring, and documentation. Many of these areas get shortchanged or overlooked if the focus is merely on blueprints for implementing only the current project.
As shown in Figure 4.1, BI framework is composed of four architectural layers:
1. Information architecture
2. Data architecture
3. Technical architecture
4. Product architecture
FIGURE 4.1The four architecture categories.
These four architecture categories are discussed below and covered in detail in Chapters 5, 6, and 7.
Information Architecture
The information architecture defines the “what, who, where, and why” for BI or analytical applications:
• What business processes or functions are going to be supported, what types of analytics will be needed, and what types of decisions are affected
• Who (employees, customers, prospects, suppliers, or other stakeholders) will have access
• Where the data is now, where it will be integrated, and where it will be consumed in analytical applications
• Why the BI solution(s) will be built—what the business and technical requirements are
The information architecture defines the business context necessary for successful BI solutions to be built on a sustaining basis. Too often, IT skips the information architecture and goes directly to designing the technology and product architectures. The rush to technology is because it is IT’s comfort zone and a way to avoid engaging in business process discussions to design the information architecture. But it is also easier for business people, especially BI power users, to focus on products because they typically only see the BI tools and not the underlying architectures. Product evaluations and selection then become the focus of the initial BI planning and design effort, with information architectural design getting shortchanged.
If you listen to industry hype, you might think that simply picking the best products will solve your problems. Beware of this trap. When BI solutions fall short of expectations, are late, or go over budget, it is easy to blame the products. I call this the “Twilight Zone” never-ending trap:
1. Evaluate and select “best” products
2. Implement BI solution without an information architecture
3. BI project is late and costs more than planned
4. BI solution fails to meet expectations and active adoption
5. Blame current products used
6. Evaluate and select a new “best” product
7. Go back to step 2
Enterprises have business applications that perform the many business processes needed for their operations. The information architecture enables the business to perform analytics on these diverse processes whether they are selling a product, monitoring a patient’s vital stats, posting students’ grades, or tracking the performance of financial accounts. It is tempting to look at each of these processes as unique and implement each BI application independently. If there is an overarching information architecture, the project-oriented approach works well, especially because it concentrates on supporting specific business processes. But if there is no information architecture, the result will be silos, which thwart effective analytics and carry a high cost in time and opportunity lost.
Data Architecture
The data architecture defines the data along with the schemas, integration, transformations, storage, and workflow required to enable the analytical requirements of the information architecture. The scope of the data architecture starts where data is created in the source systems by information providers and ends where the business person (or information consumer) performs data analysis. The source system data definitions are obtained from information providers, while business metrics, dimensions, transformations, and measures are obtained from information consumers based on information architecture requirements.
The Rise of the Enterprise Data Warehouse
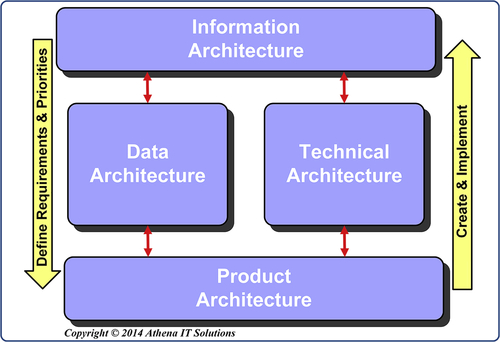
Years ago it became apparent that there needed to be a database, called an enterprise data warehouse (EDW) (see Figure 4.2), for reporting purposes separate from the data source systems (also known as systems of record (SOR)). There are several compelling reasons for separating reporting data from SORs and creating an EDW.
First, source systems, such as enterprise resource planning (ERP), customer relationship management (CRM), and supply chain management (SCM), are built for data capture and processing transactions rather than for reporting and analytics. Although they may both be on relational databases, they are structured, logically and physically, quite differently based on their respective objectives: data creation versus information analysis. The differences between data capture and analytical data structures became even greater as the variety of data sources expanded to include unstructured data and then Big Data including Web, social media, and machine data.
Second, data across SORs is often inconsistent. These inconsistencies may be the result of differences in form, structure, data relationships, business definitions, or transformations. Data inconsistency is not the same as data quality (next issue), with the former being the result of differences that may indeed be quite valid from a business perspective and the latter being the result of errors or gaps in data. Getting data consistent is a significant focus of data warehousing because it is a critical requirement for business analytics. Master data management (MDM) has emerged as a specialization within data warehousing to address significant inconsistencies in data.
Third, data quality within and across SORs is a challenge that data warehousing addresses. The mantra in the early days of data warehousing was that data in the EDW was read-only and any data-quality issues needed to be pushed back to the SORs to be fixed. Although SORs have improved significantly in eliminating data entry errors, data quality and completeness is still a problem. From a pragmatic perspective, it turned out that the EDW became the preferred location to perform data quality processing. An EDW is the “canary in the coal mine” regarding data quality because many of these issues do not become visible or affect others until the data is extracted from its source and integrated with data from other SORs. Data-quality problems are often the result of changes occurring in the data structures and usage over time, which is why it is stated that data does not age well. When the data was current it would have processed fine with the SORs’ business processes; it is only after it has aged, i.e., become historical data, that it negatively affects reporting such as trending performance over time or performing a predictive analysis. Since it is only the reporting processes that are affected, in many cases data quality processes have shifted to data warehousing rather than SORs.
FIGURE 4.2Enterprise data warehouse.
Finally, it is more difficult and sometime impossible, to access all the SORs directly in real time rather than having a separate EDW to access for reporting. Some of the inhibitors to direct access are:
• Too many SORs to access from the BI tool at once
• Specific data varieties that are not accessible
• One or more of the SORs will be adversely impacted
• Privacy or security policies
Data Warehousing Replaces the Data Warehouse
Over the years, many technologies and approaches to providing analytics have prompted people to proclaim the death of the data warehouse. Although these DW killers have been able to provide analytics, they have not been able to support enterprise-wide analytics with its accompanying need for consistent, comprehensive, clean, conformed, and current data. Their best results might have provided terrific analytics, but they did it in yet another silo (that then needed to be integrated with the other silos!).
The key fallacy of the push to replace the concept of separating reporting data from transactional data was that it was only being done for technological reasons. If that were true then data warehouses would have died long ago. The underlying reason for the separation is business and data needs. Business processes and applications have different business rules, data definitions, and transformations that create inconsistency. Data ages poorly and its completeness varies based on business need. Many of these differences need to be discovered by the BI team to be used in data integration and business intelligence applications. If only it was so easy that business people could just access all their data sources in a BI tool that would magically know what needed to be transformed and how, then that tool would replace a DW. But, of course, it is not that easy.
The classic EDW as depicted in Figure 4.2 is a single, centralized database. The data workflow includes:
• Data being created, updated, and modified in the SORs
• Data from SORs being integrated, transformed, and cleansed
• Data being loaded into the EDW
• Data being accessed by the BI tools for reporting and analysis
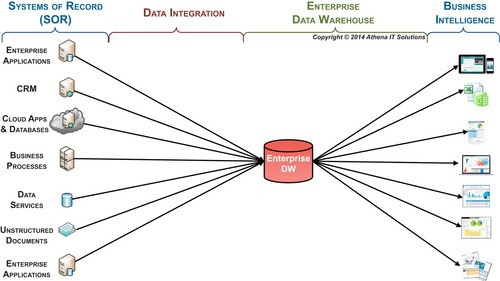
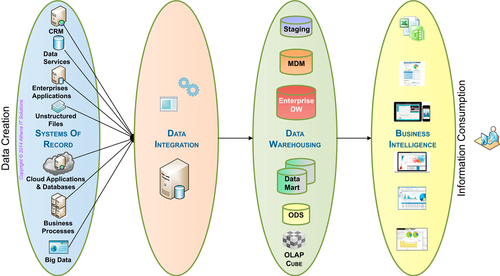
Advances in technology have prompted the evolution from the classic EDW model to more sophisticated data architecture. Figure 4.3 illustrates some of the other data stores that are being used today to replace an EDW-only structure. These data stores may include: ODS, MDM, data marts, OLAP cubes, staging data stores in addition to the EDW. The data stores’ characteristics vary: they may be persistent or transient; may be stored in a database, file structure, or memory; may be distributed or centralized; etc. Each of these data stores has specific use cases that an enterprise will leverage based on its needs. We will discuss these in more detail in the follow-on chapters in the architecture section.
FIGURE 4.3Data architecture workflow.
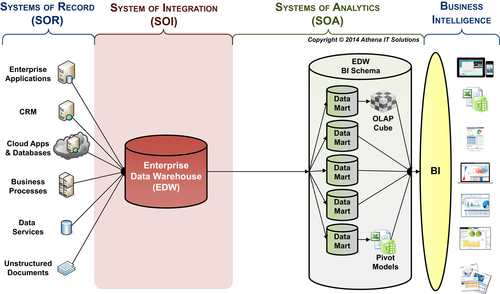
This evolution from a single centralized EDW to a set of architectural options is what I call the shift to data warehousing, i.e., many data stores, from a data warehouse. One of the best practices for a BI data architecture is to have the EDW serve two different data roles: systems of integration (SOI) and systems of analytics (SOA). Figure 4.4 depicts the three roles that occur in the BI data architecture. The purpose of each role is as follows:
• Systems of Record (SOR)—data is captured and updated in operational and transactional applications. These applications are designated as the SOR so that people and processes know what the authorized sources are for any particular data subject. This implies an expectation level in regards to the integrity and legitimacy of the data. For example, an application would be designated as the SOR for accounting data.
• System of Integration (SOI)—gathers, integrates, and transforms data from SORs into consistent, conformed, comprehensive, clean, and current information. Similar to the SOR, this designation implies a particular level of integrity and legitimacy of the integrated data. It also implies that if a person or process needs integrated data, then the SOI should be the source used.
• System of Analytics (SOA)—provides business information that has been integrated and transformed to BI applications for business analysis. Similar to the SOR, this designation implies a particular level of integrity and legitimacy of the information being used in BI. Although BI applications will directly access SORs for operation reporting, if integrated and transformed data is needed, the SOA needs to be the source.
FIGURE 4.4BI data architecture—roles of data systems.
Note: The hub and spoke (or EDW to data marts) depicted in Figure 4.4 is a logical depiction of the BI architecture. This is done to simplify the diagram and focus on the data-related functions rather than display physical databases.
Just as the data sources depicted in Figure 4.4 are the SOR for operational processes, the BI architecture needs to establish the EDW as the SOI—where data gets integrated—and the SOA—where BI and analytical application go for integrated data.
Technical Architecture
The technical architecture defines the technologies that are used to implement and support a BI solution that fulfills the information and data architecture requirements. These technologies cover the entire BI life cycle of design, development, testing, deployment, maintenance, performance tuning, and user support.
Note: The following section introduces the technologies used in BI, data integration and data warehousing. The figures presented in this section are high-level or simplified versions of what will be examined in more detail in the follow-on architecture chapters or sections on data, data integration, and BI design.
PRODUCTS VERSUS TECHNOLOGIES
Note that it is a common mistake to confuse the technical architecture with the products themselves. This typically happens because people associate products with specific technologies. It is important to remember that products may incorporate many technologies, especially with vendors extending their product lines and supporting a wide range of technologies. Resist the urge to evaluate products immediately. Determine your information and data needs, and then select the technologies that will support them.
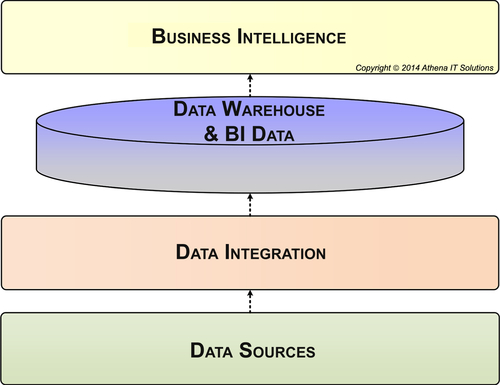
The BI technical architecture is composed of four major functional layers, as shown in Figure 4.5:
1. Business intelligence (and analytical applications)
2. Data warehouse and BI data stores
FIGURE 4.5BI technical architecture.
3. Data integration
4. Data sources
For many years, or in the “old days” as industry veterans like to describe it, the answer to what was in each of these layers was straightforward, as shown in Table 4.1.
Table 4.1
Classic BI Technology Choices
Functional Layer
Classic (Old School) Technological Choices
BI
BI reporting tool and later a BI OLAP tool
DW & BI data store
Enterprise DW on a relational database
Data integration
ETL tool running in batch updating the DW overnight
Data sources
ERP system(s) running in that enterprise’s data center
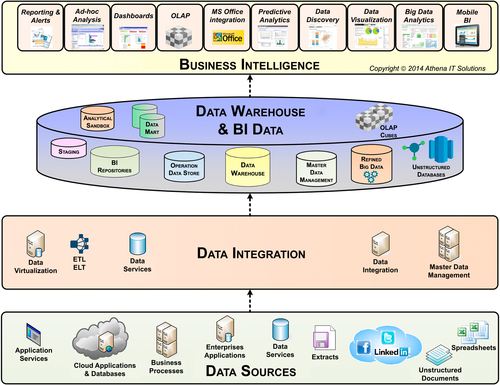
It is no longer quite so simple. The demands on information and data architectures have significantly expanded, as you can see in Figure 4.6. Not only have data variety, volume, and velocity grown substantially, but there has been substantial growth in the need to include data from outside an enterprise and interact with customers, prospects, suppliers, and many other stakeholders.
FIGURE 4.6BI technical architecture categories.
There are two opposing viewpoints that often sabotage BI initiatives. First, many describe the BI industry as mature and past its prime. This viewpoint overlooks the significant advances in each of the functional layers. BI teams with this viewpoint rely on the same old technologies in the same old ways, which significantly constrains business value and hinders return on investment (ROI).
The other viewpoint assumes that the latest products eliminate the need to do the fundamentals, so a team can skip tasks such as designing the information and data architectures. The product sales pitch is that “this time it is different” and business and IT no longer need to interact. This approach also fails to achieve business value and ROI because products, in the long run, cannot make up for wrong data, or data that is inconsistent, incomplete, or poor quality.
Business Intelligence
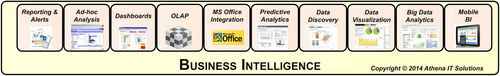
Although BI tools have been around for a couple of decades, the depth, breadth, and variety of BI capabilities and styles continues to expand and change. This is illustrated in Figure 4.7.
For much of their history, BI applications were built by the IT group, which then published reports for business people using detailed report requirements for content and layout. In the beginning, these were printed (often called “green bar”) reports; these were replaced by PDF reports, which were then replaced with online (Web browser) reports and now even mobile devices. During the 1990s and early 2000s, dashboards and scorecards became very popular, replacing the typical reporting tools that had been used previously. This was followed by OLAP and ad hoc query tools. BI options now include data discovery, data visualization, in-memory analytics, in-database analytics, predictive modeling, BI appliances, textual analytics, and Big Data analytics.
When designing the BI function of the technical architecture, a BI team needs to:
• Examine the business and data requirements
• Explore with business people what types of analytical processing they plan to perform
• Assess the analytical skills of the business users
• Select the BI functionality, i.e., type of capabilities and styles, needed
Do not perform both the BI technology and BI product selection at this point. Too often people select products because they have the most functions. Selecting the product with the most features often fails to provide the best fit for the styles and capabilities needed by business people. Many refer to this as the “one-size-fits-all” approach because a BI product is selected for everyone despite their needs.
Design the BI layer of the technical architecture with the intent of offering a BI portfolio of analytical styles available to business people. Select the BI portfolio based on business needs and skills rather than on the latest product hype or marketing pitch. It is a good idea to build the BI portfolio iteratively with additions or modifications based on value and changes in needs.
FIGURE 4.7BI analytical styles.
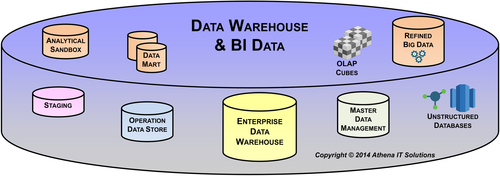
Data Warehouse and BI Data Stores
The relational database has been the primary database technology used since the beginning of data warehousing. As depicted in Figure 4.8, most of the potential data stores used in this architectural layer are housed in relational databases.
When enterprises first started using relational databases for their DW, relational technology was primarily used for transactional processing, so its functionality was geared for that purpose. Since then, however, relational databases have become very common for BI, data integration, and DW. It now has many features and enhancements oriented to those needs, including sophisticated indexing, partitioning, compression, materialized views, in-memory processing, in-database analytics, and relational online analytical processing (ROLAP). Advances in hardware, memory, storage, networks, and many other infrastructural components have greatly expanded relational technologies’ capability and performance.
Its extensive use in BI has allowed for the growth of a skilled workforce and many best practices that enterprises can leverage to increase business value and lower costs. In addition, the relational database market is competitive with several large vendors along with open source and niche products.
Despite the dominance of relational databases in BI, there has been a growing number of alternative technologies. These technologies are often targeted to particular BI uses and thereby do not eliminate the use of relational; rather, they replace it in portions of the technical architecture.
Some of the alternative technologies, which will be discussed in Chapter 7, include:
• OLAP databases
• Massively parallel processing (MPP) databases
• Data virtualization
• In-database analytics
• In-memory analytics
• Cloud-based BI, DW, or data integration
• NoSQL databases
FIGURE 4.8Data warehouse & BI data store layer.
A BI or DW appliance is another growing technology category. These products are combinations of hardware, software, and systems integration designed to improve the business value and lower the total cost of ownership (TCO) of BI implementations. BI appliances typically bundle one or more of the emerging technologies that we have discussed. They also may include combinations of commodity hardware, open source software, and proprietary components that might be hardware or software. We will discuss these further in Chapter 7.
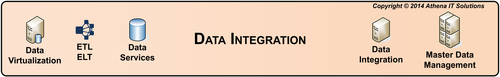
Data Integration
Data integration suffers from an image problem. It has become synonymous with ETL. Likewise, ETL has been regarded as a data warehousing technology. Both of these viewpoints fail to reflect current capabilities, and they greatly inhibit enterprises in their attempt to integrate data to provide the information their business needs.
A further stereotype is the classic ETL use of loading the EDW on a daily basis in batch mode. Many enterprises have increased the update frequency to near real time, but are still operating with the same type of ETL processing. Just as relational database technology has adapted and expanded to support the increasing demands of BI, data integration and ETL has likewise expanded to meet the ever-increasing data volumes, variety, and velocity facing enterprises.
Data integration has grown to encompass many different technologies and capabilities beyond ETL. In fact, you can consider classic ETL as just one use case of data integration. Today the high-end tools are considered data-integration suites encompassing many integration technologies such as the ones depicted in Figure 4.9. The high-end data-integration suites historically started as ETL tools, so many in IT still have a limited view of what the suites can accomplish. We will discuss these further in Chapter 7.
FIGURE 4.9Data integration layer.
A dirty secret in many enterprises is that even though they load the EDW using the data-integration tool, they do most or all of the downstream integration to load BI data stores manually using custom code with SQL. In addition, they sometimes use the data-integration suite to execute manually created SQL code rather than actually use the suite capabilities. We will discuss these shortcomings further in Chapter 6.
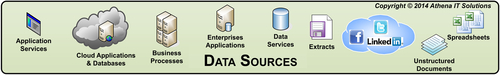
Source Systems
In the early days of data warehousing, the source systems were primarily back office transactional systems. These systems were internally managed and contained structured data. They were very limited in their number of data sources, frequency of updates, and data volumes.
Nowadays we have data from front office and back office systems, as well as data that is sourced or exchanged externally with customers, prospects, suppliers, partners, and other stakeholders. We also have structured, unstructured, and semistructured data that may need to be integrated on a real-time basis. Data is now created in all types of business and people activities, thus greatly expanding the data volumes that need to be integrated. Figure 4.10 depicts just a small sample of these new data sources.
We will discuss the impact of these data sources on the other three architectural layers in Chapter 6.
FIGURE 4.10Data sources layer.
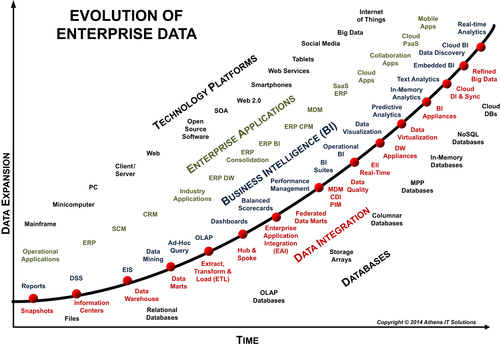
BI Technology Keeps Evolving
Figure 4.11 shows a brief and high-level historical view of the evolution of data-related technology. The diagram provides a sampling of some of the technology milestones that occurred in data management, data integration, business intelligence, and enterprise applications as the volume, variety, and velocity of data have also expanded over the years. It shows the progression of the sustained innovation that the industry has produced and, from a relative time perspective, the technology starting to make an impact on BI. The figure is not meant to imply that each new technology innovation is better than or replaces the previous innovation. Often the latest innovation becomes another option for an enterprise to use in its technology architecture. We will discuss the data technologies further in Chapter 7.
FIGURE 4.11Evolution of data technology over time.
Product Architecture
The product architecture defines the products, their configurations, and how they are interconnected to implement the technology requirements of the BI framework.
In Figure 4.1, the line on the left indicates that an enterprise defines its requirements and priorities from the top down, moving from the information, data, technology, and finally product architecture. On the right side of the diagram, we implement bottom-up and follow the architectures in reverse order.
Unfortunately, enterprises often rush to select products before defining the other components of this architecture. They issue product RFPs before examining their information, data, and technology needs and then end up with an architecture determined by the vendor. They then conform or contort their architecture, project, resources, time frame, and budget to fit their product architecture. It is all too common for vendors to underestimate your data requirements and issues, or simply overestimate what their products can do. It is in their best interest to get you deployed with their products as soon as possible. If problems result or numbers do not align, they can always blame the source systems and other applications. Both IT and business groups have fallen prey to product vendor hype because they did not do their homework on what their needs really were, nor did they vet what the vendors could realistically do.
The goal of this book is to be vendor agnostic and avoid mentioning products and associated vendors so the content does not become outdated as products and vendors evolve. The BI marketplace is a constant churn of mergers and acquisitions, making it very difficult not to become outdated. This book’s companion Web site www.BIguidebook.com will contain product and vendor-related information to support discussion of the product architecture.
The premature movement to select products is also the result of some biases against architecture. There is a feeling that architectures take much too much time to design and simply are not needed with today’s advanced technologies. Of course, with the complexity of the technology, data, and people, the need for an architecture grows in importance. But the attitude “Architecture…we don’t need no stinkin’ architecture!” occurs more often than it should.
As a final note, independent analyst groups that review products and vendors are an excellent source of information in this area.
Metadata
Metadata management is not at the top of most BI teams or business people’s priority lists. However, like flossing, it is one of those things you just have to do—and for good reason. The architectural framework needs to incorporate a strategy for handling metadata because it is essential to implementing and managing the underpinnings of technology and products.
The classic definition of metadata is “data about data.” Metadata is the description of the data as it created, transformed, stored, accessed, and consumed in the enterprise. Business people need to know what the data represents—where it came from, how it was transformed, and what it means—if they hope to perform meaningful business analytics. IT people need to know what happened to the data from the point of capture through its consumption by the business in their reports and analysis if they are to provide consistent, comprehensive, conformed, clean, and current data for business analytics.
In essence, metadata is one of the key ingredients to enabling a data-driven enterprise. That is the carrot, while the stick is the many governmental and industry regulations that require an enterprise to manage and audit its data. How does that happen without metadata?
What Is It?
There are two types of metadata: technical and business. This distinction has been poorly understood and has caused much confusion, especially with IT and software vendors.
• Technical metadata is the description of data as it is processed by software tools. Databases, for example, need to define columns (format, size, etc.), tables, and indexes; ETL tools need to define fields, mappings between source and targets, transformations, and workflows; and BI tools need to describe fields and reports. All of this metadata is used to enable the software tools (not people) to understand and process data.
• Business metadata, in contrast, is the description of information from the business perspective (e.g., the business context of the inventory turns, weekly sales, or budget variance reports). Some of the metadata that describes a report is technical, such as field size and type. However, most of the data the business person cares about is not used by the software tools. BI tools have implemented “semantic layers,” where text can be associated with fields to allow the input of business descriptions. While helpful, this is not nearly extensive enough to encapsulate the full business metadata needed.
What to Do About It
Managing metadata can be a dirty job, but a few guidelines can smooth out the process.
First, manage the scope. If you try to “boil the ocean,” you will get burned. Unless budget is not an issue, constrain your goals in the beginning. This will keep you from spending too much time and money, wasting resources, and delaying the project. You will probably only get one chance, so start small with a project guaranteed to succeed in a short period of time.
Second, address the cultural and political issues. Know who owns the data, who has time to define it, and if management really is committed to the project. It is nice to get everyone excited about metadata management, but is it on someone’s priority list? Is it considered someone’s real job?
Establish standards and processes that ingrain metadata management into business and IT people’s jobs. Standards and processes need to be part of what we do, no excuses. The incentive of Sarbanes-Oxley and other regulations should spur management to back a reasonable metadata initiative.
Finally, do not count on technology to be a silver bullet for metadata management. It is dirty, it is ugly, and you typically need to piece together a solution. In addition, a lot of the work involves talking with business people about what the data means and finding where the metadata is. Do not be scared away. Keep the scope small enough that your technology can handle it without significant custom software development.
With massive amounts of data flowing around the world and being consumed by governments, businesses, and people for legitimate and not-so-legitimate reasons, enterprises need to have security and privacy foremost in their architectural framework. It is essential given the adverse impact on your enterprise if security or privacy is compromised, with stark examples in the media of millions of people’s data breached from enterprises in the retail, health care, insurance, and finance industries. Besides these adverse events, there are governmental and industry-specific regulations that need to be complied with.
Security and privacy used to be simple in BI because there were only a few trusted people accessing a limited account of data that typically was not sensitive. In addition, those people were inside the enterprise firewall and they were generally using prebuilt reports or dashboards that did not allow any data discovery, meaning their data access was controlled.
But since those early days, BI has become more pervasive, with many people within an enterprise taking on the role of BI consumer. Furthermore, many enterprises are also offering BI capabilities to their stakeholders, such as customers, prospects, partners, suppliers, and investors. Not only are there many more people, but there is much more data available and much more analytical capability. Without security and privacy constraints, this provides more opportunities for people to discover data that they are not supposed to see.
Security and privacy are not just a BI concern; this obviously needs to be elevated to an enterprise-wide policy and program. Typically, it is in the CIO’s domain, but regardless of who manages it, the BI initiative needs its security and privacy policies to follow enterprise standards and become active participants to get BI data and applications included into this domain.
Getting Started
It can be complicated to design and implement BI and DI to conform to existing enterprise security and privacy policies, and it is also complicated if there are no policies and you need to create new ones. Many technologies have security access mechanisms associated with them, including networks, servers, notebooks, mobile devices, business applications, portable storage, BI tools, spreadsheets, data integration tools, and any other tool that can access data such as data profiling and data modeling. Cloud applications, databases, and analytic applications add complexity.
An enterprise needs to determine where in the technology stack to implement security, how many layers of security are needed, and what types of security should be implemented in those layers. BI requires multiple layers of security implemented to access data and applications.
To design for and implement security and privacy, a BI team needs to determine the what, who, why, and how:
• What data is being used in building the BI applications—not just the data the BI consumers use directly but all the data gathered from the SORs, transformed, and then accessed in BI application
• Who is going to get access to the data
• Why are these people getting access to the data and what can they do to it
• How can the data be secured, and of the security options available, what should they use
Implementing the Plan
Figuring out the what, who, and why is the easiest part of the equation; the difficult part is determining how security will be applied in relation to people and data.
First, the BI team needs to determine what data needs to be secured and what does not. Imposing the highest level of security for all data is not only impractical, it would constrain analytics and be much too costly to implement. There is always a trade-off between implementing tight security and providing high-performance access. The data inventory needs to classify data into security levels based on regulations, reputation, and negative impact if exposed. Specific employee and financial data will certainly be in the most sensitive category, but marketing data may be secured from external access and internal access may not be as much a concern.
Second, the BI team needs to examine what type and level of security could be implemented at each BI layer, such as in the database, analytics application, and network access.
Third, they need to examine the cost/benefit trade-off of what could be done and determine what makes the most sense from a business value perspective. For example, a BI team could use database security to limit user access by table and column, but that might be too time-consuming to implement and slow analytical analysis to a crawl.
Next, implement the security and privacy in the BI architecture.
Finally, communicate those policies to all BI stakeholders and enlist their vigilance in enforcing those policies in what they do.
Avoiding Accidents with Architectural Planning
Unfortunately, many enterprises evolve their DW and BI projects without a planned architecture. This evolution is the result of developing tactical projects while chasing the latest technology proclaimed by analysts, columnists, and the vendors offering these solutions.
The random walk that creates this accidental architecture may have solved some immediate, tactical needs, but the expenditure of time, resources, and budget does not deliver ROI. Even worse, each new project results in a new stovepipe of data and technology that requires increasing resources to integrate. It also makes business users more likely to develop data shadow systems to perform their own integration.
How do you break the cycle of dependency on hype and the allure of silver bullet technologies? In order to correct a problem, you first have to recognize you have a problem. Both business and IT need to confront the accidental architecture addiction and resolve to work a better way—without finger-pointing.
The Signs of Accidental Architecture Addiction
How do you know you are facing an accidental architecture? Ask these questions:
• Do you have multiple BI and performance management (PM) tools or applications scattered throughout your enterprise?
• Do your business groups continually engage vendors to bring in new BI solutions to make up for the current environment’s shortcomings?
• Have your business groups built many data shadow systems—and continue to build more—to do their reporting and analysis?
• Are people assuming that technologies such as Big Data, service-oriented architecture, software as a service or on-demand software, enterprise service bus (ESB), master data management, customer data integration, or open source software will deliver information nirvana, solving all your information needs?
If any of these are true, your company has probably developed an accidental architecture for your DW/BI environment. Even if each DW/BI project was well thought out and designed, you still have multiple DW/BI silos. You use different technologies, products, and data architectures for each one. Each project was going to solve the shortcomings of past initiatives. The sum of the parts, i.e., projects, does not add up to what the business was expecting.
If you are still in denial, let us probe a little deeper. From an IT perspective, ask yourself:
• Can IT provide the data models for your DW, data marts, cubes, and all the other data structures used for reporting and analysis, including Microsoft Access, SAS, and Microsoft Excel files?
• Can IT provide the extract, transform, and load (ETL) workflows documenting the data integration, starting from your data sources all the way to where the business consumes the information, including your DW, data marts, cubes, and any other data structures used for reporting and analysis?
• Does IT use an ETL product to load your DW, data marts, cubes, and other data structures? Or, is the ETL tool only used for loading the DW? If hand coding is involved, is it documented and managed?
• Can IT document all the processes and data used to build reports or perform analysis?
• Can IT identify and document your data shadow systems?
Answering these questions can make the IT group very nervous. They may be able to generate the ETL workflow from data sources to the DW (they can have their ETL tool generate that) and they sometimes have a DW data model (but it is usually not current). But the travels and transformation of the data from the DW to business reports and analysis, especially in spreadsheets, are generally a mystery.
If the IT group built the DW/BI environment according to an architecture, you would have all this information at your fingertips. But if your enterprise is like most, you probably do not.
The enterprise has evolved an accidental architecture, and it is time to break the cycle of dependency. There are no silver bullets that will solve these problems, but there is a road to recovery. It takes hard work, resources, and commitment, but it is worth it.
Recovering from an Accidental Architecture
Do not make the mistake of thinking you can use a “green field” solution to fix an accidental architecture. Be realistic. You do not have a green field, and it is not practical to start from scratch. You have various silos of data and technologies, including data shadow systems. Whatever your solution architecture, you need to plan on building it iteratively and replacing or integrating your silos incrementally. Your solution architecture needs to be built using a program approach; it will evolve as your business and technology evolve.
Take these steps toward developing the architecture:
• Review your documentation of existing systems.
• Reverse engineer any systems without updated documentation or where there are gaps in the documentation.
• Gather and prioritize business requirements.
• Gather and prioritize technology considerations.
• Design your architecture.
• Determine the gaps between your current systems and your solution architecture.
• Develop a program plan, including budget, resources, and timetable to get you toward that architecture.
• Start your first project.
It is important to remember that the architecture has four components: information, data, technology, and products. Resist the urge to evaluate and select products. You need to first understand and agree on the information architecture that your business needs. Then determine the data you need, the condition of that data, and what you need to do to cleanse, conform, and transform that data into business information.
Next, determine what technologies (not products) are required by the information and data architectures. Finally, almost as an afterthought, evaluate and select products that match your architectural needs. Consider the products you already have in your silos as incumbent candidates, and determine if they will do the job. Do not chase the latest and greatest if your incumbent products can get the job done.
Designing an architecture to support your enterprise reporting and analytical needs is a significant project that will result in correspondingly significant business ROI, if you do it right. Do not be intimidated or overwhelmed. Too many people will decide that they do not have the time or money for this and will go back to the tactical project approach. That is shortsighted and will result in greater time and money spent on results that are far short of what you should be achieving.
Do Not Obsess over the Architecture
Whatever you do, do not get too wrapped up in the architecture. Some companies will get so fixated on the final architecture that they take months or years trying to develop it. Imagine what that does to a budget and project schedule!
The architecture is not the result of your BI/DW project, but rather a means to an end. Do not spend time on a monstrous, complicated architecture that solves world hunger; design something that you can start developing toward and that you can evolve over time. The architecture sets your direction and goals. It is a set of guiding principles, but should be flexible enough to allow for incremental growth. The world is not set in stone. You will be faced with changing business conditions and new technology. A rigid architecture will not be able to accommodate the changes.
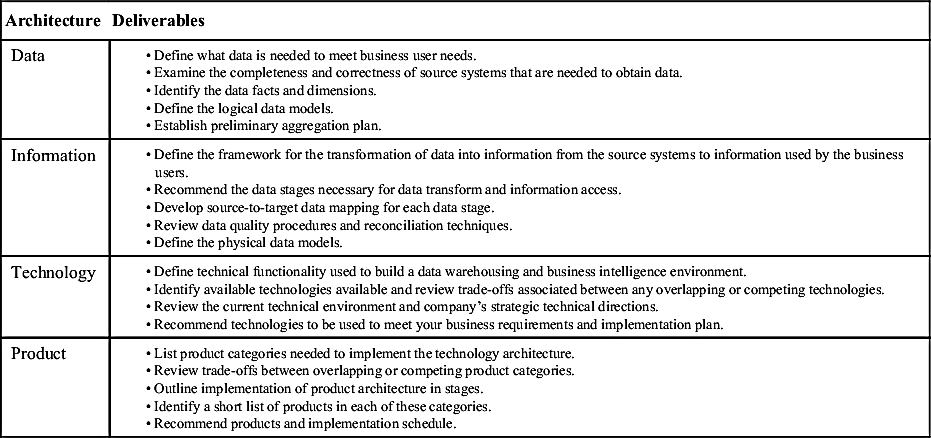
Table 4.2 sums up all the various steps of creating your architecture, but it leaves room for flexibility.
Table 4.2
Summary of Architecture Action Plan
Architecture
Deliverables
Data
• Define what data is needed to meet business user needs.
• Examine the completeness and correctness of source systems that are needed to obtain data.
• Identify the data facts and dimensions.
• Define the logical data models.
• Establish preliminary aggregation plan.
Information
• Define the framework for the transformation of data into information from the source systems to information used by the business users.
• Recommend the data stages necessary for data transform and information access.
• Develop source-to-target data mapping for each data stage.
• Review data quality procedures and reconciliation techniques.
• Define the physical data models.
Technology
• Define technical functionality used to build a data warehousing and business intelligence environment.
• Identify available technologies available and review trade-offs associated between any overlapping or competing technologies.
• Review the current technical environment and company’s strategic technical directions.
• Recommend technologies to be used to meet your business requirements and implementation plan.
Product
• List product categories needed to implement the technology architecture.
• Review trade-offs between overlapping or competing product categories.
• Outline implementation of product architecture in stages.
• Identify a short list of products in each of these categories.