The Business Demand for Data, Information, and Analytics
Abstract
In the business world, knowledge is not just power. It is the lifeblood of a thriving enterprise. Knowledge comes from information, and that, in turn, comes from data. Many enterprises are overwhelmed by the deluge of data, which they are receiving from all directions. They are wondering if they can handle Big Data—with its expanding volume, variety, and velocity. There is a big difference between raw data, which by itself is not useful, and actionable information, which business people can use with confidence to make decisions. Data must to be transformed to make it clean, consistent, conformed, current, and comprehensive—the five Cs of data. It is up to a Business Intelligence (BI) team to gather and manage the data to empower the company’s business groups with the information they need to gain knowledge—knowledge that helps them make informed decisions about every step the company takes. While there are attempts to circumvent or replace BI with operational systems, there really is no good substitute for true BI. Operational systems may excel at data capture, but BI excels at information analysis.
Keywords
Big Data; Data; Data 5 Cs; Data capture; Data variety; Data velocity; Data volume; Information; Information analysis; Operational BIJust One Word: Data
“I just want to say one word to you. Just one word… Are you listening? … Plastics. There’s a great future in plastics.”
Mr. McGuire in the 1967 movie The Graduate.
Welcome to the Data Deluge
Data Volume, Variety, and Velocity

Taming the Analytics Deluge
The Importance of Analytics
Analytics Challenges
Analytics Strategy
Too Much Data, Too Little Information
The Difference between Data and Information

The Role of BI in Creating Actionable Information
The Information Backbone
Data Capture versus Information Analysis
The Roles of BI and Operational Systems
Operational BI Blurs the Lines
Where Data Warehousing Fits in
The Five Cs of Data
Common Terminology from our Perspective
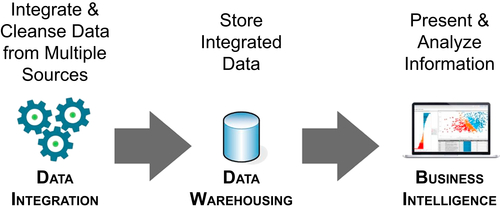
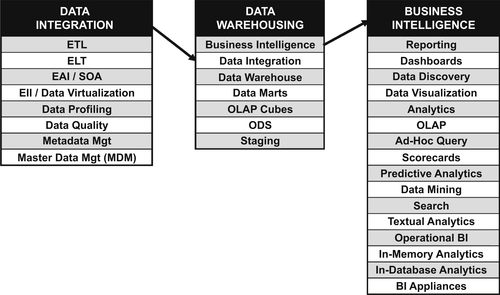
Table 1.1
| Term | Applies to BI, DW, and/or DI |
| Ad hoc query—People use SQL to make ad hoc queries to a database when the need arises. This is the opposite of predefined queries, which are performed routinely and known ahead of time. Tools for ad hoc querying can help you manipulate data for analysis and report creation. Most business people, however, do not really need ad hoc querying; they do fine with interactive reporting and data discovery. | BI |
| Analytics—The examination of information to uncover insights that give a business person the knowledge to make informed decisions. Analytics tools enable people to query and analyze information using data visualization to communicate findings in an easy-to-understand way. There are different analytical types: descriptive (what happened), diagnostic (why it happened), predictive (what is likely to happen) and prescriptive (what actions should be taken). Descriptive analytics is the most common and considered foundational or core. The others are labeled advanced analytics. | BI |
| BI appliance—Bundled hardware and software aimed at making it easier and more cost-effective for enterprises to purchase, use and maintain their BI solution. Scalability and flexibility are key benefits. There is a wide variety of architectures used in appliances, so a formal evaluation and proof of concept (POC) are highly recommended to ensure a match with your situation. | BI |
| BI application—Any BI project deliverable that the BI team develops for business people to use in their analysis. This can be a dashboard, scorecard, report, data visualization, ad hoc query, OLAP cube, predictive model, or data model. There can be many BI deliverables in an application. | BI |
| BI styles—There are different BI application types that a business person may use in performing their analysis, such as: reporting, dashboards or scorecards, OLAP or pivot analysis, ad-hoc query, statistical analysis, alerting or notifications, data discovery, data visualization, spreadsheets and advanced analysis. | BI |
| BI tool—A vendor’s software tool used to develop the BI application and deliver one or more BI styles. | BI |
| EAI (enterprise application integration)/SOA—Tools and methods for consolidating and integrating the applications that exist in an enterprise. The goal is usually to protect the investment in legacy applications and databases while adding or migrating to a new set of applications that exploit the Internet, e-commerce, extranet, and other new technologies. | DI |
| Dashboards—This BI tool displays numeric and graphical informations on a single display, making it easy for a business person to get information from different sources and customize the appearance. This is often a mashup of other BI styles. | BI |
| Data cleansing—The process of finding and fixing errors, inconsistencies and inaccuracies in data. The level of cleanliness required depends on each industry’s best practices. Data quality tools are used for the more complex processing while data integration tools performs basic processing. | DI |
| Data franchising—Packages data into a BI data store so business people can understand and use it. Although this creates data that is redundant with what’s in the data warehouse, it is a controlled redundancy. The data stores may be dependent data marts or cubes. Data franchising takes place after data preparation. | DW |
| Data mart—A subset of a data warehouse that’s usually oriented to a business group or process rather than enterprise-wide views. They have value as part of the overall enterprise data architecture, but can cause problems when they sprout uncontrolled as data silos with their own data definitions, creating data shadow systems. | DW |
| Data mining—This process analyzes large quantities of data to find patterns such as groups of records, unusual records, and dependencies. Data mining helps businesses sift through data to find patterns and relationships they do not yet know, such as “what is the likelihood that a customer who buys our hammer will also buy our nails?” | BI |
| Data quality—Achieved when data embodies the “five Cs”: clean, consistent, conformed, current, and comprehensive. | DW |
| Data preparation—The core set of processes for data integration. These processes gather data from diverse source systems, transform it according to business and technical rules, and stage it for later steps in its life cycle when it becomes information used by information consumers. | DW |
| Data profiling—An essential part of the data quality process; this involves examining source system data for anomalies in values, ranges, frequency, relationships, and other characteristics that could hobble future efforts to analyze it. It enables early detection of problems. | BI |
| Data governance—A process that enforces consistent definitions, rules, business metrics, policies, and procedures for how an enterprise treats its data. It can encompass many areas including data creation, movement, transformation, integration, definitions, all the way to consumption. A data governance program helps the organization treat its data as a corporate asset and maximize its value, but the process of governance is challenged by data that is unstructured and from the cloud, as well as by Big Data. | DI |
| Data visualization—Presenting data in a visual way, such as with graphs and charts, helps business people glean insights they might not otherwise discern from tabular data. Dashboards and self-service BI use data visualization, but it is only as effective as the quality of the data it draws upon. | BI |
| Data virtualization—Retrieving and manipulating data without requiring details of how it is formatted or where it is located. It enables enterprises to expand the data used in their analysis without requiring that it be physically integrated. They do not have to get IT involved (via business requirements, data modeling, and ETL and BI design) every time data needs to be added, allowing them to focus more on data discovery. Also called data federation and formerly called enterprise information integration (EII). | BI |
| Dimensional modeling—A generally accepted practice in the data warehouse industry to structure data intended for user access, analysis, and reporting in dimensional data models. | DI |
| ETL (extract, transform, and load)—The process in which data is taken from the source system, configured, and stored in a data warehouse or database. ETL tools automated data integration tasks. | DW |
| In-memory analytics—Leveraging advances in memory to provide faster and deeper analytics by querying a system’s random-access memory (RAM) instead of on disks. In-memory analytics architectural options include in-memory analytics in the BI tools, as part of the database or on the BI appliance platform. | BI |
| MDM (master data management)—The set of processes used to create and maintain a consistent view, also referred to as a master list, of key enterprise reference data. This data includes such entities as customers, prospects, suppliers, employees, products, services, assets, and accounts. It also includes the groupings and hierarchies associated with these entities. | DI |
| Metadata management—The classic definition of metadata as “data about the data.” metadata, is a means to an end—an enabler to the desired goal of making decision-support data accessible to the business community throughout an enterprise. In managing metadata, an enterprise needs to understand what the data means, how it was transformed from creation to consumption, and its associated data quality. | DI |
| ODS (operational data store)—A type of database sometimes used in a BI data architecture. Unlike a data warehouse, an ODS may serve both analytical and operational functions. | DW |
| OLAP (online analytical processing)—This technique for analyzing business data uses dimensional models often deployed as cubes, which are like multidimensional pivot tables in spreadsheets. It often answers the question “Tell me what happened and why.” OLAP tools can perform trend analysis and enable drilling down into data. They enable multidimensional analysis such as analyzing by time, product, and geography. The two OLAP camps are MOLAP (multidimensional) and ROLAP (relational). HOLAP (hybrid) combines them. | BI |
| Operational BI—Queries and reporting are performed on operational systems themselves, as opposed to the data warehouse. Most enterprises need a mix of operational BI and analytical BI from the DW. | BI |
| Predictive analytics—An advanced form of analytics that uses business information to find patterns and predict future outcomes and trends. Determining credit scores by looking at a customer’s credit history and other data is a typical use for predictive analytics. | BI |
| Report (or analytical) governance—BI deliverables need solid report governance in order to provide consistent information with which the business can make decisions. Report governance includes managing not only reports but also dashboards, scorecards, self-service BI, ad hoc query, OLAP analysis, predictive analytics, data visualization, data mining, and spreadsheets along with the data used. It is more accurate to refer to this as “analytical governance” rather than just report governance. | DI |
| Reporting—Collecting data from various sources and presenting it to business people in an understandable way so they can analyze it. This is the core BI style. Reports were initially static with predefined formats but have become interactive and customizable. | BI |
| Scorecards—Performance management tools that help managers track performance against strategic goals. These may be considered a type of dashboard. | BI |
| Self-service BI—Intuitive tools that allow BI consumers to obtain the information they need without the help of the IT group. People still need the IT group for the hard work of making the data clean, correct, consistent, current, and comprehensive. | BI |
| Structured data—Data that can be organized in a pre-defined record or file and may be stored in a database or spreadsheet. Some examples of structured data are an enterprise’s sales, employee and financial data. | DI |
| Text or textual analytics—The use of data mining for analysis of unstructured textual data such as emails. Text mining tools help find, for example, instances of fraud in thousands of emails or mentions of a company’s name in social media. | BI |
| Unstructured data—Data that is free form or unorganized. Email messages, tweets, PowerPoint, Word documents, or video images are examples of unstructured data. | DI |