Chapter 5
Information Architecture
Abstract
Information architecture is the framework that defines the business context—“what, who, where, and why”—necessary for building successful business intelligence solutions. An information architecture helps tame the deluge of data with a combination of processes, standards, people, and tools that establish information as a corporate asset. Using a data integration framework as a blueprint, you can transform data into consistent, quality, timely information for your business people to use in measuring, monitoring, and managing the enterprise. This gives your enterprise a better overall view of its customers and helps consolidate critical data.
Keywords
Data franchising; Data integration; Data integration framework; Data management; Data preparation; DIF; Information architecture; Master data management; MDM; Metadata management• Information architecture purpose
• Data integration framework (DIF)
• Data preparation
• Data franchising
• BI and analytics
• Data management
• Metadata management
• Operational BI versus analytical BI
• Master data management (MDM)
The Purpose of an Information Architecture
Despite the data deluge (discussed in Chapter 1) and the investment to analyze this data, typical business analysts and managers spend a quarter of their time hunting, gathering, importing, integrating, and transforming data in spreadsheets just to keep their enterprise running. Note that these managers and analysts, the people reporting to vice presidents or chief financial officers, are the backbone of the knowledge workers in most corporations today, so if they are bogged down hunting and gathering data, then corporations are bogged down.
Enterprises have business applications that perform the many business processes needed for their operations. The information architecture enables the business to perform analytics on these diverse processes, whether they are selling a product, monitoring a patient’s vital stats, posting a student’s grades, or tracking the performance of financial accounts. It is tempting to look at each of these processes as unique and implement each business intelligence (BI) application independently. If there is an underlying information architecture, the project-oriented approach works well, especially because it concentrates on supporting specific business processes. But if there is no information architecture, the result will be silos, which thwart effective analytics and carry a high cost in time and opportunity lost.
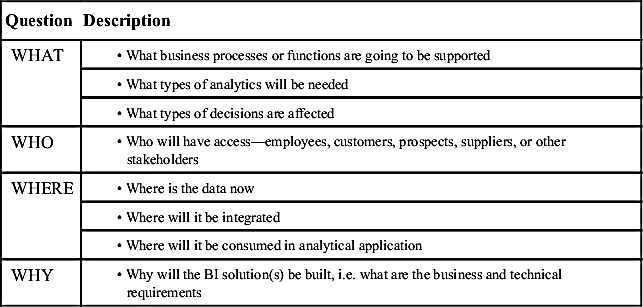
The information architecture defines the business context—“what, who, where and why”—necessary for building successful BI solutions. Table 5.1 lists the key questions that need to be addressed when designing the information architecture.
Table 5.1
The Information Architecture Questions
This chapter introduces the key areas you need to examine when designing the information architecture:
• Data integration framework (DIF), which includes data preparation, data franchising, BI and analytics, data management, and metadata management
• Operational BI and its role versus analytical BI
• Master data management (MDM)
Data Integration Framework
The DIF is a combination of architecture, processes, standards, people, and tools used to transform enterprise data into information for tactical operations reporting and strategic analysis. People tend to equate data integration with an extract, transform, and load (ETL) tool. Although ETL tools can automate specific functions and improve BI development productivity, they are only one element within a DIF. Oversimplifying data integration creates the impression that it is quick and easy if you buy the right tool. This leads to false business hopes and makes it more difficult to explain why you have multiple information silos.
The DIF is a blueprint and set of guidelines to transform data into consistent, conformed, comprehensive, clean, and current information for your business people to use in measuring, monitoring, and managing your enterprise. The components of DIF are outlined in Table 5.2.
The discussion on information architecture follows; the other DIF components are covered in more detail further in this book:
• Processes and Standards—Part IV, Part V, Part VI
• Resources and Skills—Chapter 17
• Tools—Chapter 7
Table 5.2
| Building Blocks | Purpose |
| Information architecture | Staging data from data sources to “information consumers” |
| Processes | Gathering, consolidating, transforming, cleansing, and aggregating data and metadata |
| Standards | Ensuring data consistency, accuracy, integrity, and validity |
| Tools | Assisting in the creation, deployment, management, and expansion of this framework |
| Resources and skills | Correct use of the tools and successful implementation of the architecture, processes, and standards |
DIF Information Architecture
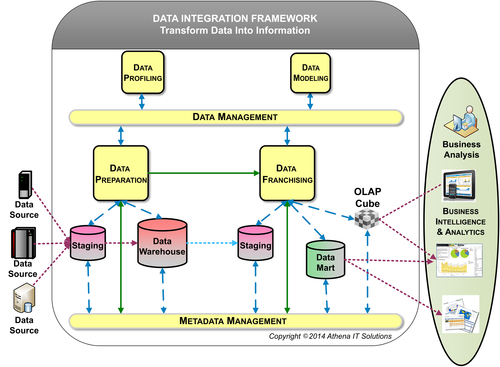
The DIF information architecture’s objective is to gather data that is scattered inside and outside an enterprise and transform it into information that the business uses to operate and plan for the future. Data is gathered, transformed using business rules and technical conversions, staged in databases, and made available to business users to report and analyze. Data flows from creation through transformation to information, just as materials flow from the supplier (enterprise resource planning systems, transaction systems), to factory (data integration), to warehouses (data warehouses (DWs)), and finally to retail stores (data marts and business analytic applications).
The DIF information architecture depicted in Figure 5.1 illustrates the processes that transform data into useful information as it progresses from source systems to the BI tools where business people analyze that information. The diagram shows a simplified version of a conventional hub-and-spoke architecture with an enterprise data warehouse (EDW) feeding multiple data marts. These concepts will be covered in more detail in Chapter 6. You will learn about the data integration workflow and all the potential data stores that may be included in an enterprise’s data architecture such as sub-marts, federated DWs, operational data stores (ODSs), closed-loop systems, and analytic applications.
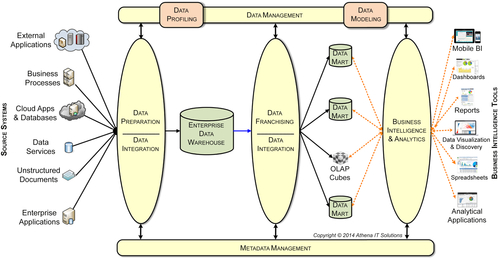
The DIF information architecture is composed of:
1. Data preparation: the first data integration stage includes gathering, reformatting, consolidating, transforming, cleansing, and storing data – both in staging areas and in the DW.
2. Data franchising: the second data integration stage reconstructs data into information for reporting and analysis with BI tools. Often, data is franchised from a DW into data marts or cubes. The data is filtered, reorganized, transformed, summarized/aggregated, and stored.
3. Business intelligence and analytics: these processes retrieve the data stored in the information architecture and delivers it to business users using BI applications. These applications can take the form of reports, spreadsheets, alerts, graphics, analytic applications, and slice-and-dice cubes. BI tools, spreadsheets, and analytic applications enable these processes, sometimes doing so through portals.
4. Data management: the processes and standards used to define, govern, and manage an enterprise’s information assets (within the BI domain.) This establishes the specifications for what data will be selected and how it will be transformed for analysis in BI applications.
5. Metadata management: similar to software development management, is the behind-the-scenes processes, procedures, and policies that define and manage the metadata used and exchanged within the DIF. Metadata defines the data flowing from source systems, transformed in DIF components, and finally consumed by business people in their analysis with BI tools.
Data Preparation
Data preparation is the core set of processes for data integration that gather data from diverse source systems, transform it according to business and technical rules, and stage it for later steps in its life cycle when it becomes information used by business consumers.
There are no shortcuts with data preparation. Don’t be lulled by the “silver bullet” a vendor or a consultant may try to sell you, saying that all you need to do is point a BI tool at the source system and your business group will have what it needs. That oversimplifies data integration into a connectivity issue alone. It’s a lot more than that.
The reason the solution is not just point-and-click with a BI tool is because data preparation involves many steps. The complexity of these steps depends on how your business operates, as well as how your business systems are implemented within your enterprise. Physically accessing the data in source systems is the easy part; transforming it into information is where the hard work is. This is something people don’t appreciate if they have only been dealing with proofs of concept (POCs) or departmental business solutions rather than enterprise-wide, real data solutions.
Data Preparation Steps
The processing steps involved in data preparation as depicted in Figure 5.2 are:
• Gather and extract data from source systems. An enterprise’s source systems may have a mix of custom-built, on-premise, and cloud-based applications along with many external sources. Although it is generally easy to get data out of any of these sources, it is still time-consuming to understand and obtain definition of its content. The best practice is to designate a subject matter expert to get that information and, if it is an internal system, to make the group maintaining that source system responsible for its extraction processes. They might not code it, but they own it.
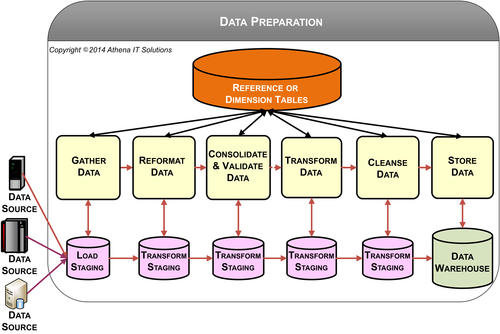
• Reformat data. The source systems’ data needs to be converted into a common format and schema to be fed into a DW. This is essential but straightforward provided there are schema and column definitions.
• Consolidate and validate data—Multiple data sources may need to be consolidated and standardized to provide a single, consistent definition for business consumers to use in their analysis. The data is validated by querying dimensions or reference files to determine if it conforms to specific business rules. The validation process ensures referential integrity in database terms.
• Transform data—Business transformations turn data into business information. These transformations include business rules, algorithms, and filters that convert data into a business context. Transformation may also associate a business transaction in a dimensional context such as the region, business division, or product hierarchy it is associated with.
• Data cleansing—Much of the simpler data quality checking, such as reformatting, consolidation, validation, and transformation, has already taken place. Data cleansing involves a more sophisticated analysis of the data beyond the record-by-record checking that has already taken place. Name-and-address cleansing and customer householding are two examples.
• Store data—Data is stored to make it available for further processing in the data architecture.
Figure 5.2 depicts the data preparation processes in a logical progression. Although the sequence is accurate, the physical implementation may involve a combination of many of these processes into a sequence of source-to-target mapping operations or workflows. Also, although the diagram implies that you’re storing intermediate results in a staging database, it’s only a logical representation. Intermediate mappings may involve the use of in-memory processing or temporary tables based on performance and efficiency considerations rather than persistent storage in database tables.
Reference or dimension tables are used in these processes for referential integrity checking, looking-up foreign keys, and cross-mapping to reference codes.
Definition Takes More Time than Development
Data preparation processes are the lion’s share of the work of any DW or BI project—estimated at 60 to 75% of the project time. Project delays and cost overruns are frequently tied to underestimating the amount of time and resources necessary to complete data preparation or, even more frequently, to do the rework necessary when the project initially skimps on these activities and then data consistency, accuracy, and quality issues arise.
Almost everyone—IT, vendors, consultants, and industry analysts—associates data preparation solely with ETL development work. ETL tools are indispensable in a BI project because of the many benefits they provide (see section on data integration for further details), but do not significantly reduce or speed up the majority of the data preparation work. The reason is that the bulk of the time is spent on defining the sources (getting data from source systems), data profiling, defining the targets (putting data in DWs, ODSs, and data marts), source-to-target mapping, and business transformations. This definitional work is time-consuming because it involves meeting, discussing, and obtaining consensus on the definitions and transformations with source systems’ subject matter experts and business people. As the number of systems and people expands, these activities expand disproportionally.
Consolidating and Cleansing Data
Although the data gathering, reformatting, transforming, and storing data processes are straightforward, the consolidation and data cleansing processes are typically much more complex. Many BI projects oversimplify these processes and fail to design the data preparation processes that will result in consistent, conformed, and clean data.
Ensuring data quality is a part of the data preparation process that is required for the business to effectively use the data. Most people consider data quality to be checking for error conditions, data format conversions and mappings, and conditional processing of business rules based on a combination of dimension values or ranges. These types of data quality processes can be adequately performed with an ETL tool if planned for and designed into the overall data preparation architecture. A more important aspect of data quality, however, is data consistency rather than simply error detection or data conversion. Data may be valid in its transactional form when brought into a DW, but become inconsistent (and incorrect) when transformed into business information. Data preparation needs to take into account these transformations and ensure data quality and consistency. Tools alone will not enforce this consistency unless it is defined and then designed into the processes.
There are certain types of data quality that are better handled by special-purpose data cleansing tools rather than ETL. Data cleansing tools manage a wide variety of complex data quality issues that companies encounter, particularly those related to customer data such as cleansing customer names and addresses. A customer name and address may be input in different variations across source systems. Examples: a company may be stored as IBM, IBM Corp., or International Business Machines Corporation, while an address might be input as “12 Main Street,” “12 Main St,” or “12 Main Street, Suite 135.” Although we can visually match these variations, it is not as straightforward a task with ETL tools or SQL. Because of this, companies facing problems like large lists of customer names and addresses can purchase specialized data cleansing software to perform this matching and standardization into one representation in the BI environment.
Another example of specialized data cleansing is the householding that financial service firms and retailers perform. The household process links family members’ personal and business accounts or purchases together both for their customers’ convenience and for their own convenience in promoting a full range of their products or services to their customers. Householding offers business value because it improves the ability of an enterprise to cross-sell and up-sell, and reduces redundancy. You know a company is not doing householding right when it mails both you and your spouse the same promotional brochure.
Data cleansing tools are important additions to enterprises’ arsenals for ensuring data quality and consistency. Be careful, however, not to equate data cleansing tools with data quality. While the data cleansing tools provide data preparation processes for data quality, they are not the only processes that are needed in that area. Many see the data cleansing tool as a silver bullet. Others feel that if they cannot afford those tools (or they are not applicable to their situation), then they can forget about data quality. You can never forget about data quality, and you have to build data quality processes throughout data preparation.
Data Franchising
Data franchising takes place after data preparation has gathered and transformed data from source systems into a DW. Data franchising takes the data from the DW and transforms it into the information consumed in business analysis by using BI tools. Granted, this creates data that is redundant with what is in the DW, but it is a controlled redundancy with the first stage being data preparation and data franchising the second stage. The downstream target may be either a dependent data mart or a on-line analytical processing (OLAP) cube.
The Need for Data Franchising
A DW stores enterprise-wide data, both current and historical, gathered from many source systems in a manner that is efficient for IT to define, manage, and control. Data franchising packages data from the DW for several reasons:
• Business people can understand the data. The DW-tier in the BI data architecture (see Chapter 6) needs to be subject-oriented or both application- and business-process-neutral. If the DW does not provide neutrality, then it does not serve an enterprise role. Problems arise when a BI team concentrates on designing a DW to solely meet the needs of a specific business function, such as finance, or business process, such as supply chain management. The BI team’s intent is to include others later, but the DW becomes so specific to the business group or process that it is not really usable by others. Instead, the business transformations, business rules, filters, hierarchies, and aggregations that are specific to a business group or process should be implemented in the data franchising processes to create data marts or cubes that are oriented toward them. The resulting data stores are in the business context of their consumers—people from business groups or involved in business processes—making it more easily understood and analyzed by them.
• BI tools can more effectively present the data. Of all the DIF components, data franchising is the most likely to be influenced by tools – in this case, the BI tools that you deploy in your DIF architecture. You need to design the data stores used by BI tools in a manner that most effectively exploits their capabilities. You can split BI tools into two categories based on what schemas they will work best with:
1 Dimensional models deployed in data marts
2. OLAP cubes or other proprietary schemas
When the BI tools work well with dimensional models, there are performance and usability considerations regarding the physical schema loaded through data franchising. Although your BI tool may be able to point at almost any data source and query it, the reality is that the data needs to be packaged appropriately. Design considerations in dimensional schema may include the following (see the data modeling chapters for detailed description of these concepts):
• Star versus snowflake
• Pre-built aggregated tables
• Handling hierarchies
• Shrunken dimensions
• Slowly changing dimensions
• Rapidly changing dimensions
• Multi-valued dimensions
When tools, such as OLAP, require proprietary schemas, you will need to use data franchising processes to load the data into the proprietary schema (tool-specific) in addition to performing the business-specific processes. Typically, the proprietary schemas will have their own design, tuning, and operational environment similar to relational databases. There may be advantages to using cubes rather than data marts, but that decision needs to be made based on business and technical considerations (see Chapter 7).
• Improves business and IT productivity. Having data franchising perform business-specific filtering, transformations, metrics calculations, and aggregation improves business and IT productivity. To understand this, it is best to examine what happens in its absence:
• IT builds BI applications with embedded filtering, business transformations, metrics calculations, and aggregations.
• Business people repeatedly filter, perform transformations, create metrics, and aggregate data to tailor data specific to their business group or process.
Embedding the processing logic in the BI applications that would have been implemented in data franchising has three drawbacks:
• First, the logic is often repetitive and redundant across multiple reports, particularly when used by business groups or processes. To avoid repetitive logic built into each BI report or executed with each query generated from BI analysis, it often makes sense to stage data for further analysis. When data is not staged, you have to repeat the same steps for every report or analysis. Generally, business groups need the same data analysis over and over again, so it’s a lot more efficient to just stage it once.
To illustrate, look at a simplified example that includes only one of the many dimensions that business users need. Consider a company with global sales data that wants to franchise a U.S. sales-by-product-line data mart. The data franchising process would begin by filtering only U.S. sales records and associating them with product information. This would reorganize the data so that sales transactions (facts) would be coupled (denormalized) with product-related information (dimensions). There may be certain business rules or transformations that would associate sales transactions with specific business units, product categories, or some other grouping. Data may be stored in an aggregated or summarized state to improve performance, or that might be done later when a report or analysis is generated. Without data franchising, each BI application would need to embed this logic.
• The second drawback is that when the logic is embedded in BI applications, it is executed at analysis instead of being pre-built once in the data mart or cube prior to the business person using the BI application. Business people are quite sensitive to BI dashboards taking too long to start up or to query data after they have made their selections. Adverse BI application performance has driven many business people to abandon BI applications and retreat back to their spreadsheets.
• The third drawback is that the logic needed in a BI application may be too complex to widely deploy or maintain. There are three problems with doing complex transformations in a BI report. First, it becomes expensive to maintain. Second, and more important, the reports get out of sync with one another and have conflicting numbers. As soon as the business users see inconsistent numbers in their reports, they’ll question their integrity. Then, someone has to do a costly reconciliation to determine which numbers are right. Third, the logic is seldom documented in business terms, creating business risks.
• Enables pervasive self-service BI. BI tools continue to become easier for business people to use, but BI self-service remains an elusive goal in many enterprises. BI teams are often quite encouraged with the reception received with initial BI self-service attempts using pilot or POC projects to evaluate these tools. However, the BI team becomes frustrated when the enterprise-wide deployment is unsuccessful. A key reason for this is not because of the tool, but rather the business context of the data. In the pilot, the business people saw the data relevant to them, while during the enterprise-wide deployment they were accessing the DW. Using data franchising to deploy business-specific data marts enables BI self-service to be successful on an enterprise level.
There is an unfortunate tendency for people to overlook data franchising. They focus on the huge data volumes in their DW and assume that data integration is complete. However, data is not transformed into information until the business person obtains it, examines it, and acts upon it. Too often, business people do much of this data franchising by pulling data into a spreadsheet and transforming, aggregating, and summarizing it manually or by creating macro filters. Currently, it is possible to automate, document, and manage most of the data franchising used in a corporation. The more data is automated and managed, the more information quality and consistency are improved. Business-user productivity improves dramatically when work is shifted from data gathering and messaging to information analysis and action.
Data Franchise Steps
As shown in Figure 5.3, data franchising involves data filtering, reorganizing, transforming, summarizing, aggregating, and storing data generally extracted from a DW or ODS. Sometimes, external data sources are introduced either to increase dimensionality or to add attributes for analysis that may not have been in the original source systems. For example, a company might purchase or use external data for customer demographics or credit scoring.
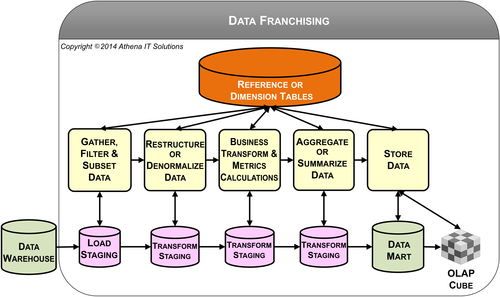
The data franchising processes are:
• Gather, filter, and subset data. With the presumption that the data gathered has already undergone data preparation so it is consistent, conformed, clean, and current, then the focus shifts to rather straightforward processing. You are typically getting the data from one source and then filtering it by rows and columns to gather just what is needed by the target data store.
• Restructure or denormalize data. The target schemas will be different from the source in terms of content (subset) and possibility structure if non-relational databases are used. This process performs the source and target mappings.
• Perform business transformations and metrics calculations. Data marts and cubes typically support specific business processes. This process will perform the business transformations and metrics calculations that are used by these specific business processes.
• Aggregate or summarize data. Depending on the BI tool you’re using, you may need to create aggregations or summarizations to improve query response time, especially when dashboards or scorecards display aggregated data into which the business person can drill down.
• Store data. The primary target data stores are data marts and OLAP cubes.
Dimension or reference tables are used in the data franchising processes for:
• Referential integrity
• Lookups and cross-maps
• Business metric calculation
• Query selection criteria
• Aggregations
• Report value bands
The steps for staging data stores for loading and transforming are depicted in Figure 5.3. They are typically transient rather than persistent—the opposite of data preparation—because data volumes and data integration processing are not sufficient to warrant persistent storage.
Differences between Data Franchising and Data Preparation
Data franchising is the aggregation, summarization, and formularization of data for use with BI tools. This process overlaps with data preparation with regard to extracting the data from a data source and reformulating it into a data mart. The data franchising component, however, does not need to perform many of the more sophisticated data integration functions of data preparation processes. There are four main differences:
• First, the data sources used by data franchising are often the DW or ODS rather than the many, and sometimes conflicting, data sources used to initially build the DW or ODS.
• Second, the data preparation stage performs the data cleansing processing necessary to accumulate data from its sources. This means that the data franchising component is dealing with clean data (or at least does not need to perform those functions).
• Third, data preparation has already performed such processes as conforming dimensions, managing slowly changing dimensions, updating dimensional hierarchies, and handling all the intricacies of historical data. Again, data franchising starts processing when these more difficult issues have been addressed.
• Fourth, the DW or ODS is stored in a relational database with a documented data model and its associated data definitions. The best practice, as explained in the section on data design, is for the DW to be designed with a hybrid (or advanced) dimensional model and any data mart to use a standard dimensional model. The processing of this data is more straightforward than in the data preparation stage, so you have a wider range of tools from which to choose. Although you may be more productive if you use a single ETL tool for both data preparation and data franchising, it may be more economical and faster to use a less robust ETL tool or do custom coding.
You may find yourself with a target database requiring special processing that a general-purpose ETL tool cannot provide. Examples are multidimensional online analytical (MOLAP) BI tools that store their data in cubes and relational online analytical (ROLAP) BI tools that store their data in a relational database but need it set up a specific way in order to work. Often, an OLAP BI tool includes ETL tools or utilities that move data into its databases so that BI tools can access them. In other cases, you may need to create custom code.
BI and Analytics
Two roles of BI in the information architecture are to provide:
• Front-end processes visible to BI application users to interact with, analyze, and present results in graphic or tabular form.
BI applications are the only portion of the information architecture that the business person interacts with. It is common to hear the business refer to the overall environment by the name of the BI product being used.
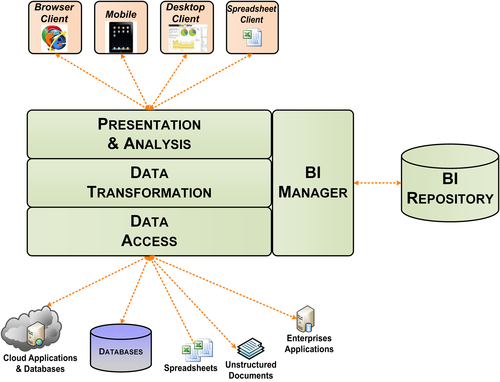
Although many refer to the BI and analysis as the presentation layer of the information architecture, that is too simplistic and ignores the information processing that occurs in this layer. Figure 5.4 depicts the various components that process the information that the business person selects, transforms, presents, and analyzes:
• BI manager: The application controller that orchestrates the BI processes and interfaces with the BI repository and its supporting metadata.
• BI repository: Stores the metadata used by the application. This may include screen layouts, data definitions, filters, measures, annotations, scheduling, workflow, version control, access control lists, and data access specifications. The repository uses a database or files for storing its metadata.
• Data access: Retrieves data from the various data sources specified in the application. BI tools will bring the data into memory, a database, or file structure for transformations, presentation, and analysis. The data brought in for these purposes may be either transient or persistent based on the specific BI tool used.
• Data transformation: Enables the application to transform data based on the analytical needs of the business. There will typically be many pre-built capabilities offered by the BI tool, but most tools enable manually coded transforms. The coding may use a tool’s proprietary language or an industry standard such as SQL or multidimensional expressions (MDX).
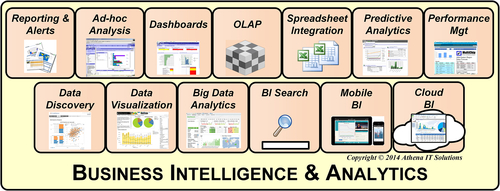
• Presentation and analysis: The component the business person interacts with to select, view, and analyze data. One or more of the BI styles depicted in Figure 5.5 will be available for those interactions.
The powerful transformation capabilities are both a blessing and a curse in the information architecture. From a positive perspective, it provides more processing options in the architecture to transform data tailored to the needs of business processes, groups, or people. The dangers are how that is accomplished or to what extent it is relied upon.
When transforming data, the objectives should be that it is shared, reusable, and documented. It is very important that metadata about the transformation is available to enable tracing the flow of data from source to its analysis. To ensure the information 5 C’s, it is ideal to perform the transformation once and use it many times. This “do once and use many times” approach is what the various data stores in the BI data architecture accomplish and what we strive to extend throughout the entire information architecture. A guiding principle is to shift data transformation as far upstream—from BI to data franchising to data preparation—as it makes sense. Moving this processing upstream increases the extent of reusability, improves the probability of consistency and likely will be more efficient in terms of resources – both people and infrastructure.
The most significant risks when transforming data in BI processes occur when it is done with manual coding: it may not be reusable, it won’t be visible to anyone other than the developer, and it might not be documented. This creates a black hole where we do not know what happens to this data; it’s a similar situation to when data is manipulated in a spreadsheet with macros without anyone other than the spreadsheet owner knowing what happened. Using extensive manual coding increases the overall costs of developing and maintaining the BI application, eliminates the ability to perform impact or where-used analysis on the data, and can adversely affect upgrades, migration, and enhancements to the BI application.
Data Management
Data management encompasses the policies, procedures, and standards used to design and manage the other information architecture processes: data franchising, data preparation, BI, and metadata management. This is a very broad category that can sometimes make you feel like you are trying to boil the ocean. To try and make the task more manageable, you can select what you will do by prioritizing these activities based on their long-term business impact and return on investment. Too often we fall into the trap of choosing one extreme or the other. We either try to do too much and end up accomplishing nothing, or we ignore data management altogether and face significant business risks and costs.
The key joint business and IT initiative to implement data management is data governance. This process drives the prioritization of the data management policies, procedures, and standards. Chapter 17 describes data governance in more detail.
Two data management processes that are too often ignored or shortchanged are data modeling and data profiling. As depicted in Figure 5.6, they are used to understand existing data and then define the data in the BI environment. Data profiling and data modeling are two processes that go hand-in-hand with data preparation. Data profiling is a precursor to data preparation because it helps you understand the data in the source system in order to prepare it for BI. Data modeling complements data integration by defining the target data structures it will load.
Metadata Management
As discussed in Chapter 4, metadata is the description of the data and information processes that affect it as it moves from data sources to information consumption. Metadata is generated by many of the tools used in the BI environment, and also created by design, development and deployment activities such as gathering business requirements.
Metadata Categories
You should capture and manage the following categories of metadata within the information architecture:
Data definitions—Documenting data element descriptions should be part of the requirements gathering of any BI project. As such, you have already done the heavy lifting for this type of metadata. This is where most metadata initiatives start, and typically you create a data dictionary. Although the data elements are initially documented in the project’s business requirements document, they are usually stored and queried from a data modeling tool or BI tool accessing a customized data dictionary stored in a relational database. More sophisticated projects may have purchased and deployed a metadata repository.
ETL source-to-target mapping—If you have used an ETL tool rather than custom code, this should be an easy step. Your ETL tool should have a catalog that you can use for documentation and examining the ETL workflow. You can examine and query data lineage, at least within the context of your ETL code, to determine how a data element was transformed, as well as the impact of a change on that data element or workflow. This metadata, although of interest to business, is generally an IT tool and improves their productivity.
BI applications—This metadata includes cataloging the data accessed by BI applications, filters, and queries used; workflow of data processes; and data transformations. Most of today’s top-tier BI products come with BI repositories that store the metadata. In addition, portals are also available within these BI product suites that allow grouping of reports, queries, and data elements that business people can access.
These metadata categories are typically straightforward to gather and maintain as separate entities by using the appropriate BI, ETL, and database tool features. These tools typically manage metadata only in their domain, so without a metadata repository product the BI team will need to manage this metadata in silos.
Metadata Value
Metadata management provides value to both the business and IT:
Business value—For the business people using the BI environment, metadata should serve as their documentation and reference materials. We may complain about the quality of the documentation we receive from vendors, but what about the documentation that we provide to the business people? No matter how powerful or easy a BI tool is, business people need to know what data they are using with it. We need to provide the business metadata, i.e., the BI’s documentation, along with the BI applications for them to understand what the information they are analyzing represents. Where did it come from, how was it transformed, and what does it mean as they use it?
IT value—For IT, metadata management coupled with source code management is essential for designing, developing, and managing the information management processes. Business requirements and coding specifications indicate what we intend to build, but it is the metadata that actually describes what has been built, tested, deployed, and is currently being used. Two key technical benefits of metadata management are lineage analysis and impact analysis. Lineage analysis enables the tracing of data from its source to eventual use in analysis, including all the processing steps that were taken to get there. Impact analysis provides the ability to determine how ETL and BI applications are affected by changes in data sources along with how an analysis will be affected if the data selected is altered.
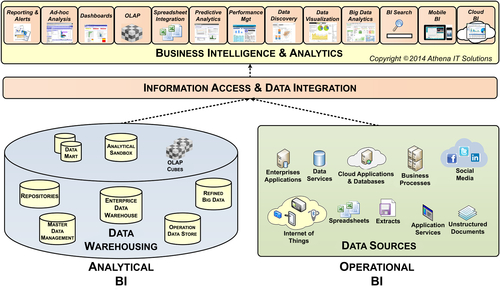
Operational BI versus Analytical BI
One of the ongoing struggles enterprises wrestle with is the clash between operational versus management reporting. Operational reporting is tied to specific applications and is typically provided by the application vendor as a pre-built offering. Management reporting spans applications, is typically tied to a DW, and is custom-built using BI tools. The term management refers not only to an enterprise’s management staff, but also business analysts and any non-operational personnel.
Operational reporting is essential for the business people involved in running the business on a day-to-day basis. Business transactions and events are captured, monitored, and reported on by the operational applications. The benefits of relying on the application’s operational reports are:
• Pre-built reporting that does not require an IT project to custom-build the reports or load the data into a DW
• Real-time data access, enabling the business to get the most up-to-date data.
• Integration and cooperation with operational processes, to streamline and expedite these processes.
• Data that is presented in the terminology of the underlying application that is well understood by its business users.
Because enterprises have multiple source systems, management reporting used DWs that were devised to integrate the source systems and provide the business with the five C’s of data: consistent, conformed, comprehensive, clean, and current.
For quite a while these two worlds—DW versus applications—were clearly separate domains with their own business consumers, IT staffs, budgets, and expertise. There was no overlap between the people using it, the tools, the data, or the expertise needed. The closest these groups came to working together was the scheduled feeds from the application to the DW, but even these were generally handoffs to the BI team, which then went about doing its own thing.
The BI landscape has changed over time in several ways:
• Business people need both operational and management reporting
• Some application vendors even built their own DW product offering
• The data currency gap—the frequency of updating the data has narrowed or has been eliminated in some instances.
The application vendor landscape has changed with a split between mega-vendors offering applications with a significant enterprise footprint across many business processes and specialty application vendors targeting specific business processes or industries. Enterprises encounter a proliferation of applications, often a mix of on-premise and cloud-based, each with their own operational reporting environment.
The result of these changes has been the rise of many reporting silos providing overlapping and inconsistent data when compared to the enterprise BI environment using a DW. With the 5 C’s of data broken in this landscape of data silos, what is IT to do? Assuming that it is not acceptable to continue to maintain the status quo of reporting silos, these are the alternatives:
• Shift business users to a specific application reporting silo and supplement the operational reporting with data from other applications
• Shift all reporting to the DW-based BI environment
• Blend application-specific and DW BI environments
Shift All Reporting to the Application-Specific Environment
There are two types of application vendors where this scenario get serious consideration:
1. Mega-application vendor. This type of application vendor has a significantly robust application that spans many business processes, offers its own DW environment, and may even sell one of the major BI tools in the marketplace (a tool that it acquired when it purchased the original BI vendor).
2. Application vendor supporting cross-function business process. This type of application vendor has a significant business footprint in an enterprise, offers capability to import other application data, has an application development platform, and likely has cloud-based support.
A key—and erroneous—assumption in this scenario is that the application-specific reporting platform can be a substitute for the DW or even make it obsolete. Although it’s possible to bring data into the application environment, you’ve got to ask if it can do an adequate job or even try to. Nearly every enterprise, no matter how large or small, needs a significant data integration effort to create data consistency, data integrity, and data quality. It doesn’t happen overnight and it takes substantial resources with 60–75% of a DW effort spent on data integration, not creating reports. Even if the application’s data integration capabilities were up to the task, why would an enterprise shift its focus from supporting business processes to being a DW? Why would an enterprise migrate its DW environment to the application when there would be such a large cost, loss in time, and drain on resources? And if the DW was not replaced, then the enterprise is, in effect, expanding its multiple reporting silos to multiple DW silos. This makes no sense.
A second erroneous assumption is that all business people need real-time data from an application. Certainly many applications, such as call centers and inventory management operations, truly benefited from the real-time information. But then everyone wanted real-time data. Operational BI was seen as the way to get it.
The reality is that most business analysis does not need real-time data. In fact, real-time data would cause problems or create noise, e.g., inconsistent data results, that would have to be filtered out. Much of what business people do is examine performance metrics, trend reports, and exception reporting. Most are looking at daily, weekly, monthly, and year-to-date analysis, not hourly analysis or trends. There are some industries where that would be useful, but with most it doesn’t matter what was sold between 9:05 a.m. and 9:30 a.m. today.
Remember, you build performance management and BI solutions to satisfy a business need. Real-time BI often is suggested because it can be done technically, not because of a business need. Do you really want to spend the resources, time, and budget for something the business doesn’t need?
Shift All Reporting to the DW-Based BI Environment
Although there are many DW zealots that state that all reporting should come from the DW, there are many practical reasons why this, like the shift to exclusively using applications-based reporting previously discussed, should not be pursued.
With advances in data integration capabilities and productivity, enterprise BI environments can capture data near-time or even real-time if there is a business need. This removes one of the technical constraints on the DW’s ability to provide operational reporting, but there are other considerations.
The primary reason to not have a DW assume all operational reporting is simply, “If it ain’t broke, don’t fix it.” If the application’s pre-built reporting is being used and relied on, particularly if it has been embedded in an enterprise’s business processes, you should not pursue a replacement project with the associated expense, time, and resources to duplicate something that is working. This would result in a lost opportunity to invest those resources into expanding an enterprise’s overall BI capability and usage.
In addition, the application vendor will likely be expanding, updating, and maintaining its operational reporting offering, which means that shifting this reporting to the DW would be a continuing drain to duplicate what the vendor is providing.
Blend Application-Specific and DW BI Environments
With the understanding that neither the DW nor the application-based operational reporting will be sufficient unto themselves, the solution is to blend these together. Although an enterprise could just keep each environment in its own silo, it is very likely that business people will not see consistent information in each silo. In addition, with totally separate silos, the business consumers need to know which one to use under what conditions and their experience within each silo will be different. Leaving the silos as is will be a drain on both IT and business productivity.
The recommendations for creating a blended environment, as depicted in Figure 5.7, are to:
• Create a data architecture for your business users that includes the enterprise applications, DWs, data marts, cubes, and even spreadsheets that are needed to enable both operation and management reporting (see Chapter 6).
• Create a technical architecture that enables data to be transformed and moved in whatever manner is appropriate for the business purpose (see Chapter 7). There are many times that data should be queried from the enterprise application directly rather than insisting that the data be moved to a DW before the business people can access it. Data virtualization, for example, enables querying across disparate data sources, i.e., enterprise applications, where in the past the data had to be physically moved into a common database using an ETL tool.
• Create an information architecture that enables a BI portfolio for your business people that spans operational and management reporting. Business people do not need to understand the differences. They simply need to perform their analysis regardless of where the data is located in your data architecture.
• Leverage common BI tools across your BI portfolio. Business people should be able to use the same BI tools for their reporting and analysis, regardless of where the data comes from. They should not need to change their behavior based on where in the data portfolio their analysis needs are met. Simplify their lives by letting them go to one place and use one set of tools.
There should not be a business distinction between operational and analytical BI when it’s properly designed into your information, data and technology architectures.
Master Data Management
MDM is the set of processes used to create and maintain a consistent view, also referred to as a master list, of key enterprise reference data. This data includes such entities as customers, prospects, suppliers, employees, products, services, assets, and accounts. It also includes the groupings and hierarchies associated with these entities. The need for MDM arises when there are multiple, independent sources for an entity.
Many enterprises need MDM as part of their information architecture to create consistent and conformed reference data. When designing an information architecture, follow these steps with respect to MDM:
• Identify what reference data needs MDM.
• Determine where in the information lifecycle inconsistent data creates business risks.
• Assess what type of information processing is needed to create consistent reference data.
Identify the Data
You need to identify what reference data needs MDM. MDM is the catch-all term used, but the following names apply to specific data subject areas within MDM:
• Customer data integration (CDI)
• Product information management (PIM)
• Global supplier management (GSM)
• Enterprise master patient (or person) index (EMPI)
An enterprise has many dimensions, but for MDM processing include only those with multiple, independent sources that create inconsistency when combined. After you select which dimensions are needed for MDM, perform these tasks:
• Perform source system analysis to determine where and how this data is created, modified, and deleted.
• Conduct data profiling to examine what has already been stored, its current state, and its data structures.
• Get business people to sign-up for data ownership responsibilities
• Document definitions and business processing rules
• Establish data governance processes for MDM
Never assume that technology will solve your MDM problems without significantly including people, processes, and politics in the equation. Data governance, with the business taking ownership of the data and IT becoming the custodian, is needed to successfully design, deploy, and sustain an MDM solution.
Business people need to help IT identify master data, define it, and assist in determining what the resultant master list should be. Managing master data needs business commitment if it is to be treated as the corporate asset that it is. It is important to note that this is no different from anything else in the DW/BI world – information is an important business asset, but if the IT and business groups don’t work together this asset will be wasted.
MDM requires that the data governance processes are part of an enterprise information management initiative to actively update and maintain the data definitions that the business creates. Data governance is an enabling process, but too often falls short because its deliverables are not incorporated into information management.
Find the Problem Areas
You need to determine where inconsistent data creates business risks in the information lifecycle. Although MDM is typically thought of as separate from BI, the reality is that for many years, whether people realized it or not, EDW has served as the default MDM application. With its role of integrating data from many source systems, the EDW serves as the “canary in the coal mine” by being the first place, sometimes only place, where the disparate data is brought together and the inconsistencies become visible. Typically, a particular source system’s reference data is correct in its own silo, but creates inconsistency problems for the enterprise when other data sources’ reference data is commingled with it. Because there is no incentive for a source system to undertake MDM with other source systems if it is performing its business functions with its own reference data, the EDW is forced to take on this responsibility.
Just because the EDW has become the default MDM does not mean that it should remain so. But you can’t fix the problem until you figure out where it is, which is going to be where the business pain is most evident. There are three potential areas to address: operational, analytical, or enterprise (both). You should focus on managing reference data in your operational systems, such as your ERP application, if data synchronization across systems is inhibiting the business from running the business. Many companies spend a lot of time integrating product lists, for example, between various enterprise applications to keep them consistent. This is a flag that you should look at a solution that concentrates on systematically improving application integration of reference data.
If your operational systems are working fine but your business is struggling with inconsistent reference data in BI applications because of conflicting data sources, then you should concentrate your efforts to manage reference data in the EDW. This activity is referred to as conforming dimensions in dimensional modeling terminology.
If your company is having issues in managing reference data in both your operational and analytic systems, then you need a stand-alone MDM application. A word of caution: in this situation, you need to limit your scope if you want to have a fighting chance of success, so start with the area causing the most significant business pain.
Assess a Solution
You’ll need to assess what type of information processing is needed to create consistent reference data. There are two levels of information processing that may be needed to manage master data.
First Level
The first level is the integration processes that conform dimensions and standardize facts when an EDW is being loaded from multiple data sources and the enabling dimensional schema. For these processes you need to:
• Profile each data source
• Define data and business rules with the business
• Create a conformed dimension
• Create a cross-reference that maps the data source to the target conformed dimension
• Develop an integration processes to load the data using the cross-map
In addition, as we discuss in the data modeling section, you’ll implement both slowly changing dimensions and hierarchy management processes to manage the conformed dimensions. This level of processing will likely address most, if not all, of your MDM requirements.
Second Level
The second level of integration processes includes data cleansing and data enrichment processes. These processes demand more extensive tools than just ETL tools that load a DW. If you already have extensive data integration processes and expertise, then you should add data cleansing and data enrichment tools to your environment. The data integration suite you use may have these tools as options to add, which would be the direction you will likely pursue. If, however, you do not have a robust data integration environment, your existing data integration suite does not have these options or your organization’s skills are not extensive in this area, then you are a candidate to purchase and implement a full-fledged MDM application. See Chapter 7 for further discussion.
The second level of processing may be necessary for specific data domains. CDI is by far the most likely data domain that would require integration processing beyond the first level.
Customer data has many characteristics that differ from other reference data:
• First, many key attributes, such as name and address, are textual in nature and may vary between sources. A name could be Richard, Rick, Rich, Dick, or R. An address might be listed as a 12 Main Street, 12 Main St, or 12 Main. Although we can visually identify similar names or addresses, ETL programs and SQL statements do not deal with this ambiguity as well. Also, it is common for these attributes to be filled in by people at different points in times on different input devices, increasing the opportunity for variations. Name and address matching is the process that deals with this problem.
• The second characteristic of customer data is that customers are typically associated with locations such as their home, place of work, or where they purchase a product or service. They may also input incorrect or incomplete data if accuracy is not needed to complete the action for which they are inputting the data. This may result in ambiguity, especially if customers or salespeople input the data.
• The third customer data characteristic is that customers are related to other customers. A business making a transaction may be part of a larger business entity that is not evident by its business name. A person may have a spouse, former spouse, or children that your business would like to know about to determine what to sell to them. This process is called householding, where a family is connected together in customer data even if they do not all have the same last name.
..................Content has been hidden....................
You can't read the all page of ebook, please click here login for view all page.