Chapter 12
Data Integration Processes
Abstract
Data integration activities are the most time- and resource-consuming portion of building an enterprise business intelligence (BI) environment. Using data integration tools, in particular extract, transform, and load (ETL) tools has been the best practice in BI for more than a decade, but manually coded extracts are still the mainstay of the industry. The current generation of tools consists of full-fledged data integration suites that include ETL, real-time integration, message streaming, Web services, complex event processing, and data virtualization functionality. The suites can support data integration processes in traditional batch mode, near real time and in real time if the right connectivity is in place to support it. In addition, many suites offer extensions for data quality, data cleansing, data profiling, and master data management functionality. Data integration services include access and delivery (extract and load), data ingestion, data profiling, data transformation, data quality, process management, operations management, and data transport.
Keywords
Access and delivery services; Data ingestion; Data integration services; Data integration tool; Data profiling; Data quality; Data transformation; Data transport; Extract and load services; Hand coding; Operations management; Process management• Manual coding versus data integration tools
• Data integration services
• Selecting the right tools
• Access and delivery (extract and load)
• Data ingestion
• Data profiling
• Data transformation
• Data quality
• Process management
• Operations management
• Data transport
Introduction: Manual Coding versus Tool-Based Data Integration
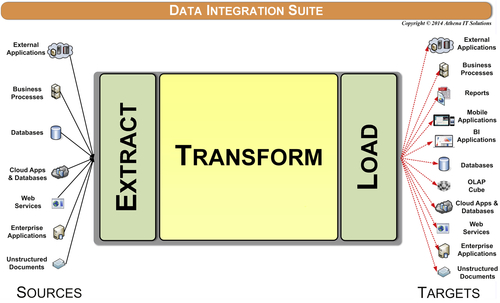
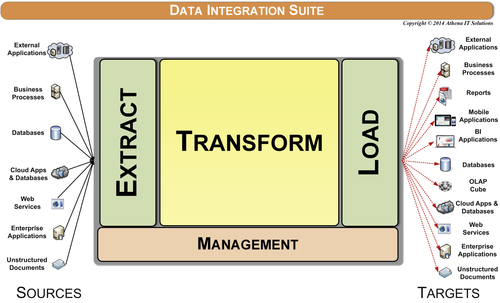
Data integration (DI) activities are the most time- and resource-consuming portion of building an enterprise business intelligence (BI) environment. Industry analysts estimate that upwards of 70% of the time spent on a BI project is devoted to these tasks. Using data integration tools, in particular extract, transform, and load (ETL) tools as depicted in Figure 12.1, has been the best practice in BI for more than a decade, but a dirty secret in the BI world is that manually coded extracts are the mainstay of the industry. Also known as hand-coded extracts, these are prevalent in small- to medium-size businesses (SMB), but even large enterprises that adopted data integration tools as their best practice to load their enterprise data warehouses typically resort to manually coded extracts to feed their BI data stores such as data marts, online analytical processing (OLAP) cubes, reporting databases, and spreadsheets.
How have manually coded extracts become so prevalent? It is not as if there are not enough data integration tools around, including ETL tools. Manually coded extracts are the IT equivalent to business-created data shadow systems we discuss in Chapter 16. Both grow haphazardly and are seldom documented, which practically guarantees that they will become an enterprise nightmare by increasing data silos and costs while adversely affecting the goal of the information five C’s (clean, consistent, conformed, current, and comprehensive).
Why We Hand Code
IT groups provide many reasons for why they manually code instead of using tools, the approach that is considered a best practice. The reasons, however, are usually misconceptions or bad reasons that are used to rationalize their old habits:
Bad reason 1: Tools are too expensive. The top tier tools are indeed expensive. They are out of reach for SMBs and can even be too expensive for large enterprises to expand their use from loading their enterprise data warehouse (EDW) to BI data stores such as data marts and cubes. Even those large corporations that could afford the top-end tools have found that getting the throughput and performance out of these tools has required significant investments beyond software licensing costs. These investments have been in purchasing hardware and memory along with the expertise to tune the servers, storage, networks, and databases. Enterprises often spend hundreds of thousands of dollars on software and infrastructure when using these top-tier tools. Annual maintenance fees and upgrades, beyond labor costs, create a heavy ongoing expense.
It is a misconception to say that all tools are too expensive. It would be true if the top-tiered tools were the only options in the market. However, the reality is that there are many data integration products that can be acquired by more cost-sensitive budgets. These options include a wide range of products: open source software, software bundled (free) with a database or BI tool, cloud-based software with a subscription model rather than an upfront purchase, and other tools that are priced more economically. In addition, as we discussed in Chapter 7, many of the data integration products have shifted from an ETL architecture that often requires dedicated infrastructure to an extract load transform (ELT) architecture that does not. This architectural shift has significantly reduced the infrastructure investments beyond licensing that large enterprises were encountering while loading their EDWs.
Bad reason 2: Expertise is scarce. In large enterprises, the centralized data warehouse team likely has deep data integration tool experience, but their backlog of work means that people creating BI data stores are left on their own. Therefore, they end up hand coding. In SMB firms, the IT staffs are too small to dedicate anyone to data integration, so no one is an expert in what is available; therefore the de facto tool becomes hand coding.
The top-tiered tools require deep expertise primarily due to their complexity, however, the truth is that the other products mentioned above are not that hard to learn. As an aside, many of these tools have online training, tutorials, and samples enabling IT developers to learn them quickly. The skills gap can be easily overcome.
Bad reason 3: You do not know what you do not know. Even when enterprises use data integration tools, they often do not use them well. The biggest reason why people misuse these tools is that they do not have a firm grasp of the concepts of data integration processes and advanced dimensional modeling. Tools are easy; concepts are harder. Anyone can start coding; it is a lot harder to actually architect and design.
So, here is what happens: instead of using data integration best practices, people design the data integration processes the same way they would create a sequential series of SQL scripts to integrate data. In fact, many an ETL process simply executes stored procedures or SQL scripts. Why use the tool at all if you are not going to use its capabilities? When this happens, IT figures it was a waste of time to use the ETL tool to begin with, and the ETL tool investment had no return on investment (ROI). This becomes a self-reinforcing loop, enabling IT to justify (or rationalize) manual coding.
Bad reason 4: Data never sleeps. Regardless of the state of data integration expertise and investment at an enterprise, business people still have to run and manage the business. This requires data. If the data has not been integrated for them, they will figure out some other way to get it—even if it means cutting and pasting data from spreadsheet queries or getting IT to “crank out” SQL scripts. This is why data shadow systems or spreadmarts are started and then become so prevalent. Moreover, if an IT person needs to get data and they do not have experience with data integration tools, then the go-to solution is hand coding.
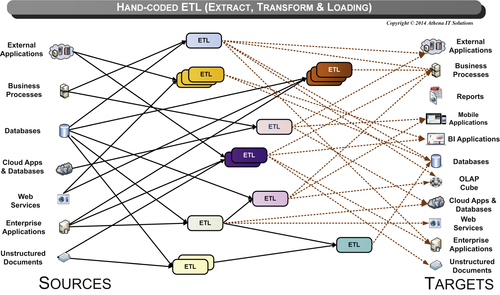
Bad reason 5: Not seeing the forest for the trees. IT has generally treated data integration projects tactically, thereby failing to recognize the need for and benefits of common and reusable data integration processes. They hand code each project just enough to move the data from source to target, but do not take the time or have the ability to get beyond the bare essentials. This creates overlapping and redundant efforts as depicted in Figure 12.2, which leads to data silos, overly expensive projects, and a diminished ability to respond to business needs.
Bad reason 6: Limiting data integration to batch-driven ETL. IT has too narrowly viewed data integration as simply ETL. Building a data warehouse using batch-driven ETL has defined, from an IT perspective, what data integration can do, but many data integration vendors support real-time updates using such techniques as messaging and enterprise information integration (EII) and through services via service oriented architecture (SOA). With the limited viewpoint that data integration is only ETL, many integration projects were done by hand coding or by introducing narrowly focused tools rather than a full-faceted data integration tool. This has driven up the cost of integration, strained resources, and created yet more data silos.
Bad reason 7: Coding is easier than thinking. There is an inherit bias for the IT staff to generate SQL code. They know it (just like the business person knows spreadsheets), they can crank something out quickly, and it does not cost anything extra. The typical scenario is that the IT person creates a SQL script or a stored procedure to pull data from one source and things are fine. But then several hundred SQL scripts or stored procedures later, the hodgepodge and undocumented accumulation of pseudo ETL processes becomes the recurring method to load the data warehouse or BI data stores. Each change to that set of code takes longer and longer. It consumes more and more resource time just to maintain it. When new data needs to be integrated, another IT person starts the next hodgepodge of undocumented code with yet another simple SQL script.
Why We Use Tools
Historically, for all the reasons mentioned above, hand coding extracts has become the de facto method to develop data integration processes for most projects. This has been a tale of the rich versus the rest. Large corporations with significant budgetary and resource means have adopted tool-based development as a best practice, while everyone else, including other projects in the same companies, have opted for hand coding.
The benefits of tool-based development versus hand coding include:
• Reusable dimensional processes. Data integration tools offer many prebuilt functions or transformations used in data integration processes. These functions and transformations are based on best practices, such as slowly changing dimensions and hierarchy management that are used repeatedly in data warehousing, business intelligence, and data migration applications. Not only does hand coding require these to be built from scratch (delaying the project and potentially introducing errors) but the hand coders may not even be aware of the best practices for those functions.
• Robust data quality processes. Many data integration tools have data cleansing, data conforming, and data standardization processes that are critical to data quality but are often too complex to be implemented using hand-coded SQL.
• Workflow, error handling, and restart/recovery functionality. These tools manage operational processing, enabling not only recovery and status notifications but also the ability to analyze performance to identify bottlenecks and interactions with other applications. With hand coding, all this has to be coded in addition to the basic data integration processing, incurring a heavy cost in time and resources. More often than not there is no time to hand code this functionality.
• Impact analysis and where-used (lineage) functionality. This enables change management, improves productivity, and reduces error surprises. With hand-coded applications, it is often a guessing game as developers have to search through pages of code and hope that they are even accessing all the code that is being used.
• Self-documentation of processes and entire workflow. The documentation (if it is even created) associated with hand coding is generally incomplete and out of date. Documentation provides auditing and fosters understanding of the data both for the business person and the IT developer.
• Enables data governance. Data integration tools that provide repositories and semantic dictionaries enable the reuse and easy maintenance of business and technical definitions, often referred to as metadata. Although this functionality may be “hidden under the covers,” it provides the significant benefit of helping each subsequent data integration project leverage existing work, thus speeding up development time (time to market) and reducing business errors.
• Productivity gains. With all the functionality already prebuilt in data integration tools, why would an IT organization, even if it had the time and money, reinvent it? Not only does IT become more productive because the functionality is already built in, but because the tool follows industry best practices, the IT group can avoid the costly errors that would happen without that knowledge.
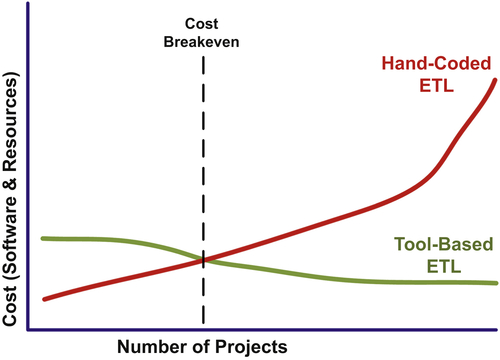
Although an enterprise’s initial data integration projects will not necessarily be faster with a tool-based approach, the deliverables will be more robust and sustainable, enabling a BI environment to provide the information five C’s. As depicted in Figure 12.3, the costs per project decline and the long-term total cost of ownership (TCO) is significantly superior for a tool-based versus a hand-coded data integration approach.
The fact that projects with sufficient resources, i.e., budget and skills, almost always use data integration tools indicates their usefulness. The good news for everyone who has felt they could only afford a hand-coded solution is that there are data integration products whose cost and skill requirements will easily be justified in terms of business and IT gains.
Selecting a Tool
IT groups create their short list of data integration vendors based on either the current market leaders or on industry analyst groups’ top-ranked vendors. But no short list comes into play with hand coding, which is the predominant method used for data integration. It appears that there is a major disconnect between the current short-listed vendors and the needs of many enterprises.
The criteria to use when selecting a data integration tool include:
• Best fit
• Supports programs not just projects
• Data governance
• Scalable, expandable, and pervasive
• Role-based development
• Cost and resource effective
• Business ROI
Best Fit
If we used the same logic in selecting and purchasing a calculator as IT groups do for ETL tools, then all of us would walk out of the office supplies store with a scientific, graphing calculator. Why? Because those calculators have the most features and therefore are the “best.” But most of us would not know how to use the bulk of its functionality; we should not be forced to buy something we will not use. Almost all of us purchase a simple calculator that can do the basic calculations for balancing our checkbook or calculating taxes and tips. We buy the best fit for us, not what is the “best,” i.e., most feature-laden, calculator.
The “best” ETL products are great, but they are generally expensive, complex, and require a greater investment (time, money, and skills) than other products, which also may do everything you want but at a potentially significantly lower TCO.
When an enterprise selects a data integration tool, it has to determine what it needs, how much it is willing to spend, and what skills it has to implement the software. Getting a product that is too complex for your staff or the tasks that need to be done means the product will likely sit around unused (shelfware). Match your integration needs, skills, and budget to the tool, not the other way around.
The term “good enough” is often used in product selection, but that sounds too critical of the products and gives the impression that you are settling for something less just because of price. There is a wide variety of data integration tools that can handle most, if not all, the data integration requirements for enterprises of all sizes and across industries. It is fine if your enterprise needs the top tier (and most expensive product) for its workloads, or if it simply wants and can afford the luxury brand. The rest of us, however, can likely get it done with less. Also, keep in mind that many of the rest of us should really be comparing hand coding with the affordable tools, because that would be what we use, not the top-tier tools.
A good test of the best fit is to run a proof of concept or prototype with your selected data integration tool using your own data. That gets you familiar with both the tool’s capabilities and the skills you will need to use it.
Supports a Data Integration Program, Not Just Tactical Projects
A data integration tool that supports multiple projects and developers spread out over a data integration program delivers significant business and IT benefits. This capability facilitates the reuse of data definitions and transformations amongst projects and collaboration between developers.
From a business perspective, this also improves data consistency and reduces the likelihood of creating data silos. From an IT perspective, reuse and collaboration boosts productivity and makes it easier to bring additional people onto each project because knowledge is not locked into a programmer’s “proprietary” custom code.
Data integration tools foster sustainable software development and maintenance practices such as source control, revision management, and functional sharing. With the importance of data and its integration to an enterprise, it is often too risky to rely on manually creating, documenting, and managing custom code, not to mention that it is more costly, time consuming and error prone.
Supports Data Governance
As discussed in Chapter 17, a successful data governance program obtains business ownership of the data definitions and transformations, which is vital to implementing consistent information throughout an enterprise. It is important to have a data integration tool that can then support those definitions and transformations so that the processes do not just become a paper exercise that is not implemented in the integration processes. Role-based support of various data governance activities improves responsiveness to business needs and the demands placed on changes in the business. In addition, data lineage, input analysis, auditing, and metadata management support aids data governance.
Scalable, Expandable, and Pervasive
Enterprises, from Fortune 1000 to SMBs, typically need to integrate many varied data sources. These sources are spread across many platforms, stored in structured and semistructured data types, have different update cycles, are interconnected and codependent, and need batch or real-time processing. In short, most enterprise data integration needs are diversified and challenging. The data integration tool you select must be able to handle this diversity.
In addition to supporting varied data sources, it is highly desirable for a data integration tool to be able to optimize data processing, particularly with parallel capabilities. This functionality leverages whatever size infrastructure footprint is used for data integration by maximizing data throughput. This optimization saves money by reducing the infrastructure investments that would otherwise be required and helps those committed to green computing (with a reduced environmental impact). In addition, optimization results in shorter integration processing, always a plus in today’s business climate.
Historically, integration efforts have been siloed across an enterprise because of the varied requirements discussed above. Because ETL products often supported only batch-driven processes primarily accessing relational databases and flat files, their focus was generally data warehousing and business intelligence. With these diverse integration needs, select a data integration product that goes beyond data warehouse (DW) or BI and that enables data migration, data synchronization, SOA, data quality, enterprise data access, complex data exchange and master data management (MDM). An enterprise’s initial integration efforts may be focused on DW and BI, but many of these other areas will arise in the future, and it will be desirable to simply expand your data integration platform rather than building a whole new, and likely overlapping, integration platform.
To make sure your data integration tool is widely used in the enterprise, be sure to choose one that supports diverse sources, data processing models, and applications.
Cost and Resource Effective
Data integration tool-based development has historically been viewed as too expensive and hard to learn, as well as taking too much time on each project to develop the integration processes. The market “leaders” started as batch-only tools for DW development. Expanding this functionality required incorporating software from acquisitions or altering existing architectures with the new functionality while trying not to disrupt current customer implementations. As a result, customers deployed these complex products for uses that did not require complexity. And, they were still paying mainframe-level prices—a big blow to their ROI.
The good news is that times have changed. Newer data integration tools have been architected from the ground up to support a diversity of data source and integration styles. This means that a development team should be more productive sooner and be able to reuse these tools in various situations.
In addition, newer pricing models bring these tools within most enterprises’ reach. In many cases, more expensive products are not necessarily the best choice for an enterprise. Many enterprises in the past have “blown their budget” on the ETL tool and then had no budget to finish the project. Make sure that the product you select is affordable and provides the functionality needed by your enterprise.
Business ROI
No matter how successful your integration efforts appear, it is important to determine the business ROI that your data integration efforts have achieved. The business benefits will be both quantitative and qualitative.
Qualitative benefits abound from data integration projects. Being able to access clean, consistent, conformed, current, and comprehensive information reduces guesswork, enables better analysis, and improves decision making. Business productivity improves by shifting employees’ time from gathering data to analyzing and acting on that data. IT productivity gains by placing the right tools to create the integration processes. It also helps the business meet various government and industry regulations. All are enabled by an enterprise’s data integration program.
Sometimes it is more difficult for the business to quantify business benefits. The business benefits of data integration enable improved decision making, leading to increased sales, improved customer service, increased profitability, or reduced costs—but there are other processes involved. Data may be the key ingredient to performance management systems, but there have to be business processes in place to leverage that knowledge that, in turn, produced the business benefit. The trick is to not claim that data integration alone created this business benefit, but that the data-enabled solution did. With this mind-set, one should be able to quantify the benefits from the various data-enabled solutions deployed in the enterprise.
Two Tools May Be Better Than One
If your enterprise is already using a data integration tool exclusively to load the EDW while other projects load data marts and OLAP cubes with hand-coded extracts, then you should validate the reasons why it is being used in this manner. There are two scenarios for this situation.
In the first scenario, the enterprise has simply not adopted the tool-based approach for all data integration projects. This is typical when data integration projects are treated tactically and not viewed within an enterprise-wide perspective. The best practice is to initiate a data integration program, train data integration resources in concepts and tools, and declare the tool-based approach as the de facto standard.
In the second scenario, which is very common for large enterprises that were early adopters, the IT group is using a top-tier ETL tool to load the EDW, but has encountered resource constraints—skills, budget, infrastructure, and licensing—beyond that use. Assuming that the existing data integration tool is successfully loading the EDW, then the question is: Will the enterprise make the investment to eliminate hand-coded extract projects? Although there is a bias for an enterprise to select one tool to do a particular task, the reality with data integration is that it is viable to use two data integration tools in an enterprise:
• The first data integration tool would be the top-tiered tool to load the EDW because its capabilities are needed, but it has significant investments to enable those capabilities.
• The second tool would be used to load data marts and OLAP cubes because the tool used to load the EDW is too expensive to use for data marts and cubes. The objection by the IT staff in this scenario is always that the second tool is not as powerful as their top-tiered tool, and they always declare one tool as a standard. However, the reality is that they have already declared hand coding extracts to be the second standard. So the second tool should be compared to hand coding extracts rather than the top-tiered tool, since it is not being used for these projects.
Although a single standard tool is theoretically the best course, if an enterprise has declared two standards—top-tiered tool and hand coding—then two data integration tools are better than one. The second may not be a standalone tool, but may be embedded in a BI tool or part of a tool that builds a complete BI application including data marts.
Data Integration Services
In order to support the explosion of data and the increasing demands of business intelligence, data integration tools have become more complex and sophisticated. The first generation of ETL tools, as depicted in Figure 12.1, were simple code generators that were expensive and had limited functionality. Many companies that evaluated them found it more effective to develop their own custom integration code.
The second-generation ETL products, as depicted in Figure 12.4, offered more functionality, particularly in managing operational processes and software development. These tools, however, were still primarily batch oriented, required extensive skills to use, and needed an additional infrastructure investment to perform well. Based on those two sets of tools, many people in IT were left with the feeling that ETL software was not worth the effort to learn and would not be able to meet their performance needs.
Manually coding may be the best choice for data exploration and prototyping, but when the DI is a recurring process it should be shifted to an automated DI tool.
The current generation of tools consists of full-fledged data integration suites that include ETL, real-time integration, message streaming, Web services, complex event processing, and data virtualization functionality. The suites can support data integration processes in traditional batch mode, near real time and in real time if the right connectivity is in place to support it. In addition, many suites offer extensions for data quality, data cleansing, data profiling, and MDM functionality.
Data integration suites can access and deliver a wide variety of data spanning structured, semistructured, and unstructured formats. Data exchanges can occur with databases, files, processes, business applications, or analytics tools.
In addition, the plethora of services provided by these data integration suites are built based on the best practices that we have discussed in data architecture, data modeling, and data integration. These best practice services help deliver the information five C’s, provide a robust development and production platform, improve enterprise productivity, and increase BI ROI.
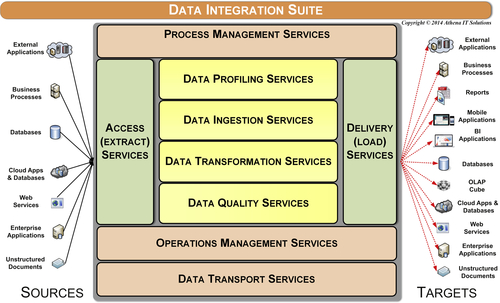
The data integration categories of services as depicted in Figure 12.5 are:
• Access (extract)
• Delivery (load)
• Data profiling
• Data ingestion
• Data transformation
• Data quality
• Process management
• Operations management
• Data transport
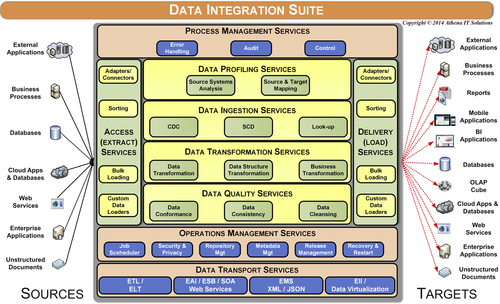
Figure 12.6 depicts a more detailed list of services provided in each data integration category.
Access (Extract) and Delivery (Load) Services
The purpose of access services is to gather data from one or more sources so that it can then be consumed by other data integration services with the delivery services and then loading that data to its targets. Although much attention is paid to gathering data from systems of record (SOR), access and delivery services are used with all the data stores in an enterprise’s data architecture such as staging, data warehouse, data marts, and cubes.
Although access and delivery services are pictured as separate bookends to the other data integration processes, they fundamentally use a common set of functions that read and write data throughout the data integration workflow. The common functions include:
• Adopters and connectors
• Sorting utilities
• Bulk import and export loading
• Custom data loaders
Adopters and Connectors
There are adopters and connectors available to read and write to a variety of structured, semistructured, and unstructured data sources. Open database connectivity (ODBC) and Java database connectivity (JDBC) are heavily used with relational databases and other structured sources. There are also application programming interfaces (APIs) to flat files, XML, business applications, OLAP cubes, HL7, statistical databases, Big Data databases, representational state transfer (REST), enterprise service bus (ESB), cloud applications, and many other sources. The list of APIs continually expands as new data sources emerge and the demand to access those rises. Most data integration suites also allow custom web or data services to be created to access and deliver to data sources that have not been prebuilt in their product.
Sorting and Bulk Loading Utilities
Sorting and bulk loading utilities are most common in either the beginning or the end of the data integration workflow. They are primarily used for sources with large data volumes that are processed in a batch-oriented manner where these utilities will improve performance.
Custom Data Loaders
There are instances when data sources require custom data loaders rather than callable APIs or data services that can be invoked by the data integration suite. There are two common scenarios where these custom data loaders are used:
• Proprietary data structures that require specialized schema design loading such as OLAP cubes.
• Business applications that do not provide APIs for accessing or loading.
Data Ingestion Services
After access services gather data, data ingestion services update the targets with the latest data based on business rules for tracking data as it is created and modified. The processes involved are change data capture (CDC), slowly changing dimensions (SCD), and reference lookups.
Change Data Capture
The CDC process needs to determine what data to access from data sources and updates its targets while typically retaining historical values. Unless all the data from the data sources is gathered and then indiscriminately loaded into the targets, for example, the targets are truncated to avoid duplicates and then all data is inserted, then CDC needs to:
• Gather the data that has been changed—inserted, modified, or deleted—in the data sources since the last time CDC process has been run.
• Insert, modify, or delete data in the targets based on what data was gathered from the sources and what data exists in the targets.
Sometimes the CDC process of gathering data from the data sources cannot be precise enough to discern only the records that have been changed since it was last executed. In these cases, the approach is to overcompensate by making sure that you will get all the records that were changed—even if it means bringing some records that were not changed. This approach necessitates that the CDC processes that determine what needs to be updated and the target systems have to be able to differentiate which worker records were changed since the last CDC.
The CDC techniques used to determine what data has changed in the source systems from the last CDC execution are:
• Audit columns
• Timed extracts
• Row difference comparisons
• Log or message queue scanners
• Event triggers
The CDC techniques employ push, pull, or a combination of both of these operations. Key criteria used in determining push versus pull are the impact on the source systems in terms of performance and the enterprise rules regarding source system access, which may override performance considerations.
A CDC approach employing push operations is common when the data source is a transactional system with high performance demands, or when it is a system that does not allow external applications, i.e., the data integration suite, to directly access it. In these cases, the BI system’s data integration suite would not be involved in performing the initial gathering of data from the data source. Under these conditions, the source system may use its own CDC capabilities with one of the techniques described above, or custom coding will be needed. It is very common for source systems applications staff to write the custom code that will create a flat extract that will be pushed to the BI systems staging area, which then triggers its data integration suite to initiate its own CDC processing using a staging area as its data source.
Audit Columns
This technique uses audit columns, which record the date and time that a record was inserted or modified. The most effective schema is to have two date columns in both the source table and associated target table as depicted in Figure 12.7.
The CDC logic for the technique using Figure 12.7 is:
1. Get the maximum value of both the TGT_Create_DateTime and TGT_Modified_DateTime columns.
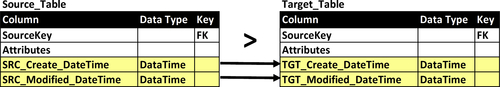
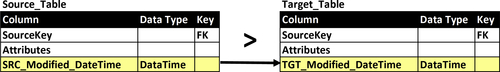
3. Select all rows that have a SRC_Modified_DateTime greater than (>) TGT_Modified_DateTime but less than (<) TGT_Create_DateTime. The reason for the exclusion of rows less than the maximum target create date is that they were included in step 2.
4. Insert new rows from step 2 or modify existing rows from step 3 in the target based on the SCD logic (below) that is being used for that specific table.
The CDC logic for the technique using Figure 12.8 is:
1. Get the maximum value of the TGT_Modified_DateTime column.
2. Select all rows that have a SRC_Modified_DateTime greater than (>) TGT_Modified_DateTime.
3. Determine which of the rows from step 2 need to be inserted and which require existing rows to be modified.
4. Based on the determination in step 3, insert new rows or modify existing rows in the target based on the SCD logic (below) that is being used for that specific table.
Timed Extracts
This CDC approach involves:
1. Selecting all the data that was created or modified in the source during a preset interval of time such as a day. The most common time interval is to load all of yesterday’s created or modified rows.
2. Determine which of the rows from step 2 need to be inserted and which require existing rows to be modified.
3. Based on the determination in step 3, insert new rows or modify existing rows in the target based on the SCD logic (below) that is being used for that specific table.
This was a very common technique in the early days of data warehousing and continues to be an approached favored by IT people who are new to BI.
Although at first blush this would seem to be a very straightforward approach to CDC, there are risks associated with this technique. The most significant risk is duplicate processing if there are any failures and restarts that occur during CDC processing. There is also the risk that if a specific time interval is skipped due to an operational problem, it (the time interval) may never be processed. As the data volumes involved in CDC processing and the time to complete overall ETL loads increase, this method becomes less reliable.
Because of these potential risks and reliability issues, this CDC technique is generally discouraged.
Database Log or Message Queue Scanners
This CDC technique takes a snapshot at a predefined point in time of either the data source’s database log or message queue, searches that snapshot for any transactions that indicate changes in data, and then updates the targets reflecting these changes.
The advantages with using this technique are that it:
• Creates minimal impact on the data source’s database or message queue
• Eliminates the need to change the data source’s schema to flag changes in data.
There are, however, several significant challenges to using this technique:
• There are no standards related to the structure or process flow, so every database or message queue will require a different CDC application.
• Most database management systems and message queues do not document the internal format of the logs or queues. This will require the purchase of a separate CDC product that handles the specific databases or message queues that need to be accessed.
• Often the level of detail needed and the database log or message queue to support CDC decreases the performance of the underlying application and increases the size of the log, significantly degrading performance.
• A common occurrence when the logs or queues become too big is for the database administrators (DBAs) to truncate them, which then eliminates the ability to perform CDC.
Because of its challenges, this CDC technique is typically used when it is the only method able to capture data changes.
Table or Event Triggers
This CDC technique uses triggers that are either set up in the database or coded in the data source’s application to record all changes in the data source by writing them out to a separate table or file to be used as a CDC queue to update the targets when requested. It’s best to avoid this technique because it adversely impacts the source systems performance by requiring multiple writes to a database every time a row is inserted or modified.
Row Difference Comparisons
With this CDC technique, a full snapshot of the data sources is taken every time the CDC process is run. The current snapshot is compared to the previous snapshot to determine all the changes that occurred in the data source since the last CDC run. The full comparison of the differences between the two snapshots on a row-by-row basis produces a thorough and accurate accounting for all changes including inserts, modifications, and deletions. The snapshots of the data sources can be stored as separate tables or files in the BI environment’s staging area.
While this is the most reliable of all CDC techniques, it is typically avoided whenever the number of data sources and data volumes is high because:
• Row-by-row comparisons across tables is very time consuming
• Demand for storage significantly increases because you need three copies of the data sources that are being used in this technique: the original data, previous snapshot, and current snapshot.
Slowly Changing Dimensions
The CDC service determines what source data has been changed—inserted or modified—while the SCD service updates the target data based on the rules specified in the SCD type that has been selected for a particular target. The best practice is to use the database to generate surrogate keys when possible, otherwise this service is responsible for generating surrogate keys. Some data integration suites have prebuilt functions that can be used to generate the surrogate keys, but when not available the process needs to be created and embedded in this service.
This service is applied to both fact and dimension tables even though its name would imply otherwise. The description of these rules and supporting schema was discussed in Chapter 10. For transactional and snapshot fact tables, rows are always inserted and never updated so that SCD type 0 applies. The SCD type needs to be selected for accumulating snapshot fact tables and all dimensions, as there are no default types. See Table 12.1.
Table 12.1
List of Slowly Changing Dimension (SCD) Types
| SCD Type | Description |
| 0 | Keep original |
| 1 | Overwrite existing data (row) with new data |
| 2 | Create a new row for new values |
| 3 | Track changes using separate columns but overwrite rest |
| 4 | Add minidimension |
| 5 | Combine types 4 and 1 |
| 6 | Combine types 1, 2, and 3 (= 6) |
| 7 | Use both types 1 and 2 |
Reference Lookups
The data ingestion service supports reference lookups throughout the data integration workflow. These lookups are used for such tasks as:
• Data validation
• Cross-reference mapping and substitution
• Adding the foreign keys to fact tables that link back to dimension tables’ surrogate keys
• Adding the date dimension’s surrogate key to a fact table for every occurrence of a date that will be queried in the BI environment
The reference lookup service may be needed by many tables and repeatedly performed for each row processed in the table. There are several best practices to improve lookup performance. First, when querying the lookup table, only select the columns used to match the rows, and then substitute the replacement values on the target table. Second, many data integration suites allow lookup tables to either be cached to local files or to be stored in memory rather than repeatedly querying the source system. Using either a file or memory cache will significantly improve data integration processing.
Data Profiling Services
Data profiling, often called source system analysis, is a process of examining the structure and content of data sources. This can be a very time-consuming task based on the variety and complexity of the source systems, but the resource commitment to perform it is typically underestimated because people assume that they know the state of the data in the source systems. After all, enterprises have applications that run their business on a daily basis and may have been successfully operating for years, so the assumption is that these applications and the data inside them are well understood and documented.
But this is when the data monster rears its head in BI projects. After all the data has been loaded and the BI applications are in operation, business people start seeing “funny” data values. Their business analysis is then inaccurate, or they cannot complete it. This immediately results in a fire drill to find the data problem and get around it, but then other anomalies appear. Next, the business people feel there is a severe data quality problem and the BI application stops being used. What happened?
Many BI projects fail simply because the project team was surprised by the data—specifically, they were surprised by data anomalies lurking in the source systems. Sometimes the problems can be blamed on data quality, but often there is no problem with the correctness of data. Rather, the problems lie with the data’s completeness or the way specific fields are being used. A field might be used for multiple purposes depending on the business process or division that updated it, but those multiple uses are not documented, so it ends up looking wrong.
Why do teams get caught off guard? You would think that if the project managers did source systems analysis, you would not have any surprises. To understand how this happens, let us look at the usual approach a manager takes. The team gathers the business requirements, determines the data needed to fulfill those requirements, and determines the SOR needed to source the data. After that, the team assesses the SOR by obtaining field layouts, talking to the IT staff supporting the SOR, and finally writing queries to fetch information about the SOR contents. The next step is to write the ETL code, test it, and finally start loading the data warehouse. So far, so good. The data starts getting loaded and the BI portion of the project—reports, cubes, dashboards, etc.—gets built. Then, when the business people use the BI environment, the numbers do not seem to match what they are reporting on and some “funny” results appear.
The problem is not that source system analysis was not undertaken. The problem is that it was neither comprehensive nor complete. Examining the source systems for data anomalies is a process that most of us do not have much experience with. Also, most of us are not allowed enough time in the project to build all the SQL scripts needed to examine the data thoroughly and systematically.
Data profiling is the answer to this problem. To profile data effectively, you have to understand the source system data—how it is defined, its condition, and how it is stored and formatted. When all the source systems were back-office, custom, legacy systems, this was a huge task requiring a lot of people and time. Widespread enterprise resource planning (ERP) system deployments replaced many of the customized legacy systems, resulting in a better understanding of data sources. With ERP implementations, you either have documented data or implementation resources people who are familiar with the data. However, what if your company lacks knowledge or documentation of your source systems? That is when you need data profiling software so you can examine and document data sources, rather than use a people-intensive investigation of these sources.
Data profiling tools automate a methodology and set of algorithms that examine your source systems. These tools generate many more data queries than your staff could perform to examine data values, data ranges, frequency distribution, broken relationships, and many other characteristics that are indicative of potential data anomalies. These tools encode the experience that your staff probably lacks when it comes to deeply examining data for problems. These tools assist your staff in truly understanding not just the definitions of what the data is supposed to represent, but more importantly, the real content of that data.
Data profiling should be established as a best practice for every data warehouse, BI, and data migration project. Data profiling is essential to establishing a data quality process. In addition to performing data profiling during your project, it should be an ongoing activity to ensure that you maintain data quality levels.
Early detection is best, and the further in the process you are, the more expensive the errors are to correct. Certainly, too many BI and DW projects have missed their deadlines or budget because of data quality surprises late in the project. Data profiling activities benefit these projects by improving project planning and its financial performance. It should be a requirement early in the project, just as systems testing and user acceptance testing occur toward the project’s completion.
Source Systems Analysis
The use of data profiling tools to automate the source systems analysis process should be a fundamental requirement within data integration services. These tools enable the BI team to comprehensively examine the structure and content of the source systems to validate business requirements, quantify the state of data quality, and assist in the design of the data integration workflow.
Data profiling services, as depicted in Figure 12.9, perform the following functions:
• Accessing source system
• Structure and content analysis
• Recording results in a profiling repository
• Providing data profiling reporting
The structure and content analysis of source systems involves:
• Table analysis
• Column analysis
• Relationship analysis
• Primary key analysis
• Cross-table analysis
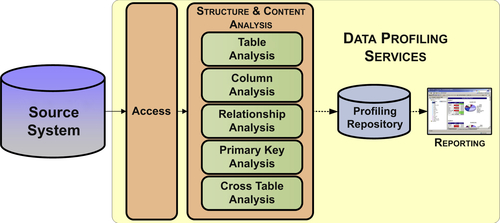
Table Analysis
This process examines data selected from the data values for all columns of a table in order to compute the functional dependencies for the table. Table analysis finds associations between different columns in the same table.
When reviewing all function dependencies, you decide whether or not to exclude a functional dependency from further analysis. Proper inclusion of functional dependencies is important because it supports the later identification of primary keys, relationships, and normalization of a table.
Column Analysis
This process examines all values for the same column to infer the column’s definition and other properties such as domain values, statistical measures, minimum/maximum values, etc. During column analysis, each available column of each table of source data is individually examined in depth. Many properties of the data are observed and recorded; some examples are:
• Minimum, maximum, and average length
• Precision and scale for numeric values
• Basic data types encountered, including different date/time formats
• Minimum, maximum, and average numeric values
• Count of empty values, null values, and non-null/empty values
• Count of distinct values or cardinality
Additionally, column analysis makes certain inferences about the column’s data such as:
• Data type, precision, and scale
• Whether or not nulls are permitted
• Whether or not the column contains a constant value
• Whether or not the column values are unique
Primary Key Analysis
Primary key analysis is the process of identifying all candidate keys for one or more tables. The goal is to detect a column, or set of columns, that might be best suited as the primary key for each table. This analysis step must be completed before subsequent steps, such as cross-table analysis, can be performed.
Normally, primary key analysis uses results from table analysis. Table analysis identifies the dependencies among the columns of a table and proposes candidate keys. Subsequently, one candidate key must be confirmed by the user as the primary key. As you would then expect, a primary key determines all the values for the rest of the columns in the table.
Cross-Table Analysis
This process compares all columns in each selected table against all columns in the other selected tables. The goal is to detect columns that share a common domain. If a pair of columns is found to share a common domain, then this might indicate the existence of a foreign key relationship between the two tables, or simply redundant data. These possibilities are examined during the subsequent relationship analysis step.
Relationship Analysis
This is the process of identifying relationships between tables. This process uses information gleaned during execution and review of primary key analysis and cross-table analysis. Primary key analysis produces the primary key for each table, and cross-table analysis identifies columns in different tables that share common domains. The existence of a common domain may be indicative of a relationship between two tables, since columns in two tables that are related will often share a common domain.
Source-to-Target Mapping
During the design, development, and testing of data integration applications, the source-to-target mapping service enables the developer to see the structural content of the sources and targets. In addition, sampling of data and row counts are available to aid in design.
Data Transformation Services
As depicted in Figure 12.10, the data integration processes access and deliver data with various data stores and their schemas such as staging, DW, and data marts. The data transformation services build and populate the schema—tables, columns, and relationships—of each of these data stores.
The key data transformation services are:
• Data conversion
• Business transformation—rules and metrics
• Data structure transformation
Data Conversion Services
Data conversions are typically straightforward and can be implemented either as an ETL transform or within its source-to-target mapping application. Most of the data conversions are performed as data is gathered from source systems and loaded into a DW. The following are examples of when data conversions are needed:
• Source system data types are incompatible with the target database.
• Multiple data sources with different data types may be populating a particular column.
• A data source column may contain multiple codes combined into an “intelligent” key and needs to be broken into its separate components.
• BI environment has adopted column standards in regard to data types that must be followed.
Business Transformation Services
Business transformations involve applying business rules, algorithms, and filters to create business measures, metrics, and key performance indicators (KPIs) for use in specific business processes and business groups. DW fact tables contain measures such as sales quantity and revenue, but these measures are typically business neutral. Business transformations, on the other hand, may only apply to corporate finance or the supply chain management, for example.
The best practice is to perform the business transformations applicable to a business process or group within the data marts or OLAP cubes that the business people use. Keeping these business transforms out of the DW allows it to keep its focus as the general purpose enterprise data hub that can be used by all groups (or at least as feeds into their business-specific data marts). We have seen too many DWs labeled as the finance or sales DW because those groups’ business transformations were created there and all the other enterprise groups felt that the DW did not apply to them. Another practical aspect of implementing the business transformation in business-specific data marts is that it means only the business people who use that transformation need to define it. Otherwise, each business transform needs to be reviewed and approved by groups with no interest in or contrary views of that transformation.
Data Structure Transformation Services
The data structure transformation services build and populate the physical schema for each of the data stores used in the data integration workflow. Each data store has an overall (or master) data structure service that manages its loading with the following pair of data structure services that orchestrate them:
• EDW integration schema services—this service populates the staging (if applicable) and EDW integration schema data stores.
• EDW BI schema services—this service populates the EDW BI schema data store and any applicable data marts or OLAP cubes.
Each of the overall data structure services builds and loads the individual fact, dimension, and other tables in each schema. Each of these tables is processed by subservices that are designed specifically for the type of table.
The subservices can be categories within table types and are processed in this order:
1. Dimension table subservice
2. Fact table subservice
3. Aggregation subservice
The workflow order is based on the dependencies of each subsystem. Aggregates, for example, cannot be built unless the underlying fact tables that they summarize exist. Likewise, fact tables cannot get assigned the foreign keys to dimension tables until they are built. In addition to the dimensional model structural dependencies, each table will have to depend on the data in source systems or other tables in the BI schema. It is critical to have the dependencies mapped out to ensure the proper construction and population of the BI environment.
Dimension Table Subservice
This subservice populates dimension tables. As depicted in Figure 12.11 the dimension table subservice gathers one or more source tables from the source schema, structures the attributes based on the target dimension table type, and, if applicable, will also populate any required subdimension tables such as minidimension or bridge table. The order in which the tables are populated is: subdimension, dimension, and bridge.
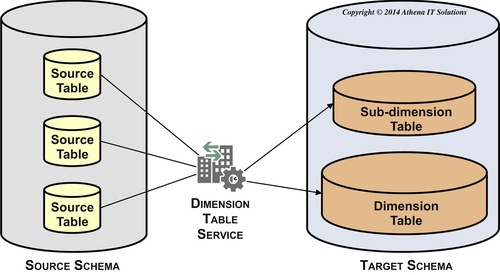
This subservice populates all dimensional table types and their building blocks, including:
• Flattened dimension
• Snowflake dimension
• Miniprofile dimension
• Hierarchy manager
• Bridge table
• Date dimension
• Time dimension
• Junk dimension
• Dimensional role manager
Fact Table Subservice
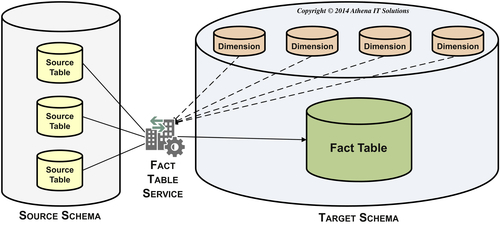
This subservice populates fact tables after all the dimension tables it is dependent upon are populated. As depicted in Figure 12.12, the fact table subservice gathers one or more tables from the source, assembles them into the fact table structure, performs lookups to input foreign keys to the dimension tables it references, and then populates the fact table.
This subservice populates all fact table types and their building blocks, including:
• Transaction facts
• Periodic snapshot facts
• Accumulating snapshot facts
Aggregation Subservice
This subservice populates the following aggregation-related tables:
• Shrunken dimension table
• Aggregation (fact) table
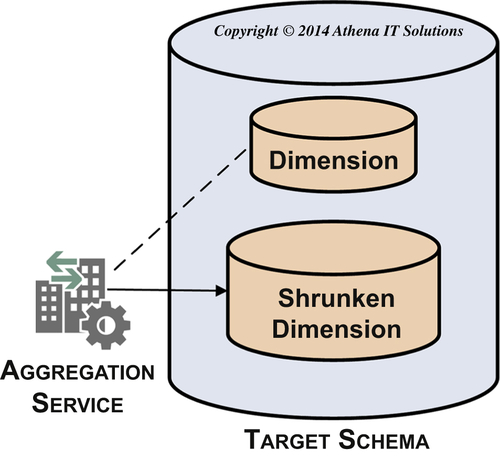
As depicted in Figure 12.13, you create shrunken dimension tables from a dimension table that has more detailed grain. Examples are monthly and quarterly shrunken dimension tables created from a date dimension table.
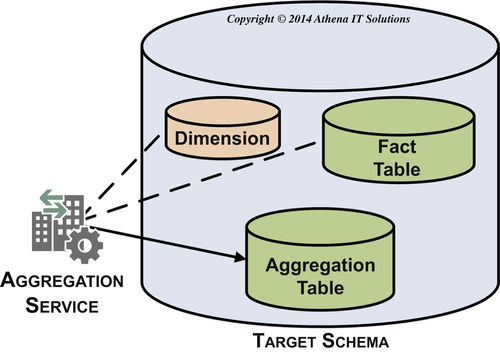
As depicted in Figure 12.14, you create aggregation fact tables by aggregating metrics from a fact table, which you do by referencing a dimension table to determine the level in the hierarchy to which you need to summarize. You may use a shrunken dimension table, if it is available, as the reference rather than the more detailed dimension table. An example is summarizing monthly sales or expenses. There are some BI tools or OLAP cubes that create their own aggregations on the fly and do not require aggregate fact tables to be prebuilt.
Data Quality Services
There is no shortage of misconceptions when it comes to data quality. Once you understand what they are and how to recognize them, you can move on to building your data quality service and then putting it in action.
Misconceptions about Data Quality
There are several misconceptions people have concerning data quality that thwart efforts to establish the information five C’s in an enterprise BI environment:
• The DW has a data quality problem
• Data quality is the result of errors in data entry or data acquisition
• The data quality in our source systems is excellent.
• The DW is a read-only operation and never alters data
• Data cleansing tools will fix data quality problems
The DW Has a Data Quality Problem
If data warehouses could talk, they might say, “Don’t shoot me, I am just the messenger!”
When business people encounter data quality issues using BI applications, they tend to immediately blame the DW. After all, they have been using the data from these source systems for years, either through application reports or spreadsheets with extracted data, and they never encountered these problems before.
There is certainly a chance that there were bugs in the ETL loads or BI applications that slipped through testing, but those errors can be identified and corrected. And they are likely to be exceptions. What we are referring to are data quality problems that appear even when the data in the DW matches the source systems exactly.
Since the DW is often the only place where business people have an enterprise-wide view of their data, the DW is often the “canary in the coal mine.” Most of the reports and spreadsheets that the business person uses gathered data from a single source system. Because of this, they have never truly seen the data sourced from its many data silos with its potential data inconsistency problems. In addition, they might also be unaware of how the source system application reports or spreadsheets may have masked data quality issues within that source system.
Data Quality is the Result of Errors in Data Entry or Data Acquisition
Data entry or data acquisition in operational (source) systems is often blamed for data quality problems. Although incorrectly entered or missing data may cause problems, most source systems today have very robust validation screens or processes ensuring that data was entered correctly, so this type of error is typically minor in scope.
Although it is easy to blame data quality problems on the systems where the data was created or acquired, the majority of the quality issues relate to consistency, completeness, relevancy, and timeliness of the data. If two divisions are using different customer identifiers or product numbers, does it mean that one of them has the wrong numbers? Or is consistency the problem between the divisions? If the problem is consistency, then it is an enterprise issue, not a divisional issue. The long-term solution may be for all divisions to use the same codes, but that has to be a high-level enterprise decision.
The larger issue is that you need to manage data from its creation all the way to information consumption. You need to be able to trace its flow from data entry, transactional systems, data warehouse, data marts, and cubes all the way to the report or spreadsheet used for the business analysis. Data quality requires tracking, checking, and monitoring data throughout the entire information ecosystem. To make this happen, you need data responsibility (people), data metrics (processes), and metadata management (technology).
The Data Quality in Our Source Systems is Excellent
This is the answer given by many business and IT groups and, in particular, the source system application owners. This opinion is reinforced by the fact that often the source systems have been running for years, supporting enterprise operations without data problems. And business people have trusted the data from reports and spreadsheets to make business decisions during that entire period.
Do not fall into these traps. Do not assume anything about the state of the data. The areas where data quality and inconsistency problems lurk include:
• Data quality within SOR applications may be “masked” by corrections made within reports or spreadsheets created from this data. The people who told you the data is fine might not even be aware of these “adjustments.”
• Data does not age well. Although data quality may be fine now, there is always the chance that you will have problems or inconsistencies with the historical data. The problems can also arise when applications like predicative analytics need to use historical data.
• Data quality may be fine within each SOR application, but may be very inconsistent across applications. Many companies have master data inconsistency problems with product, customer, and other dimensions that will not be apparent until the data is loaded into the enterprise DW.
You Cannot Blame the DW because It Is a Read-Only Operation and Never Alters Data
Although the BI program cannot be blamed for creating the data quality problems, it can be blamed for not identifying and addressing the problems. The unfortunate events are that data quality and inconsistency problems will become evident in the enterprise DW and it will be blamed. Even if the DW program can prove the problems reside in the SORs, it still will be blamed for being surprised and not proactively dealing with it. The worst case is that the DW program’s credibility will be dealt a blow from which it cannot recover.
The first widely publicized definition of a data warehouse was that it was subject oriented, integrated, time variant, and nonvolatile. This established that the data warehouse was read-only and should not alter data—it is what it is. The DW mantra was that if the data is broken, fix it at its source. That was reinforced by the overall quality control mandate that you fix a problem at its source or as close as you can to it.
But if most data quality problems today are the result of data being inconstant due to data silos, then where is the root cause? No one source system owns the problem, so who becomes responsible? The pragmatic answer is that the enterprise BI and MDM programs own the problems. Maybe they cannot, realistically, fix them at their root since that is more in the people, process, and politics domain, so they should establish the information five C’s as best as they possibly can.
Data Cleansing Tools Will Fix Data Quality Problems
If only it were true that data cleansing tools fixed data quality problems. There are two main reasons why it is not.
First, data cleansing tools, although highly beneficial in certain use cases, do not address the primary data quality issues most enterprises face—data inconsistency and incompleteness. Much of the data cleansing tools are oriented toward cleaning up an enterprise’s people- and businesses-related attributes such as names and addresses. These attributes may apply to customers, prospects, suppliers, partners, employees, or patients. The locations could be homes or businesses. Much of this data is textual or location oriented, which means there is a high probability that these attributes will vary between data sources or interactions with people. The data cleansing software does parsing, matching, standardization, enrichment, and other functions that create one list of things such as customers, businesses, or products. Much of this data cleansing falls under the MDM umbrella. Although these tools do address particular data inconsistency use cases, even a large enterprise with significant investments in MDM will still need to deal with data inconsistency and incompleteness arising from its many silos. And SMBs will not likely make the MDM investments, so they will have to deal with these data issues without the benefit of these tools.
Second, technology is not a cure-all for data quality, especially since the root of the problems arise from people, processes, and procedures. As we discuss in Chapter 17, an enterprise needs to recognize that data is an enterprise asset and establish a data governance program to help manage that data on an ongoing basis.
Build the Data Quality Services
Once it identifies and resolves the misconceptions, the BI team needs to proactively build and deploy data quality services. The steps the BI team needs to undertake are:
• Obtain data quality and consistency estimates and assumed metrics as part of a service level agreement (SLA) when gathering the business and data requirements from the business and SOR application owners.
• Perform a data profiling and source systems analysis to determine the current state of data quality and consistency within and across SORs.
• Create a gap analysis between current state and desired state, i.e., data quality metrics in SLA.
• Propose data integration tasks that are needed to bridge that gap. This should include timeline, tasks, resources, and costs to implement and maintain an ongoing set of data quality processes.
• Negotiate with business and SOR application owners if effort or costs are too high to lower metrics within SLA.
• Once the BI team has the agreed-upon data quality metrics, they can define them, determine how to monitor them, and then design the data quality reporting or alerting application.
There are three categories of data quality measures that the BI team needs to define, develop, and deploy within the data quality services:
• Structural. This verifies that the relationship between tables and columns is correct. This involves checking referential integrity, hierarchies, multivalue relationships, and the integrity of subdimensions. There may also be groups of columns that are related that need to be verified.
• Attributes. This verifies that the attribute content adheres to property definition and constraints (but not that the actual attribute value is correct). These properties include:
• Whether or not it can be null
• Numeric value within allowable range, if applicable
• A member of a list of values
• Matches allowable character patterns, if applicable
• Valid data types
• Business rules. This verification could span a wide variety of business context checks or business algorithms. The data needed to perform these verifications may be sourced from a variety of data sources. This may be quite complex. The business rules need to be signed off on by a responsible business person as part of the business and data requirements.
Implementing Data Quality Services
The three data quality services are:
• Data conformance
• Data consistency
• Data cleansing
Data conformance involves creating and populating a conformed dimension when there are multiple data sources for a particular dimension. The most common examples are creating a single customer list or product lists. Data profiling determines the extent of the nonconformance in business rules. You will need to define this with the business people when designing this service.
Data consistency involves making sure that there are standard measures on fact tables when there are multiple variations of that measure. Similar to data conformance, data profiling determines the extent of the nonstandardization in business rules and requires working closely with the business to define what is needed.
Data cleansing is the term used for the off-the-shelf data quality products (discussed earlier in this chapter). These tools include features such as parsing, matching, enrichment, survivorship, and householding. Because of their expense and specific use cases, typically only a limited number of the largest firms use them.
Each of the data quality services will monitor one or more of the data quality measures in regard to structure, attributes, or business rules. Process management services will record the results through its audit subservice and will process errors through its error handling subservice.
Process Management Services
The process management services are the command-and-control center for the data integration jobs. Depending on what data integration product is being used, jobs may also be referred to as sessions, workflows, flows, job sequences, or packages. These services include:
• Job control—manages the workflow of data integration jobs.
• Audit—records processing metadata of the data integration jobs.
• Error handling—processes errors according to predefined rules and records error events.
Each of these services generates process metadata that tracks data integration operations. Although all data integration tools perform these services, there is a wide variety in the prebuilt functionality and the extent of the process metadata that is tracked. Although one would be correct in assuming that the most expensive data integration tools have extensive command-and-control capabilities, it is interesting to note that some of the more economical tool offerings in terms of licensing costs also have robust capabilities.
Job Control Services
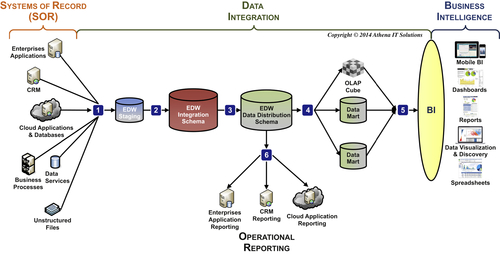
As data is gathered, transformed, and delivered as information, there will be many data integration services that are invoked in a complex workflow. Related services are bundled together in jobs that gather data, transform it, and then load it into a target data store. These jobs operate successively, as depicted in Figure 12.15, moving data from SORs to its eventual consumption in BI applications.
Audit Services
The purpose of audit services is to track the processing actions that occur for all tables and columns in the BI data architecture. The audit services track the following three areas:
• Data integration jobs
• Table and row updates
• Data quality metrics
Data Integration Jobs
The data integration products offer a wide variety of audit services for job-processing metadata. The base level of job audit data should be as follows:
1. Job ID—unique processing identifier for a data integration job.
2. Job hierarchy with each Parent Job ID that invokes a Child Job ID. There ultimately would be a Master Job ID for the top level job in the workflow.
3. Start time, completion time, and duration for each job.
4. Completion status such as success, warning (error), or failure (job stopped).
5. List of source, target, and lookup tables along with number of rows accessed, successfully processed, and rejected.
6. The most complete job audit services will also provide the data for 3–5 above to the grain of the individual data integration functions performed within the job.
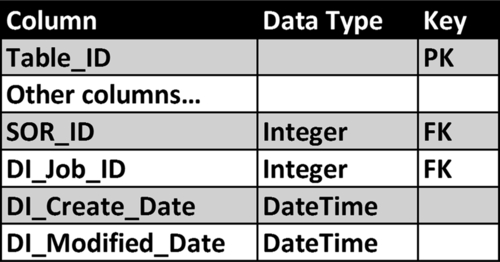
Table and Row Updates
Data integration job audit data tracks the flow of data through the BI data architecture at the grain of the table. It is a best practice to track row level audit data to better manage it, enable data lineage analysis, and assist in improving system performance. The template schema as depicted in Figure 12.16 enables this type of audit data. The schema includes:
• DI_Job_ID—the data integration job identifier is the job ID that the data integration tool generated. This identifier is a foreign key to the data integration tool’s processing metadata. If that metadata is available, then this link provides a powerful mechanism to analyze data integration processing and performance down to the level of a table’s row.
• SOR_ID—This is the SOR identifier that will tie this row to a particular SOR. Use this when the table the row is sourced from multiple systems of records and enables the row to be tied to the specific SOR.
• DI_Create_Date—This is the date and time that this row was originally created in this table. Often a database trigger is used to insert the current time, but the data integration job could also insert the current time directly.
• DI_Modified_Date—This is the most recent date and time that this row has been modified in this table. Often a database trigger is used to insert the current time, but the data integration job could also insert the current time directly. It is often a standard practice to populate this column with an initial value far in the future such as “9999-12-31” rather than leaving it a NULL to avoid queries with NULLs when analyzing this column.
Data Quality Metrics
This is a best practice when data quality metrics have been designed and deployed for specific fact tables in the BI data architecture. There are two tables defined:
• Data quality metrics—this contains the list of each of the data quality metrics that are tracked and the tables to which they apply.
• Data quality audit—this table has a row for every data quality metric that was violated, its data source, and its target table. In addition, it includes the job audit columns.
Error Handling Services
When an error occurs in a data integration job, the possible options are:
2. Treat as a warning and continue processing
3. Do something and then resume processing at a designated point in the workflow
Although there are always errors that the data integration team cannot anticipate, the best practice is to manage the error processing as in option (3).
The data integration team needs to perform the following tasks:
• Identify where in the data integration job processing workflow errors may occur and what they would be.
• Determine the actions to be performed for each identified error and workflow location.
• Determine the point in the workflow that processing will resume.
• Design and implement the error handling actions in the data integration jobs, including recording the error audit metadata.
Fortunately, most data integration products have, prebuilt into every data integration function that processes data, the ability to divert the actual error data to a table or file that is designated to store it.
You can use several tables to implement this functionality:
• Error conditions—This contains the list of all of the error conditions that are tracked and what tables to which they apply.
• Error audit—This table has a row for every error condition that was encountered, its data source, and its target table. In addition, it includes the job audit columns.
• Error data—This table contains each of the error rows encountered, a foreign key linking the row to the error audit table, and the job audit columns.
Operations Management Services
You can use operation management services to monitor and manage the design, development, and running of data integration services. These services need to make the data integration environment efficient in terms of utilizing resources and effective in terms of achieving business and technical objectives. Those objectives should have reliability and responsiveness as key success criteria. When possible, it is a best practice to agree to and then meet SLAs regarding those criteria.
The list of operational management services include:
• Scheduling. This service allows you to schedule data integration services, execute that schedule, monitor services, trigger status alerts, and provide operational reporting. Invoke the services based on a time schedule or event triggers such as the completion or failure of other services. In addition to having independent scheduling services, it is common for data integration tools to support interaction with an enterprise’s independent job scheduling applications.
• Restart and recovery. The service enables you to suspend or stop the execution of other services. It also provides the ability to recover from and restart services that were either stopped manually or through system error. This service will need to leverage the commit and rollback functionality of the target data stores such as databases or file systems. Ensure that error handling can interact with the service when specific severe error conditions are encountered. It is a best practice to design each data integration service with the ability to restart and recover independent of other services.
• Security and privacy. This service provides account and role-based security both during the creation and execution of data integration services. Overall enterprise data security and privacy, however, will be a combination of network and database mechanisms rather than what the data integration service will provide. It is essential that you develop and enforce security policies and procedures for operating data integration services because they are likely to access confidential or sensitive data in an enterprise.
• Documentation. This service provides documentation of individual data integration services as well as the workflow and dependencies between them. This documentation should include descriptions of services, the metadata explaining the service (such as the source and target mapping), and graphical representation of the workflows. Make sure this documentation can be saved with its associated code in the release management system. In addition, make sure the service can provide data lineage and “where used” functionality to enable analysis of where (source and targets), when (in what specific data integration services), and how data is transformed throughout the data integration services.
• Software management system. This system manages the entire software lifecycle including design, development, testing, deployment, operations, maintenance, and releases. This includes the software code and its associated documentation across software releases or versions. This system may interact with an external software code management application from a check-in and checkout perspective.
• Repository management. This service manages the business, technical, and processing metadata in the data integration suite’s repository. It creates and updates this metadata during the design, development, and operation of data integration services. This service provides import, export, and backup of the metadata.
• Operations reporting. This service provides monitoring, reporting, and analytical functionality on management services. This also includes the ability to send alerts based on development or processing events. It is a best practice to provide operational metric dashboards, reporting, and trending on an ongoing basis for both business sponsors and the enterprise’s infrastructure group. If SLAs are in place, this is an effective method to monitor those criteria.
Data Transport Services
Business intelligence systems are built to create the information five C’s and break down the data silos that enterprises have been building for decades. Just as they have built data silos, enterprises have also been building integration silos using a wide variety of integration technologies that address specific integration use cases. Whereas data integration has become identified with ETL or ELT technologies, the other integration uses have fallen under the umbrella of application integration.
The more sophisticated data integration vendors recognized that there was a significant amount of overlap in the uses of data and application integration technologies. In many uses, any of the integration technologies handle the following three fundamental operations:
1. Access data
2. Transform data
3. Deliver data
These fundamental operations are what data integration tools have been doing for years. These data integration vendors have integrated a wide variety of integration technologies into their tools. The integration technologies we have labeled as data transport services enable data integration to be performed across a variety of integration platforms.
This list of data transport services includes:
• ETL and ELT
• Enterprise application integration including ESB, SOA, and Web (or data) services
• Enterprise message services including XML and JSON
• EII including data virtualization and data federation
..................Content has been hidden....................
You can't read the all page of ebook, please click here login for view all page.