Advanced analytics focuses on gauging the future and allowing what-if analysis. Predictive analytics and data mining are the processes by which one performs advanced analytics for forecasting and modeling. Data visualization is an analytics technique that presents information pictorially, often graphically, helping to communicate a huge volume of information in a more intuitive way. Enterprises need two distinct types of self-service data environments based on different business analytical requirements: analytical sandboxes, to enable business users to be able to add data and derive metrics, and analytical hubs, which accommodate more extensive and intensive data gathering and analysis. Analytics for Big Data require special attention to the scope, program, architecture, and team.
Keywords
Analytical hub; Analytical sandbox; Analytics; Big Data; Data mining; Data visualization; Predictive analytics
Information in This Chapter:
• Advanced analytics definition
• Predictive analytics & data mining
• Analytical sandbox
• Analytical hub
• Big Data analytics
• Data visualization
Advanced Analytics Overview and Background
Enterprises are deluged with data about their customers, prospects, business processes, suppliers, partners, and competitors. They come from traditional internal business systems, cloud applications, social networking, and mobile communications. With the flood of new data and analytical techniques comes the opportunity for business people to perform new types of analyses to gain greater insight into their business and customers.
Business intelligence (BI) historically has enabled monitoring of what has occurred, analyzing why it happened, and then acting on that analysis. Over the years, organizations have been able to monitor, analyze, and act on greater data volumes and more diverse data sources more efficiently. The current marketing catch-phrase used to characterize Big Data is “increasing data volumes, varieties and velocity”―referred to as the 3 Vs. Although many believe that the 3 Vs are a recent phenomenon, it is really just a data evolution that organizations have been experiencing for years.
BI started out as providing tabular, printed reports, often many pages that business people would search through until they found the information they were looking for. BI has progressed, and now people can query and interact with a variety of data they analyze and then display in a variety of presentations such as scorecards, mash-ups, online analytical processing (OLAP) cubes, pivot tables, business graphics, and data visualizations. All of these presentations are usually packaged in dashboards geared for specific business groups and analysis.
Advanced analytics focuses on gauging the future and allowing what-if analysis. The terms “advanced analytics,” “predictive analytics,” and “data mining” are often used interchangeably, but most agree that advanced analytics is the umbrella term, and predictive analytics and data mining are the processes by which one undertakes advanced analytics.
The Window to the Future
With all the capabilities added to BI and gains in the data 3 Vs, business people were still monitoring, analyzing, and acting on past events. Knowing what already happened is still useful, but at times when their business, customers, and competitors are changing, it is a little like driving by watching your rearview mirror. Advanced analytics represents a second BI wave where business people are just not reacting to the past, looking in the rearview mirror, but also trying to gauge the future and act on those predictions.
The opportunity, however, comes with new challenges. Performing business analytics used to mean defining business requirements and then using predefined reports. But now, with the flood of data and constantly changing business environment, people do not always know what they need ahead of time, so predefined reports and dashboards are not always relevant to what a business person needs in a specific situation. Instead, people need to conduct new analysis using different data that they may be using in their current dashboards based on what is happening right here, right now. As a result, business analytics has to be “situational;” that is, it needs to respond to rapid changes in the business, economic, and competitive environment.
Advanced analytics is an organization’s window to the future. Where BI looks at historical information to learn what has happened by measuring and monitoring it, advanced analytics help you make predictions and forecasts based on examining that historical data in new ways. With advanced analytics, an organization can identify meaningful patterns and relationships in data to help predict future events and determine the best course of action. These predictions are not foolproof but can be very reliable based on the modeler’s skills and the quality of the model that she develops.
For example, you can use it to predict customer behavior, identify fraud before approving a credit card transaction, or, as Google has been known to do, show where flu outbreaks are occurring across the country. It is also used for national security (although controversial), when governments use it to discern patterns in phone records that identify potential terrorist activity.
Don’t Ignore the Past
A common misconception is that predictive analytics frees an enterprise from having to capture, integrate, and cleanse historical data. This misnomer is based on the often-used marketing pitch that BI is about the past and predictive analytics is about the future. Although the pitch is true from the perspective of what the business person sees on her advanced analytics presentations, it fails to appreciate that in order to get those predictions the statistical database or predictive models had to analyze historical data. If historical data was not used for predictions, then there would not be predictive models but merely guesses as to what will happen.
Often, new waves of technology are ushered in with the impression that things are completely different this time and a revolution has occurred. Advanced analytics, along with Big Data hype, is being ushered in with the feeling that an enterprise can escape the hard work of data integration that has accompanied BI and data warehouse (DW) efforts and just skip ahead to advanced analytics. If only that were true! The reality is that the need for greater amounts of the 3 Vs and accompanying data integration significantly increases with advanced analytics.
Advanced Analytics in Action
The industries that pioneered the use of advanced analytics software are insurance, financial services, consumer products, and retail. Companies in those industries share the need to understand who their customers and prospects are, how to up-sell and cross-sell products and services, and how to predict customer behavior (including bad behavior through processes such as fraud detection). Advanced analytics tools can help in all of those areas. Many companies also need to examine economic and competitive factors affecting their business, while more-specific needs may include data on weather, life expectancy, and component prices. Other industries that have benefited from advanced analytics include telecommunications, travel, health care, and pharmaceuticals.
Advanced analytics has even been a driving force in political campaigns to determine who might be persuaded to vote for a candidate. A recent presidential campaign broke new ground in data mining social media by scouring the Facebook friend lists of its supporters (who had “liked” its page) for names that matched those of potential or undecided voters; determined which ones were “real” friends, in part by examining who was tagged in photos with whom; and thus winnowed the list down to 15 million people to target in swing states. They then matched this list of people with data from their TV set-top boxes, which showed exactly what programs they watched and when. This enabled precise TV ad placements on cable channels, costing far less money than blasting ads in prime time on the major networks [1].
Marketing and sales campaigns across all industries will be increasingly driven by advanced analytics. The most successful marketing and sales organizations have always incorporated a way to measure the effectiveness of their campaigns, which dovetails measuring the effectiveness of their predictive models. This feedback loop is essential for building and refining effective predictive models (see process next).
Predictive Analytics and Data Mining
Predictive analytics and data mining are the processes by which you perform advanced analytics for forecasting and modeling. While BI has become widely used, even to the point of being pervasive in many organizations, far fewer organizations use advanced analytics tools.
In addition, whereas information technology (IT) groups typically develop BI dashboards and reports for business users, predictive analytics and data mining models usually are created by a handful of highly skilled end users. It can be an eye-opening experience for IT workers to realize that the people who build these models are more data savvy and technically oriented than they are. (In fact, predictive model builders often view the IT staff merely as data gatherers whose purpose is to feed their data-hungry models.)
Predictive model builders are often called data scientists, but unfortunately, as with many popular terms in our industry, this job title is increasingly being used to describe any person who is involved in a Big Data or advanced analytics projects. We take a much narrower view of who should have this job title. A data scientist is a predictive model builder who has expertise in data and statistics, as well as understanding the organization’s business model, its industry dynamics, and the economic climate. (Roles and responsibilities are covered later in this chapter.)
Setting Up a Predictive Analytics or Data Mining Program
Across industries, there are common approaches that organizations can take to build the required predictive models, select technology, and staff for successful predictive analytics projects.
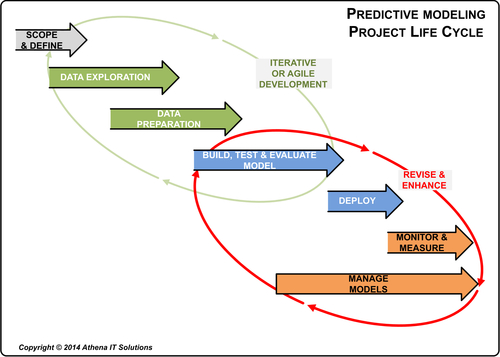
Building predictive models is a combination of science and art. It is an iterative process in which you create a model from an initial hypothesis and then refine it until it produces a valuable business outcome―or discard it in favor of another model with more potential (see Figure 15.1).
With a typical BI project, business users define their report requirements to the IT or BI group, which then identifies the required data, creates the reports and hands them off to the users. Similarly, in predictive analytics and data mining deployments, a joint business–IT team must scope and define the project, after which IT assesses, cleanses and integrates the required data. At this point, though, advanced analytics projects deviate from conventional BI projects because it is the users―for example, statisticians, mathematicians, and quantitative analysts―who take over the process of building the predictive models.
The IT or BI group reenters the picture after the models have been developed and start being used by business and data analysts. For example, IT or BI teams might incorporate the predictive analytics results into dashboards or reports for more pervasive BI use within their organizations. They might also take over the physical management of predictive models and their associated technology infrastructure.
To run predictive models, companies require statistical analysis, data mining, or data visualization tools. Typically, predictive analytics software and other types of advanced data analytics tools are used by experienced analytics practitioners who are well versed in statistical techniques such as multivariate linear regression and survival analysis.
Tasks for Developing and Using Models
Developing and then using predictive models involve the following tasks:
1. Scope and define the predictive analytics project.
Although important in any BI project, it is especially crucial in predictive modeling projects to target what is being addressed rather than having a “fishing expedition.” Far too many projects get sidetracked, wasting time and money, without generating any business benefits because of inadequately defined scope. Answer the following questions:
• What business outcomes are you trying to effect?
• What business processes, external events, and factors, such as economic or demographics, will you analyze as part of the initiative?
• Who (people) and how (business processes) will the predictive models be used?
2. Explore and profile your data.
Because predictive analytics is a data-intensive application, considerable effort is required to determine the data that is needed for the project, where it is stored, whether it is readily accessible, and its current state, especially in regard to completeness and quality. A major difference with typical DW projects is that it is common to use data that is incomplete or has quality issues simply because it is the best that can be obtained. The data scientist needs to understand the state of the data and determine the impact and then may need to adjust the models to compensate for the data quality.
3. Gather, cleanse, and integrate the data.
Once the necessary data is located and evaluated, work often needs to be done to turn it into a clean, consistent and comprehensive set of information that is ready to be analyzed. That process may be minimized if you leverage an enterprise data warehouse as the primary data source. But if you augment the warehoused information with external and unstructured data, it will add to the data integration and cleansing work you need to do.
Another difference from DW projects is that sometimes data need to be synthesized or created to be used as input to the predictive models. Two examples follow:
• Incomplete data on consumer use or behavior in regard to competitive offerings
• Economic forecasts that are too high and may not adequately reflect effects on your targeted customers and prospects
In both of these examples, the data scientist may need to create separate predictive models for each just to generate the input data needed for the primary predictive model. Creating predictive models as input to other predictive models is sometimes referred to as synthesizing data. This adds to the complexity and time to build the predictive models, but it is essential to creating truly predictive models.
4. Build the predictive models.
The model builders take over here, creating models and testing their underlying hypotheses through steps such as including and ruling out different variables and factors, back-testing the models against historical data, and determining the potential business value of the analytical results produced by the models. This is a highly iterative process of examining dozens or hundreds of variables and correlations. In the process of creating and testing models, the modeler may uncover the need for additional data and data integration to develop a more robust model.
5. Incorporate analytics into business processes.
Predictive analytics tools and models are of no business value unless they are incorporated into business processes so that they can be used to help manage (and hopefully grow) business operations. Fraud detection is an example of a predictive model that can be integrated and automated into a business process. Other predictive models may assist sales people in identifying prospects or support personnel in offering cross-sell and up-sell opportunities with existing customers with whom they are talking or chatting.
6. Monitor the models and measure their business results.
Predictive models need to adapt to changing business conditions and data. And the results they are producing need to be tracked so that you know which models are providing the most value to your organization and can alert the business if a model’s value starts to decline. With increasing data sources and volume, predictive model performance data, and additional business insights, new or modified models are likely to emerge.
7. Manage the models.
Too often, enterprises think model management is simply managing the modeling code. Although code management should be a basic process, model management best practices involve business value management. An enterprise needs to prune the models with little business value, improve the ones that may not yet be delivering on their expected outcome but still have potential, and tune the ones that are producing valuable results to further improve them. The goal is to improve business return on investment from modeling.
Selecting Tools
Most BI vendors sell integrated product suites that include query tools, dashboards, and reporting software. But if they offer predictive analytics software, it tends to be sold as a separate and distinct product. While that is starting to change, the predictive analytics tools now being used primarily come from vendors that specialize in statistical analysis, data mining, or other advanced analytics.
See the book Website www.BIguidebook.com for discussions of vendors and products.
Compared with a typical BI software evaluation, where the IT or BI group drives the software selection process while soliciting input and feedback from business users, an evaluation of predictive analytics and data mining tools is turned upside down―or at least it should be. Ideally, the data scientists, statisticians, and other users who build the predictive models should take the lead in evaluating the predictive analysis tools being considered, with IT providing input on the software’s potential impact on the organization’s technology infrastructure. In this case, the users are likely to be the only ones who understand the statistical or data mining techniques they need and whether the various tools can support those requirements.
Architecture for Predictive Analytics and Data Mining
In a typical BI architecture, the business person is at the end of the information workflow (that is why they are referred to as end users) with IT handling the workflow from data creation, data integration, and distribution until consumption. In advanced analytics, however, the business people that create predictive models participate in the entire data workflow plus they use the predictive models (since they still are the end users).
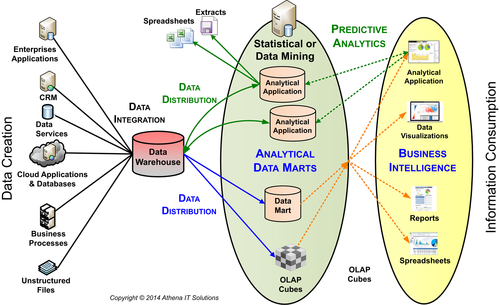
In Figure 15.2, the predictive modeler will use the analytical data mart to create her models, and the end users consume those models in the usual BI environment. The section on “Analytical Hubs” will discuss the architectural approaches that support advanced analytics.
FIGURE 15.2Example of advanced analytical architecture.
Techniques for Predictive Analytics and Data Mining
Advanced analytics comprises several techniques for analyzing current and historical data to make predictions about unknown events (Table 15.1).
Table 15.1
Advanced Analytics Techniques and Examples
Technique
Example
Statistics
Use for customer segmentation.
Predictive modeling
Create fraud detection models for credit cards.
Forecasting
Create sales forecasts for each product category and country including seasonality and weather.
Data mining
Determine college freshmen retention rates based on demographic and academic attributes.
Descriptive modeling
Split customers into categories by their product preferences and stage of life (age, children, marital status, working, etc.)
Econometrics
Determine impact of economy and US Federal Reserve’s bond buying policy on job postings and hires.
Operations research
Determine the flow of raw materials in supply chain using variability of demand and supply.
Optimization
Determine the best routes for delivery trucks.
Simulation
Determine what the impact is to customers’ loyalty and market share from pricing changes.
Textual analytics
Perform a sentiment analysis on the introduction of product line extensions and new categories.
Resources and Skills
Predictive model builders and users must have a strong knowledge of data, statistics, an organization’s business operations and the industry in which it competes. They also need to understand statistical and data visualization tools. Companies, even very large ones, often have only a small number of people with such skills. As a result, predictive modelers and analysts are likely to be viewed as the star players on a data analytics team (Table 15.2).
The typical organizational structure places predictive analytics experts in individual business units or departments. The analysts work with business executives to determine the business requirements for specific predictive models and then go to the IT or BI group to get access to the required data. In this kind of structure, IT and BI workers are enablers: Their primary tasks are to gather, cleanse, and integrate the data that the predictive analytics gurus need to run their models.
Table 15.2
Advanced Analytical Skills
Model Builders
Analytic Application Builders
Data Preparation and Integration Developers
Excellent knowledge of the business and industry. Potentially understands economics and consumer behavior.
Understands business processes and workflow application development.
Deep data knowledge.
Knowledge of data and relationships.
Ability to build BI and data visualization applications for consumers of predictive models.
Experts in data integration, data cleansing, data profiling.
Experts in statistical and data visualization tools.
Roadblocks to Success
With all the press regarding the business value of advanced analytics and the accompanying product hype proclaiming analytics nirvana, advanced analytics projects are particularly vulnerable to the following roadblocks:
• Data overload: Who would have ever thought this would be a problem? With the significant increase of the 3Vs it is up to the predictive model builder to determine what data is relevant and what is simply noise or even misleading. Finding that needle in a haystack is an apt analogy, since the modeler will likely examine dozens or hundreds of attributes to determine which ones actually are relevant to making a successful model.
• Dirty, disparate, and incomplete data: The expression GIGO (garbage in, garbage out) is especially pertinent to building models. Data needs to be clean, accurate, complete, and easily accessible to be useful in models.
• Data silo: Enterprises have been building business, application, and data silos over the years. Multiple silos means multiple versions of the data, raising the issue of whether the version of the data is the correct one.
• Confusion: Predictive analytics and data mining can be difficult concepts to explain in simple terms. This confusion can lead to unrealistic expectations regarding time and resources to build predictive models. In addition, inflated business expectations can derail future projects.
• Expertise: There is a major skills gap for people who can build effective predictive models. The combination of technical and business knowledge necessary is often shortchanged as an enterprise thinks that programming or statistical tools expertise is sufficient by itself to build a business relevant model.
• Silver bullet solutions: As with any emerging technology application, product hype often shortchanges the amount of time and skills necessary to be successful. Good technology can make your modeler more productive, but without the expertise and business knowledge it is unlikely to result in business success.
• Synthesizing data: It is very common to need to create or synthesize data to build predictive models, but often this is a very time-consuming process that IT would prefer to avoid. It is necessary to explain the purpose and business value of creating this data to overcome this hurdle.
• Creative destruction: Building successful predictive models means being able to learn from their use to modify or replace existing models to improve business return on investment. The world changes, and with it often so do the factors influencing a model’s business performance, meaning a modeler cannot stand pat on what he built but needs to be willing to modify or replace it.
The critical success factors for successful deployments of predictive analytics tools include having the right expertise (i.e., predictive modelers with a statistical pedigree); delivering a comprehensive and consistent set of data for predictive analytics uses; and properly incorporating the predictive models into business processes so that they can be used help to improve business results.
Analytical Sandboxes and Hubs
When business people cannot easily get the data they need they take matters in their own hands and create data shadow systems. In order to avoid this, IT needs to build self-service data environments for the business. This implies a fundamental shift from today’s enterprise BI systems, where IT provides the data and creates all the BI dashboards and reports. The new approach means IT concentrates on building the data backbone and shifts BI responsibility for discovery analytics to business people in a self-service environment. (IT still provides the recurring, preplanned reports, and dashboards in a production environment.)
The self-service data environment will include physically integrated data stores, such as data marts and OLAP cubes, but more importantly data virtualization to enable business people to be able to tap data that have not been physically integrated or data specific to their business analysis that may not (or should not) be shared in a data warehouse.
Best-in-class enterprises need two distinct types of self-service data environments based on different business analytical requirements:
• Analytical sandboxes
• Analytical hubs
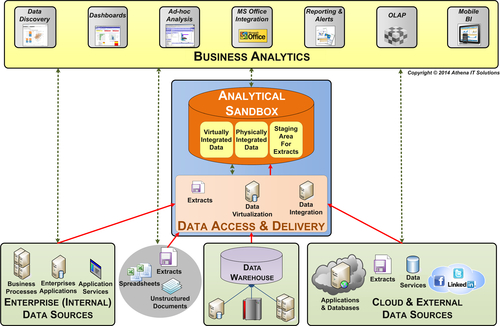
Analytical Sandboxes
Business analysts and business “power” users perform much of the discovery analysis. These business people often leverage an enterprise’s data warehouse as a starting point for their analysis but need additional data and metric calculations. Some of these special needs can be anticipated and built into a data mart, often called an exploratory data mart or OLAP cube, but even with this there is a significant data gap.
An exploratory data mart may be terrific, but IT also needs to create an analytical sandbox environment enabling business users to be able to add data and derive metrics. Without the ability to expand their data footprint, business people will be forced back to their spreadsheets and data shadow systems to perform the analysis needed to do their jobs.
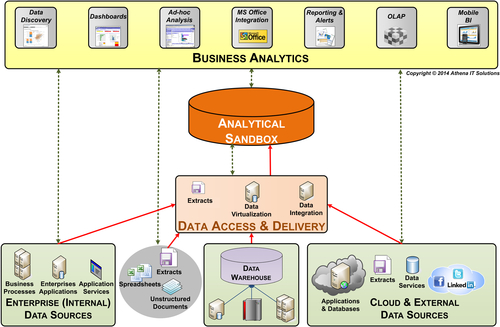
The key components (see Figure 15.3) of the analytical sandbox environment are:
• Business analytics—contains the self-service BI tools used for discovery and situational analysis by business people
• Analytical sandbox platform—provides the processing, storage, and networking capabilities for analytical and query processing
• Data access and delivery—enable the gathering and integration, physical or virtual, of data from a variety of data sources and data types
• Data sources—sourced from within and outside the enterprise, it can be Big Data (unstructured) and transactional data (structured); e.g., extracts, feeds, messages, spreadsheets, and documents
Many business analysts start out with data from an enterprise data warehouse and specific business applications; they often need to augment it with data from other sources such as spreadsheets or even data from outside the enterprise.
Today, those data sources can be physically local, virtual, or in the cloud. Earlier attempts to source data from these types of environments required exploratory data marts or OLAP cubes but were thwarted by Big Data integration and BI backlogs, so people were forced to create data shadow systems. Many business analysts spend significant time creating these systems and manually importing data from a variety of sources.
Data virtualization empowers business people in a couple of ways. First, it enables them to expand the data used in their analysis without requiring that it be physically integrated. Second, they do not have to get IT involved (via business requirements, data modeling, ETL and BI design) every time data needs to be added. This iterative and agile approach supports data discovery more productively for both business and IT.
Data virtualization eliminates the undocumented, overlapping and time-consuming point-to-point direct access connections that business people got stuck doing in the past with their data shadow systems. With data virtualization, IT and business people can add data sources into a repository that will document them, identify relationships between sources and uses, and encourage reuse. To the business analyst, the virtualization repository provides an information catalog to the relevant data needed for their analysis.
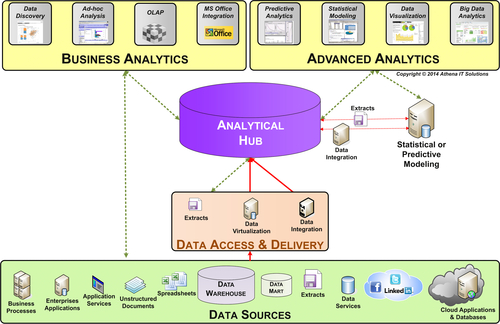
Analytical Hubs
Advanced analytics, such as predictive analytics, involves more extensive and intensive data gathering and analysis than what would be performed within an analytical sandbox. Typically, a data scientist, statistician, or someone with a similar background will be developing business models using a combination of statistical and data visualization tools consuming large quantities of data. This is an advanced analytical development environment referred to as an analytical hub. The analytical sandbox and hub have similarities, but the hub is a more advanced architecture created for more advanced users and uses. (Figure 15.4.)
FIGURE 15.3Analytical sandbox.
FIGURE 15.4Analytical hub.
The key components of the analytical development environment are:
• Business analytics—contains the self-service BI tools used for discovery and situational analysis
• Advanced analytics—contains analytical tools used for statistical analysis, predictive modeling, data mining, and data visualization
• Analytical hub platform—provides the processing, storage, and networking capabilities
• Data access and delivery—enables accessing and/or integrating a variety of data sources and types
• Data sources—sourced from within and outside the enterprise, it can be Big Data (unstructured) and transactional data (structured), e.g., extracts, feeds, messages, spreadsheets, and documents
Developing predictive models requires iteratively testing various hypotheses by varying data, variables, and relationships. Often, the gating factor to data scientists has been getting the data they need. Generally, they spend much of their time gathering and loading data before they can even build the models. By adding data virtualization into the mix, data scientists can find data more quickly and not have to load all the data they need into their own environment before they start analysis. This greatly speeds up designing, validating, and refining the predictive models.
Data commonly comes from an enterprise data warehouse and various business applications; however, that is rarely sufficient for advanced analytics. Syndicated data feeds, data publically on the Web, Big Data sources, unstructured data, and spreadsheets are typically used to supplement traditional enterprise BI data sources. The analytical hub provides data scientists with the ability to gather and, either physically or virtually, integrate data from these diverse data sources. Contrary to the traditional IT managed data environment, data scientists need the flexibility to gather data regardless of, and sometime despite, its quality in order to perform analysis.
Hub and Sandbox Design Principles
When creating analytical hubs and sandboxes, follow these design principles to provide the right enterprise environment:
• Data from everywhere needs to be accessible and integrated in a timely fashion—Expanding beyond traditional internal BI sources is necessary as data scientists examine areas such as the behavior of a company’s customers and prospects; exchange data with partners, suppliers and governments; gather machine data; acquire attitudinal survey data; and examine econometric data. Unlike internal systems that IT can use to manage data quality, many of these new data sources are incomplete and inconsistent, forcing data scientists to leverage the analytical hub or sandbox to clean the data or synthesize it for analysis.Advanced analytics has been inhibited by the difficulty in accessing data and by the length of time it takes for traditional IT approaches to physically integrate it. The analytical hub needs to enable data scientists to get the data they need in a timely fashion, either physical integrating it or accessing virtually integrated data. Data virtualization speeds time-to-analysis and avoids the productivity and error-prone trap of physically integrating data.
• Building solutions must be fast, iterative, and repeatable—Today’s competitive business environment and fluctuating economy are putting the pressure on businesses to make fast, smart decisions. Predictive modeling and advanced analytics enable those decisions to be informed. Data scientists need to get data and create tentative models fast, change variables and data to refine the models, and do it all over again as behavior, attitudes, products, competition, and the economy change. The analytical hub and sandbox need to be architected to ensure that solutions can be built to be fast, iterative, and repeatable. The analytical hub needs to support managing predictive models and the data sets used to build, test, and revise them.
• The advanced analytics elite needs “run the show”—IT has traditionally managed the data and application environments. In this custodial role, IT has controlled access and has gone through a rigorous process to ensure that data is managed and integrated as an enterprise asset. The enterprise needs to entrust data scientists with the responsibility to understand and appropriately use data of varying quality in creating their analytical solutions. Data is often imperfect, but data scientists are the business’s trusted advisors who have the knowledge required to be the decision-makers in this regard.
• Solutions’ models must be integrated back into business processes—When predictive models are built, they often need to be integrated into business processes to enable more informed decision-making. After the data scientists build the models, there is a hand-off to IT to perform the necessary integration and support their ongoing operation. IT will also need to gather data from these processes for the data scientists to monitor the performance and effectiveness of these processes.
• Sufficient infrastructure must be available for conducting advanced analytics—This infrastructure must be scalable and expandable as the data volumes, integration needs, and analytical complexities naturally increase. Insufficient infrastructure has historically limited the depth, breadth, and timeliness of advanced analytics as data scientists often used makeshift environments.
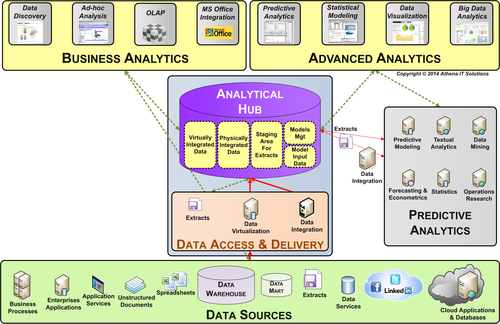
Hub and Sandbox Architecture Options
See Figures 15.5 and 15.6 for the architecture layers of hubs and sandboxes, respectively. They show the following components: business analytics, advanced analytics, hub platform, predictive analytics, and data access to a variety of data sources. Architectural options are outlined for each layer using the design principles cited.
Business Analytics and Advanced Analytics Layers
In both the hub and the sandbox, the goal of the business analytics layer is to provide the analytical tools to support self-service BI. The technology selected in this layer needs to support business analysts and data scientists who are conducting their own analytics rather than relying on IT to design reports or dashboards. Their analytical styles and the BI platforms are important considerations. This layer is often used in the initial steps of the analysis to determine data availability.
The goal of the advanced analytics layer in the hub is to provide the “front-end” advanced analytical tools for data scientists; the companion “back-end” or server-based technology is in the predictive analytics layer. This layer is used to perform the advanced analytics’ processes and to develop predictive models.
Some important considerations when you are designing both the analytical hub and sandbox include:
• Multiple BI analytical styles—Data scientists use different analytical styles depending on the type of analysis they are performing, the data volume and the data variety. Business analytical styles include data discovery, OLAP, ad-hoc, dashboards, scorecards, and reporting. Advanced analytics styles for hubs include: predictive analytics, statistical modeling, data visualization, and Big Data analytics. It is important to provide the many analytical styles that are needed by data scientists and enable them to use these tools in a self-service mode.
FIGURE 15.5Analytical hub―architecture.
FIGURE 15.6Analytical sandbox―architecture.
One of the topics widely discussed in regards to providing multiple styles is whether it is best to get all the tools from a single vendor in a BI suite or use the “best-of-breed approach” acquiring the best fit regardless of whether they are from different vendors. With the vendor and product landscape constantly changing, along with enterprise preferences in regards to vendor selection, an enterprise should make this choice based on the tool that is the best fit to deliver that functionality to its users.
• Multiple BI delivery and access platforms—The analytical hub and sandbox need to provide access from and delivery to analytics performed on the desktop, in the cloud, on mobile devices (tablets and smartphones), and Microsoft Office applications. This enables data scientists to perform their analysis on the most appropriate platform for their needs. In contrast to business analysis that is typically read-only, advanced analytical tools will be performing read and write operations on data hosted in the hub platform, particularly when developing predictive or statistical models. Data scientists need these write operations to be self-service, which requires write access to databases typically not provided to business people.
Analytical Hub and Sandbox Platforms
The analytical hub platform is the back-end or server-based development environment for data scientists. Whereas the analytical sandbox supports ad-hoc analysis exclusively, the analytical hub supports ad-hoc analysis along with the recurring creation and refinement of models. The hub development environment needs to support the following data management functions:
• Gathering data
• Staging area for extracts
• Model input data
• Data integration
• Physically integrating data
• Virtually integrating data
• Model management
The predictive analytics layer is depicted logically as a separate layer in Figure 15.5, however, it’s necessary to examine important architectural alternatives to determine if that layer should physically be hosted on the hub platform.
There are many architectural choices for hosting processing and storage capabilities. Architectural options exist for:
• Analytical processing
• In-memory business analytics
• Database
These are explained next.
Analytical Processing
The two architectural considerations are:
• BI appliances versus traditional distributed servers—Analytical hubs and sandboxes typically start on traditional distributed servers that IT manages and supports. Enterprises often deploy in this type of environment because it meets initial data and processing needs, and because of their experience with these platforms. Depending on the analytical sophistication and data volumes, a BI platform dedicated to deploying analytical hubs and sandboxes may be the only platform capable of meeting these needs. Many of the advances in servers, storage, database, BI, and data-integration processing have been used in the design of the BI appliances. There is a wide variation in the underlying architectures, and an enterprise needs to evaluate what best fits their need and budget.
• On-premise versus cloud infrastructure—Another architectural consideration is whether all the components of an analytical hub or sandbox should be on the traditional on-premise platform, or if some or all can be moved onto the cloud. Historically, the cloud options have been limited, but that has dramatically changed. Often, cloud components are seen as a cost- and resource-effective solution that speeds up time-to-solution.
In-Memory (or in-Database) Business Analytics
A significant advancement that has enabled more in-depth and speedier analytics has been leveraging the advances in memory of the devices on which BI and predictive analytics are performed, and on the BI appliance if it is part of the architecture. In-memory analytics architectural options include in-memory analytics in the BI tools, as part of the database or on the BI appliance platform.
Database Options
The traditional database deployment option for BI solutions has been relational databases, but there are more options available based on advances in technology and increased data variety. Options include:
• Relational versus columnar versus others
• Structured versus unstructured (particularly Big Data)
• Hybrid mix of above
Predictive Modeling With the Analytical Hub
The purpose of the predictive modeling layer is to provide the analytical engines, such as statistical databases and predictive analytics, for data scientists to develop the forward-looking models, such as predicting customer behavior or fraud detection. This layer may need to support a combination of the following analytical methods:
• Statistical modeling
• Predictive modeling
• Forecasting
• Data mining
• Descriptive modeling
• Econometrics
• Operations research
• Optimization
• Simulation
• Textual analytics
IT retains its traditional role of managing these various analytical engines and associated infrastructure (if on-premise versus a hosted cloud service); however, unlike other enterprise applications, the data scientist owns and manages its content. This change in roles is crucial to success, particularly to time-to-solution.
There can be various architectural alternatives for this layer. Each analytical engine, if more than one is used, will have its own infrastructure requirements, potentially making for a complex environment. Besides being its own physical environment, predictive modeling may be a logical layer that is incorporated into the analytical hub platform or deployed as a set of services in the cloud.
Data Access and Integration with the Hub or Sandbox
Business people typically perform data access and integration by accessing an application (silos) directly, using a data warehouse, or with a combination, where they likely will use spreadsheets as the superglue creating a data shadow system. The analytical hub needs to provide business people with the ability to access, filter, augment, and combine data from many sources and in many varieties from within and outside their enterprise.
With self-service BI, the goal was truly shifting the analytical workload to the business. With data access and integration, however, the goal is not self-service data integration, but rather empowerment. Typically, data integration has emphasized physically integrating the data into a DW or another application. This has proved to be very time-consuming, resulting in significant backlogs and limiting business analytics. In addition, business people have often been granted limited access to nonintegrated data to protect them from potential inconsistencies.
The data access and integration layer needs to empower the business people to get the data they need as quickly as possible, recognizing that getting the best available data, even if not perfect, is better than making a decision with incomplete data or by using a data shadow system.
There are several considerations for the architectural options of this layer:
• Data access—The access options, provided that security and privacy requirements are met, include query sources directly, data services, using local files, and data virtualization. The first three alternatives are all point-to-point access where the data scientist must know about the source, secure access and then navigate the source. Data virtualization (next) is an architectural option that creates a data source catalog that can be saved, shared, and documented for business analysts and augmented by the IT staff.
• Self-service data integration—Today, data scientists rely on IT-built reporting or custom extracts fed by data-integration tools, and then use spreadsheets to fill the gaps. Gathering requirements and designing and building the IT-built extracts severely slows down the time-to-solution. The analytical hub leverages analytics tools, such as data discovery or data virtualization, to enable the business analyst to perform this functionality. In addition, there is a new generation of data integration tools, such as extract, load, and transform (ELT) that are easy enough to use by the data-savvy data scientists. This wave of self-service data integration tools often can work in batch, real-time, and through services, as well as being able to integrate structured, unstructured, and Big Data.
• Augmenting enterprise data sources—Often, critical data to classify, filter, and analyze is not available from enterprise sources but may require an external data feed or an import from another business group. The hub needs to provide the storage and ability to extract that data and then import it into the environment.
• Data virtualization versus ETL data integration—Data integration, data management, and building a consistent, clean and conformed data warehouse will continue to be the responsibility of the IT group. The data-integration capability will expand beyond traditional ETL to include data virtualization.
Data virtualization empowers business people in a couple of ways. First, it enables them to expand the data used in their analysis without requiring that it be physically integrated. Second, they do not have to get IT involved (via business requirements, data modeling, ETL and BI design) every time data needs to be added. This iterative and agile approach supports data discovery more productively for both business and IT.
Data virtualization eliminates the undocumented, overlapping and time-consuming point-to-point direct access connections that business people got stuck doing in the past with their data shadow systems. With data virtualization, IT and business people can add data sources into a repository that will document them, identify relationships between sources and uses, and encourage reuse. To the business analyst, the virtualization repository provides an information catalog to the relevant data needed for their analysis.
Advice for Hubs and Sandboxes
The following advice applies to designing and operating analytical sandboxes and hubs that will enable the analytical elite to conduct their situational analysis quickly and then act on their insights:
• Build for the advanced analytical elites, not the masses—The advanced analytical elite, that is, data scientists and “power” users, are the people who build predictive models and create forward-looking analytics. They are the advanced members of the analytical elite who often have a statistical background and are typically more data-savvy than IT. They do not need IT to create BI solutions for them, but rather create the analytical hub for them to develop the analytical solutions. Trust them. Create the analytical hub. And then get out of their way!
• Create an enterprise information backbone and integration pipeline—Predictive models are data hungry, needing ever-increasing volumes and variety at an ever faster pace. IT needs to continue to manage enterprise applications and extend BI solutions as the trusted enterprise information backbone for all types of business people to use. In addition, IT needs to establish an enterprise information pipeline for data scientists and others who need to go beyond the information backbone.
Embrace data virtualization and a hybrid data view mixing physically and virtually integrated data. Virtualization enables business relationships and metrics to be built into the data view without having to go through the lengthy ETL integration process. In addition, it enables you to include various data types and data sources that should not be physically integrated.
• Do not be afraid to try something new—the technologies and design approaches for advanced analytics, predictive modeling and data integration are continually evolving in terms of capabilities, scale, and total cost of ownership. Also, the vendor landscape has been vibrant with startups bringing new technologies to the market, while mergers and acquisitions consolidate and expand existing product capabilities. To meet the demands of data scientists, analytical hubs need to be designed differently than the standard production BI solution. Do not be afraid to try new database, in-memory, virtualization, and integration technologies from new vendors. Meeting the needs of forward-looking analytics is going to mean thinking “out of the box.”
• Establish separate but complementary business and IT roles—Historically, IT has built the entire analytical solution. When that solution did not have the data that the business needed or could not deliver it quickly enough, the analytical elites were forced to build their own data shadow systems that included BI and data integration.
It is time to turn BI and analytics over to the analytical elites and let IT concentrate on data integration and delivery. The first ingredient for successful self-service BI is an analyst with business knowledge and analytical expertise. The second ingredient is IT that can enable self-service data to feed the analyst.
• Data may be dirty, inconsistent, or incomplete—IT’s charter is to provide cleansed and consistent data, which is the correct goal for the typical BI solution, but data scientists often need raw data that may be be dirty, inconsistent, or incomplete. Data scientists often need to tap dirty data because that is the best that is available at the time for them to develop their model. Much of the behavioral and attitudinal data that is used in models is outside the control of the enterprise and will never be clean.
Trust that data scientists understand how to use both the clean and dirty data. Their modeling techniques takes into account the shortcomings of the data that is available, which is why they often use many sources to improve the accuracy of their models.
Big Data Analytics
When working with Big Data, companies need to understand what it is, how to manage it effectively, and how to get a business return on investment from their investments to leverage it.
Before starting a Big Data analytics project you need to determine the project scope, how to manage the project, what kind of architecture you are going to deploy, and what resources you need.
But, first, because working with Big Data often means working with unstructured data, Table 15.3 provides a reminder of the difference.
Table 15.3
Comparison of Structured versus Unstructured Data
Structured Data
Unstructured Data
Organized
Unorganized, raw
Exists in a structure, e.g., database. Each field is named, relationships are defined
Usually not stored in a relational database or any identifiable structure
Has a structured access method; you can parse it
Requires further parsing before you can use it in modeling
Date, time, sender, and recipient of an email
Body of an email. Also: videos, sound files, articles, tweets, blog posts, etc.
Scope
Big Data projects are often starting off like the first generation of DW, reporting, OLAP, and dashboard projects (i.e., “if we built it they will come”). Whenever a new technology wave is hyped so extensively, there is a tendency for enterprises to buy into that hype and assume that the new technology solves all. The result of this initial wave is often expensive projects failing to meet expectations and setting back efforts to invest in this new technology in the future.
The key to planning a successful Big Data project is to determine the why, where, what, and how of the project.
Why Is the Business Interested in Big Data?
What are the long-term business objectives for implementing Big Data analytics applications? Is it, for example, to track what is trending on social networks? Increase the effectiveness of marketing campaigns? Improve supply chain performance? Knowing the “why” is essential to establishing the business scope and determining the expected ROI for these projects.
Where in the Organization Is Big Data Going to Be Used?
Once you know why you are building a Big Data analytics system, you need to catalog the business processes, applications, and data sources that will be involved. That information is essential to assessing the impact not just from a technology perspective, but also from the standpoint of people, processes, and the corporate culture so you can develop a change management plan upfront. Not doing so can imperil efforts to unlock the business value of Big Data.
What Data and Business Analytics Need to Be Included in Your Big Data Project?
Discussions about Big Data often concentrate on data from social media sites such as Facebook, LinkedIn, and Twitter, but that oversimplifies what an enterprise may need. Big Data also includes Web logs, sensor data, clickstream data, call detail records, XML, audio, video, streaming data, application logs, and much more. Organizations need to determine which of the various types of data that could be captured are wanted for analysis by business people. Answering that question will also help identify applicable Big Data applications designed to handle specific data types.
Do not make the mistake of ignoring non–Big Data needs that should be included in the overall architecture. It is terrific, for example, to use Big Data to determine how well your sales campaigns perform, but even greater business value is derived when an enterprise can determine not only who became customers but also how valuable those prospects were (i.e., how much they bought, the profit margins, whether they were repeat customers, and how much it cost to retain them as customers). Big Data projects have the potential to become Big Data silos if designed solely for implementing Big Data technology for its own sake.
How Big Should It Be?
Once the required data types have been identified, the anticipated data volumes and update frequency―that is, velocity―need to be factored into your planning. Those two characteristics are often coupled with data variety and referred to as the 3 Vs of Big Data. Although rapid updates and significant data volumes are commonly assumed, the reality is that the needs of companies vary widely based on size and the intensity of information usage. Accurately assessing your organization’s requirements will help you determine the architecture and the technology investments needed to effectively capture, manage, and analyze Big Data.
It is tempting to believe that Big Data analytics success is within your grasp provided you buy the right technology and commit enough resources to the project. In reality, a Big Data deployment typically requires significant systems and data integration work; introduces new tools and analytics techniques; and calls for new skills on both the systems management and analytics sides. Trying to boil the ocean will result only in doing too much, too fast—a recipe for frustration and failure.
The Program
Plan to build your organization’s Big Data environment incrementally and iteratively. If you already have a business analytics or BI program then Big Data projects should be incorporated to expand the overall BI strategy. An incremental program is the most cost- and resource-effective approach; it also reduces risks compared with an all-at-once project, and it enables the organization to grow its skills and experience levels and then apply the new capabilities to the next part of the overall project.
Establish an architectural framework early on to help guide the plans for individual elements of a Big Data program. But because the initial Big Data efforts likely will be a learning experience, and because technology is rapidly advancing and business requirements are all but sure to change, the architectural framework will need to be adaptive.
With an overall program plan and architectural blueprint, an enterprise can create a roadmap to incrementally build and deploy Big Data solutions. The roadmap can be used to establish the sequence of projects in respect to technologies, data, and analytics. The individual projects will then be more focused in scope, keeping them as simple and small as practical to introduce new technology and skills.
Hybrid Architecture
Companies initially developed Hadoop, MapReduce, NoSQL databases, and other Big Data technologies so they could store and analyze large amounts of unstructured and semistructured data that wasn’t a good fit for mainstream relational databases. (Google and Yahoo are two examples.) They, along with other early adopters, successfully used open source technologies, and they’re now widely available in commercial versions supported by Big Data software vendors. But a key issue to consider in designing a Big Data architecture is how much of your data analysis needs can be met by Hadoop and its cohorts on their own.
Combining the Big Data (unstructured) with structured transaction data provides the most complete view of your business operations, enabling you to use analytics applications that can yield valuable insights to aid in improving business processes and increasing revenue. This data integration requirement drives the need to create an enterprise-wide architecture that includes both types of data. The architectural options include:
• All data on Big Data platform
• All data on transactional (relational database) platform
• Hybrid architecture tying together both kinds of systems
There are fundamental differences between unstructured and structured data. Relational databases have been used for decades for structured data while Hadoop and NoSQL databases have been built to handle unstructured data. It does not make sense to host both types of data on either of these different platforms, since relational cannot scale to handle unstructured data and there is too much business value lost (and too great a cost) to migrate transactional data to a Big Data database.
The best approach is a hybrid architecture that could also include data marts and specialized analytical data bases, such as columnar systems. Choosing the hybrid option creates a logical infrastructure that leverages existing IT investments in data warehouses and relational databases while enabling organizations to channel data processing and analytics workloads to the most appropriate platforms.
The hybrid data architecture targets Big Data database technologies for unstructured data while leveraging the existing IT investments in relational databases for enterprise applications and DW and BI solutions (Table 15.4). You can implement these platforms on traditional servers, but BI appliances may offer a cost-effective alternative. The appliances can be a mix of hardware and software with varying components such as database technologies (Hadoop, NoSQL, relational, columnar or other), MPP architecture, in-memory BI, or in-memory database analytics. The appliance is quicker to implement, reduces risk, and has an easier learning curve. Another advantage of BI platforms is that although currently Big Data technologies, techniques, and processes are immature, product vendors are helping to rapidly advance these products and provide needed support.
Data integration technologies and products have added significant capabilities to extract data from Big Data environments and enable integration into existing DW and enterprise applications, replacing the previous need for an extensive amount of custom coding.
To produce sustainable business value, Big Data projects must be disciplined. Implementing a hybrid data architecture makes it more likely for Big Data projects to leverage the best practices for data management, data governance, data integration, data cleansing, security, and privacy.
Table 15.4
Recommended Hybrid Data Architecture Components
Big Data platform
Capture, management and analysis of Big Data
Relational databases
Capture and management of transaction processing in enterprise applications
Data warehouse
Store physically integrated data
Data virtualization
Extend DW by virtually integrating data from all platforms
Data integration
ETL and other integration technologies that can gather both structured and unstructured data to be delivered to a DW and BI environments
Business intelligence (BI)
Potential mix of BI technologies that can analyze data across platforms
The Big Data Team
Having people with the right skills and experience to leverage Big Data analytics tools will make all the difference in your project. Knowledge of new or emerging Big Data technologies, such as Hadoop, is often required, especially if a project involves unstructured or semi-structured data. But even in such cases, Hadoop know-how is only a small portion of the overall staffing requirements; you also need skills in areas such as BI, data integration and data warehousing. Business and industry expertise is another must-have for a successful Big Data analytics program, and many organizations also require advanced analytics skills, such as predictive analytics and data mining capabilities.
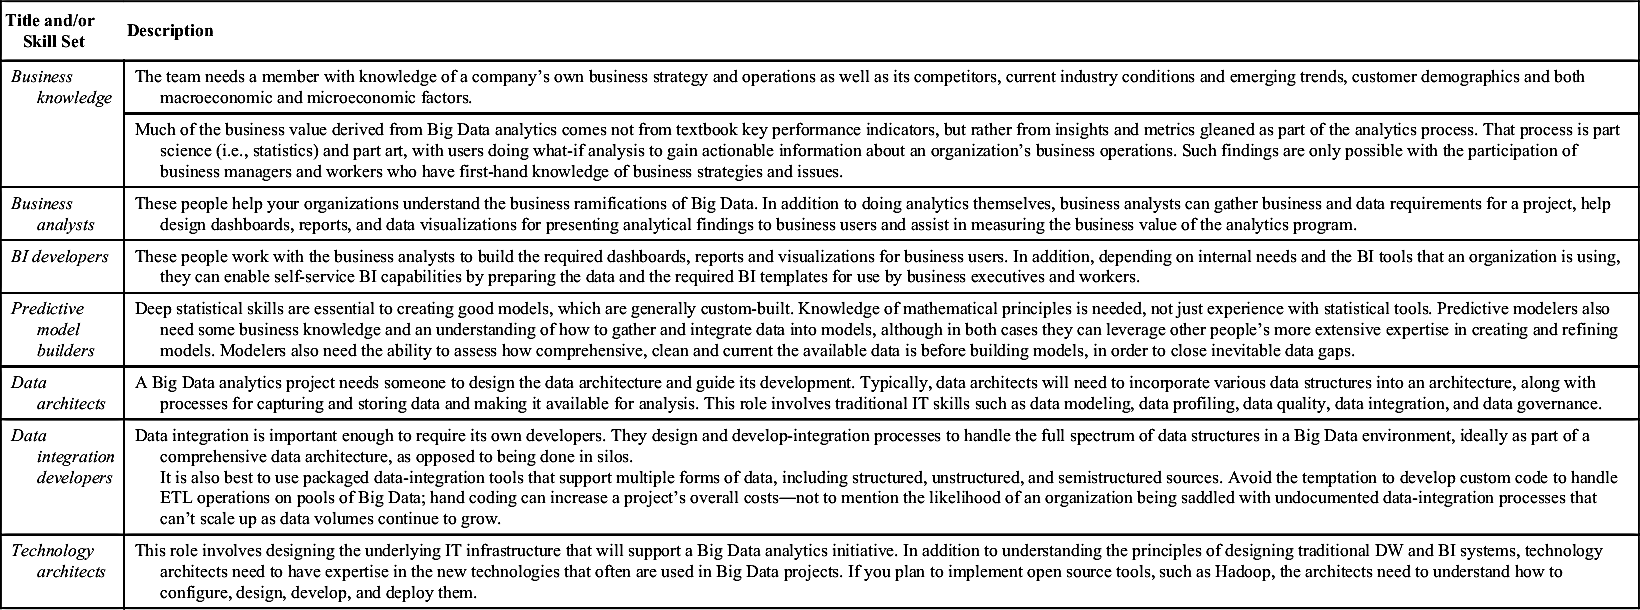
Table 15.5 shows the key skill sets and roles that should be part of Big Data analytics deployments. You can bundle together the required roles and responsibilities in various ways based on the capabilities and experience levels of their existing workforce and new employees that you hire.
It can be exciting to tackle a Big Data analytics project and to acquire new technologies to support the analytics process. But don’t be lulled into thinking that tools alone spell Big Data success. The real key to success is ensuring that your organization has the skills it needs to effectively manage large and varied data sets as well as the analytics that will be used to derive business value from the available data.
Table 15.5
Advanced Analytical Skills
Title and/or Skill Set
Description
Business knowledge
The team needs a member with knowledge of a company’s own business strategy and operations as well as its competitors, current industry conditions and emerging trends, customer demographics and both macroeconomic and microeconomic factors.
Much of the business value derived from Big Data analytics comes not from textbook key performance indicators, but rather from insights and metrics gleaned as part of the analytics process. That process is part science (i.e., statistics) and part art, with users doing what-if analysis to gain actionable information about an organization’s business operations. Such findings are only possible with the participation of business managers and workers who have first-hand knowledge of business strategies and issues.
Business analysts
These people help your organizations understand the business ramifications of Big Data. In addition to doing analytics themselves, business analysts can gather business and data requirements for a project, help design dashboards, reports, and data visualizations for presenting analytical findings to business users and assist in measuring the business value of the analytics program.
BI developers
These people work with the business analysts to build the required dashboards, reports and visualizations for business users. In addition, depending on internal needs and the BI tools that an organization is using, they can enable self-service BI capabilities by preparing the data and the required BI templates for use by business executives and workers.
Predictive model builders
Deep statistical skills are essential to creating good models, which are generally custom-built. Knowledge of mathematical principles is needed, not just experience with statistical tools. Predictive modelers also need some business knowledge and an understanding of how to gather and integrate data into models, although in both cases they can leverage other people’s more extensive expertise in creating and refining models. Modelers also need the ability to assess how comprehensive, clean and current the available data is before building models, in order to close inevitable data gaps.
Data architects
A Big Data analytics project needs someone to design the data architecture and guide its development. Typically, data architects will need to incorporate various data structures into an architecture, along with processes for capturing and storing data and making it available for analysis. This role involves traditional IT skills such as data modeling, data profiling, data quality, data integration, and data governance.
Data integration developers
Data integration is important enough to require its own developers. They design and develop-integration processes to handle the full spectrum of data structures in a Big Data environment, ideally as part of a comprehensive data architecture, as opposed to being done in silos. It is also best to use packaged data-integration tools that support multiple forms of data, including structured, unstructured, and semistructured sources. Avoid the temptation to develop custom code to handle ETL operations on pools of Big Data; hand coding can increase a project’s overall costs―not to mention the likelihood of an organization being saddled with undocumented data-integration processes that can’t scale up as data volumes continue to grow.
Technology architects
This role involves designing the underlying IT infrastructure that will support a Big Data analytics initiative. In addition to understanding the principles of designing traditional DW and BI systems, technology architects need to have expertise in the new technologies that often are used in Big Data projects. If you plan to implement open source tools, such as Hadoop, the architects need to understand how to configure, design, develop, and deploy them.
Big Data Analytics Worst Practices
There are many reasons why Big Data analytics projects fall short of their goals and expectations. You can find lots of advice on Big Data analytics best practices; the following are some worst practices for Big Data analytics programs so you know what to avoid.
• “If we build, it they will come”—Don’t get sold on the technology hype and forget that business value is your first priority; data analysis technology is simply a tool used to generate that value. Determine the business purposes that would be served by the technology in order to establish a business case―and then choose and implement the right analytics tools for the job at hand. Without a solid understanding of business requirements, the danger is that project teams will end up creating a Big Data disk farm that really isn’t useful.
• Assuming that the software will have all the answers—Building an analytics system, especially one involving Big Data, can be complex and resource-intensive. As a result, many organizations hope the software they deploy will be a silver bullet that magically does it all for them. Software does help, sometimes dramatically. But Big Data analytics is only as good as the data being analyzed and the analytical skills of those using the tools.
• Not understanding that you need to think differently—In the case of Big Data, some organizations assume that “big” just means more transactions and large data volumes. It may, but many Big Data analytics initiatives involve unstructured and semistructured information that needs to be managed and analyzed in fundamentally different ways than is the case with the structured data in enterprise applications and data warehouses. As a result, new methods and tools might be required to capture, cleanse, store, integrate, and access at least some of your Big Data.
• Forgetting all the lessons of the past—Sometimes enterprises go to the other extreme and think that everything is different with Big Data and they have to start from scratch. This mistake can be even more fatal to a Big Data analytics project’s success than thinking that nothing is different. Just because the data you’re looking to analyze is structured differently does not mean the fundamental laws of data management have been rewritten.
• Not having the requisite business and analytical expertise—You need more than IT staffers to implement Big Data analytics software. An effective Big Data analytics program has to incorporate extensive business and industry knowledge into both the system design stage and ongoing operations. Don’t underestimate the extent of analytical skills that are needed. If Big Data analysis is only about building reports and dashboards, enterprises likely can leverage their existing BI expertise. However, Big Data analytics typically involves more advanced processes, such as data mining and predictive analytics. That requires analytics professionals with statistical, actuarial, and other sophisticated skills.
• Treating the project like it’s a science experiment—Too often, companies measure the success of Big Data analytics programs merely by the fact that data is being collected and then analyzed. In reality, collecting and analyzing the data is just the beginning. Analytics only produces business value if it is incorporated into business processes, enabling business managers and users to act on the findings to improve organizational performance and results. To be truly effective, an analytics program also needs to include a feedback loop for communicating the success of actions taken as a result of analytical findings, followed by a refinement of the analytical models based on the business results.
• Promising and trying to do too much—Many Big Data analytics projects fall into a big trap: Proponents oversell how fast they can deploy the systems and how significant the business benefits will be. Overpromising and underdelivering is the surest way to get the business to walk away from any technology, and it often sets back the use of the particular technology within an organization for a long time – even if many other enterprises are achieving success. In addition, when you set expectations that the benefits will come easily and quickly, business executives have a tendency to underestimate the required level of involvement and commitment. And when a sufficient resource commitment is not there, the expected benefits usually do not come easily or quickly―and the project is labeled as a failure.
Big Data analytics can produce significant business value for an organization, but it also can go horribly wrong if you are not careful and do not learn from the mistakes made by other companies. Do not be the next poster child for how not to manage a Big Data analytics deployment.
Data Visualization
People are good at recognizing visual patterns and trends but not so good at remembering numbers. Yet even though people think visually, their BI reports and spreadsheets are dominated by a flood of text and numbers. Individual facts tend to be meaningless and need to be used in comparisons to be useful. They take on even more meaning when represented visually.
Pick up any major newspaper (or read it online) and you will see excellent examples of data presented visually. Even a weather map of the country that shades areas based on temperatures speaks volumes more than a chart of temperatures for each major city―and conveys the information in seconds. You will be able to know where it is hot, cold, raining, or snowing at a glance; in a similar fashion, an analyst might be able to spot business trends by looking at well-designed data visualization.
Data visualization presents information pictorially, often graphically, helping communicate it in a more intuitive way. Using data visualization techniques to mix and match data can help your business group view it in new ways and ultimately glean more insights from it. The initial wave of data visualizations for BI has become common and includes basic business graphics such as bar charts, pie charts, and sparklines. More sophisticated visualizations techniques incorporating data relationships and comparisons are increasing being used as a part of advanced analytics to better analyze information.
Why Data Visualization Is Needed
As the volume of data increases rapidly, it becomes harder and harder to turn it into information to analyze. We are data rich, but information poor―overwhelmed by data complexity and volume. As a result, we base business decisions on incomplete, inconsistent, or inaccurate data. In addition, data relationships may be unrecognized or misinterpreted if not properly visualized.
Simply accessing information in the traditional ways can fall short, such as when IT queues are long. Or the methods for getting data can be complex―geared to IT people, not the business people who need to consume the data.
To help enable better access to data, organizations can offer three things: self-service BI, data visualization, and data discovery.
• Self-service BI—leverages business knowledge, allowing you to use an intuitive tool to “mash-up” data, combine it across sources, and collaborate with others. Data is the focus, not the tool.
• Data visualization—lets you compare more diverse data in greater volumes, in greater ranges, and in different views.
• Data discovery—this combines analytics and data visualization to better equip business people to build data models and make predictions. Aimed at business people, it is visually oriented, interactive and iterative, and allows data to be combined and shared.
What Data Visualization Is Not
In recent years, BI vendors have introduced dashboards, which are very visual representations of information. While data visualization tools use dashboards, a dashboard, is not automatically a good example of data visualization. As eye-catching as a dashboard can be, it does not mean that it is communicating information clearly and concisely. While attractive at first glance, dashboards can be cluttered and confusing. This clutter is often the result of the developer not having a foundation in the art of visualization and succumbing to the “techie” impulse to use every feature that a visualization tool offers.
Data visualization is not just flashy visuals; it is effective visuals that enhance our understanding of something.