Data integration combines data from different sources and brings it together to ultimately provide a unified view. If an enterprise has inconsistent data, it is highly likely that it has a data integration problem. The data integration architecture represents the workflow of data from multiple systems of record through a series of transformations used to create consistent, conformed, comprehensive, clean, and current information for business analysis and decision making. This architecture requires a broad set of design, development, and deployment standards. Designing the data integration processes involves creating stage-related conceptual and logical data integration process models and designing stage-related physical data integration process models, stage-related source to target mappings and the overall data integration workflow. Design specifications include conceptual, logical, and physical data integration process models; logical and physical data models for sources and targets; and source to target mappings. A data integration effort needs to accommodate the need to load historical data, and it should include prototyping and testing.
Keywords
Data integration; Data integration architecture; Data integration design; Data integration prototyping; Data integration standards; Data integration testing; Historical data; Inconsistent data
Information in This Chapter:
• Data integration design and development
• Data integration justification
• Data integration architecture
• Prerequisites and requirements for data integration
• Data integration design
• Data integration workflow
• Project and DI development standards
• Reusable components
• Historical data
• Prototyping
• Testing
Getting Started with Data Integration
One of the key deliverables in business intelligence (BI) is providing consistent, comprehensive, clean, conformed, and current information for business people to enable analysis and decision making. Delivering the five C’s is not achieved by BI tools simply accessing disparate data, but rather through data integration. Data integration combines data from different sources and brings it together to ultimately provide a unified view.
Data integration is like an iceberg. BI gets all the attention, just like the part of the iceberg that is visible as it is floating in the ocean. But the vast majority of the iceberg is below the waterline, just as the vast majority of the work in a BI project is in designing and developing data integration processes. As much as three quarters of the BI project’s time is devoted to data integration when new data sources are added to the data architecture.
With so much of the project’s time devoted to this one area, it is critical to adopt best practices to design robust, scalable, and cost-effective data integration processes.
Holistic Approach
BI projects are generally undertaken tactically, independent of other projects. Creating discrete projects that can be scoped and completed is a proven project management approach. However, the danger is that discrete becomes disjointed. Separate projects can either perform redundant tasks or, even worse, contradictory work.
See the book Web site www.BI guidebook.com for requirements and design templates.
Each project looks at its needs and then builds accordingly. Years ago, telecommunication systems—phones, networking, and e–mail—were often purchased and deployed by multiple groups within an enterprise, sometimes in the same building. At some point, people realized these systems should be part of an enterprise backbone that needed an overall architecture and then deployed to support both enterprise-wide and group-specific needs. Without this holistic view, enterprises were generally paying too much in cost, time, and resources deploying overlapping and sometimes incompatible systems.
Likewise, data integration needs to be architected in a holistic manner, enabling an enterprise-wide solution that supports both enterprise and specific business groups’ needs without costly overlaps and inconsistencies. Data integration needs to be architected in a top-down fashion, supporting its information, data, technology, and product components while being implemented in a bottom-up fashion, i.e., project by project.
Incremental and Iterative Approaches
Although it is imperative to take a holistic approach in designing an overall architecture, the potential trap is viewing that architecture as the end goal. The real goal is to transform data into business information, but sometimes technically oriented folks lose sight of that. The architecture is a means to an end, not the end itself.
Data integration processes should be:
• Holistic—avoid costly overlaps and inconsistencies.
• Incremental—more manageable and practical.
• Iterative—discover and learn from each individual project.
• Reusable—ensure consistency.
• Documented—identify data for reuse, and create leverage for future projects.
• Auditable—necessary for government regulations and industry standards.
Building the architecture blueprint and implementing an enterprise data integration solution should be both incremental and iterative.
Incremental: do not attempt to “boil the ocean.” Most enterprises do not have the time, money, or resources to build out an enterprise integration solution in one grandiose project. Instead, incrementally building out the architecture one project at a time allows a more manageable and practical method to achieve the architecture. The individual projects should be viewed as incrementally building the enterprise data integration portfolio. When you have an overall architecture, you can design each tactical project to fill in more pieces of that portfolio in an orchestrated fashion, rather than just hoping it happens by itself.
Iterative: building out the architecture iteratively offers the opportunity to discover and learn from each individual project. Neither the business nor IT will begin with complete knowledge of current or future information needs as you start your integration efforts. The architecture and implemented solutions need to evolve iteratively to incorporate discovery and learning, along with adapting to changing business needs. Thinking that you know everything or being inflexible are traps that will sink your data integration investments.
Productive, Efficient Methods
Data integration is most successful when you use productive, efficient methods. Three of these methods are reuse, document, and make it auditable.
Reuse: reusing data definitions and transformations is not only the most productive method to build an enterprise-wide solution, but also the surest method to ensure consistency. Why reinvent the wheel with every integration project when you can leverage past work and ensure consistency? This seems like a no-brainer, but only if the definitions and transformations from projects are readily available.
Document: documentation enables the identification of data that has been defined before and is a candidate for reuse. This documentation needs to be created and maintained for all data integration projects. It needs to be stored along with data integration application source code. Fortunately, most data integration tools generate application documentation, making your job easier. However you document the project, it should include detailed listings of source and targets and, ideally, graphical visualizations of the data integration workflows. Each project needs to be able to leverage other projects’ learnings, and should make its own shareable as well.
Auditable: with the rise of various government regulations and industry standards, such as Sarbanes-Oxley and Health Insurance Portability and Accountability Act (HIPPA), being able to audit your data integration is not just a “nice to have,” but a business necessity. The audit capabilities to examine data lineage and perform impact analysis provide a better understanding of the data integration processes, improve maintainability, and lowers its total cost of ownership (TCO).
Data Integration Architecture
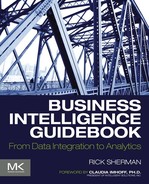
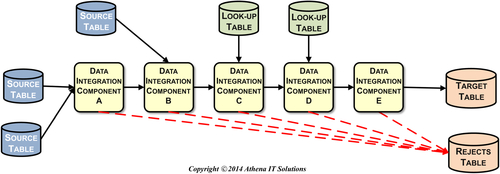
The data integration architecture represents the workflow of data from multiple systems of record (SOR) through a series of transformations used to create consistent, conformed, comprehensive, clean, and current information for business analysis and decision making. Although an enterprise may just start with an enterprise data warehouse (EDW) to enable its BI applications, the data integration architecture needs to be designed to accommodate the workflow. See Figure 11.1, which illustrates the most advanced data architecture discussed in Chapter 6. Each data store in the diagram represents a specific data integration state needed to transform data into information. An enterprise has various alternatives in implementing the data stores; these range from each being an individual database distributed across the enterprise to a single database with each data store representing a schema or collection of tables. The number of tables in this architecture could range from dozens to thousands, depending on the size and complexity of an enterprise’s business.
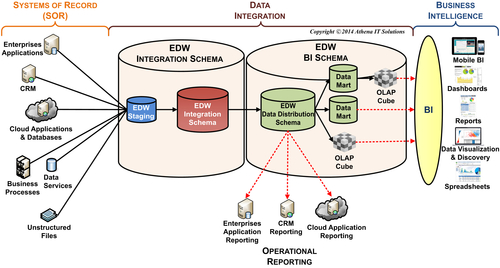
As data advances from the SORs loading successive data stores, each of those transformations, as depicted in Figure 11.2, requires a set of data integration processes. Each breakpoint in the diagram represents an iterative stage in the development of the data integration workflow. Each stage needs the previous stage’s data in order to perform its integration.
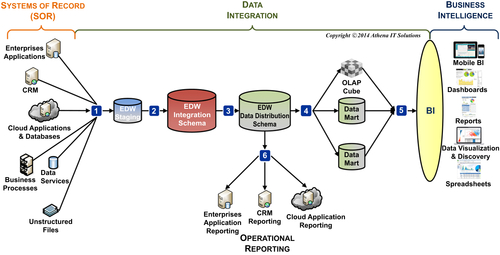
The list of stages in the order of development are depicted in Table 11.1.
FIGURE 11.1DI workflow.
FIGURE 11.2DI workflow integration breakpoints.
Table 11.1
Data Integration Workflow Stages
Stage
Source
Target
DI Phase
1
SOR
Staging
Data preparation
2
Staging
EDW integration schema
Data preparation
3
EDW integration schema
EDW distribution schema
Data distribution
4A
EDW distribution schema
Data mart
Data distribution
4B
EDW distribution schema
OLAP cube
Data distribution
5
Data mart, OLAP cube
BI application
Data distribution
6
EDW distribution schema
Data distribution
Data distribution
As discussed in Chapter 6, the data stores actually implemented in the workflow may vary from the logical design depicted in Figure 11.1. The simplest implementations will contain an enterprise DW and data mart, while the more complex will have all the data stores depicted in the diagram plus many business-specific data marts or cubes. Regardless if these are just two data integration stages or many more, use the same design methodology and principles.
Data Integration Requirements
Designing the data integration architecture with its processes and workflow requires detailed information about all data sources and targets, along with the transformations required to deliver the information five C’s.
Prerequisites
The prerequisite project deliverables needed to design data integration processes are:
• Data architecture
• Data requirements
• Source systems analysis
• Data models for each target data schema
The data architecture, such as Figure 11.2, includes the data stores that the BI team has determined are necessary to support its business requirements. This establishes the framework to design the data integration processes. Data integration designers should examine the data architecture and work with the BI team’s architect(s) to design a data integration workflow.
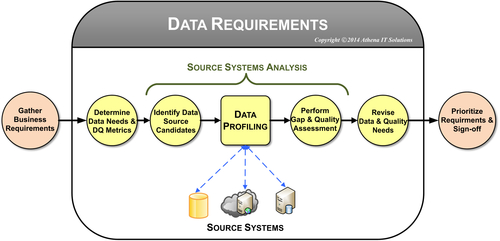
In Chapter 3, we discussed the process to define requirements. The data requirements portion of that process, as depicted in Figure 11.3, includes data profiling used to perform the source systems analysis. This analysis will document the following:
• Data sources such as applications or databases.
• Source systems’ tables and columns (or files in fields).
• Detailed attributes of all these objects.
Chapter 12 reviews the detailed output provided by the data profiling tools that will be used as the source systems analysis deliverable.
FIGURE 11.3Gathering data requirements.
If the data integration designers were involved in gathering the data requirements and performing the source system analysis, then they will have known it was necessary to document that process. If they did not perform these tasks, then they need to review the documents with the people who did. There may be follow-up meetings with source systems’ subject matter experts (SMEs) if more details or clarifications are necessary. In addition, there may be follow-up meetings with the BI team’s business analysts and business people to examine business transformations (business rules, algorithms, and metrics) needed for data marts or online analytical processing (OLAP) cubes in more detail after the data source integration has been designed.
The following table- or file-related metadata needs to be provided for data integration design:
• Table schema: columns names, data types, keys, constraints, range of values, minimum and maximum values (if applicable), if nulls are allowed, percentage of column that are null (if applicable).
• Data load cycle: how often each table will be updated in BI environment.
• Data volumes: total rows and size, load cycle volumes (average, minimum, maximum, and growth rate).
• Historical data: earliest date that data is available, earliest date that data will be extracted into BI environment, list of differences in schema or processing for historical data providing applicable date ranges.
• Transformation logic: transformations applied to data as it is loaded from data sources. Note: this is different from transformations applied to data for analytical purposes when data is moved from EDW to data marts.
• Data dependencies: tables that need to be loaded prior to this table. The dependencies may be related to business rules for business processing or referential integrity constraints.
• Systems dependencies: enterprise systems interactions or prerequisites for data integration processes.
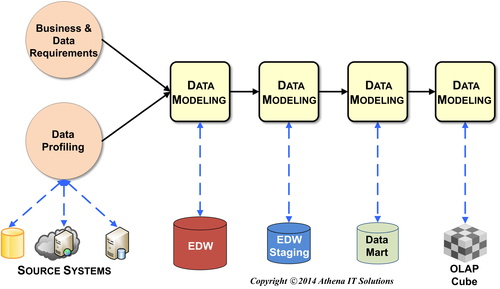
FIGURE 11.4The order of designing data models.
Whereas data profiling provides a detailed schema and structural analysis of the source systems, data models are necessary to describe the target schemas. There is a temptation to begin designing the analytical-related data models, such as the data mart or OLAP cube, rather than the EDW and staging areas since that is what the business people are excited about. However, you should actually design the data models in the reverse order. Designing the data models in the sequence illustrated in Figure 11.4 is a best practice because it ensures all sources are designed and understood prior to designing target schemas, and, as an aside, it creates a project with the best utilization of resources.
The data integration designers and developers need to have design walk-throughs of each of the target data stores’ physical data models with those models’ designers. After designing, developing, and testing data integration processes, it is common for the data integration developers to meet with the data modeler(s) to discuss model revisions based on knowledge gained. Data models are also likely to be revised based on knowledge gained from BI application development and subsequent business user feedback when using the BI applications.
Business Requirements
In addition to taking care of the prerequisites, discuss data integration requirements with the business and obtain agreement. Some of these requirements will be applicable to all data integration processes, while many will be applicable to specific data subjects, tables, or columns.
The data integration business requirements include:
• Data velocity or latency: data velocity or latency refers to how up-to-date the data needs to be in relation to the source systems. Many enterprises have standardized on daily update cycles based on business analytical needs, but there are certainly instances of business analysis for particular industries, companies, or processes that need real time or near real time updates. The latter will require different data transport services than the standard extract, transform and load (ETL) (see Chapter 12) and may require different rules regarding data conformance and standardization. Even when an enterprise needs real time updates, it is not likely to need it universally. Data velocity requirements should be listed to the granularity of data sources and associated tables.
• Tracking changes to data: the dimensional modeling term used to refer to keeping track of changes in data is slowly changing dimensions (SCD). However, since the business people are not going to know what the SCD requirements are, it is probably best to ask if they need to track changes in reference data, including business hierarchies. In addition, the requirement should include whether the business will perform “as is” analysis, “as was” analysis, or both types of analysis. These requirements should be listed by table.
• Historical and archiving requirements: the business needs to determine how far back in time historical data should be stored for business analysis, and at what age data should be archived off-line (but where it could be reloaded for an unanticipated requirement). It is typical for an EDW to have years of historical data available; however, if every data mart does not need all the historical data, you can improve query performance by limiting historical values, such as just to the past two years. When discussing historical data requirements you need to consider two things:
• Do all the source systems have leveled history that is needed and, at some point in time, did the structure of the historical data change?
• Has the data quality deteriorated too significantly for it to be of use?
Historical data requirements are typically in the granularity of either data subject or source system.
• Security and Privacy: with the pervasiveness of data across our business and private lives, sensitivity to privacy and security is ever increasing. With a wide variety of infrastructure, applications, and physical locations in an enterprise, security has always presented challenges to any application, such as a BI environment, whose mission is to provide widespread access to data. And with data integration being the actual engine that gathers, transforms, and delivers data, it needs to be built to comply with whatever security and privacy levels are required of the enterprise. Security and privacy requirements will likely extend to business subject areas, applications, tables, and even columns. The requirements may be role-based or person-specific. The BI team needs to work with any security or privacy group within the enterprise, as well as the data governance program if it exists. It is likely that security will need to be implemented using mechanisms in networks, applications, and databases.
• Regulatory compliance: certainly, industry or government regulations need to be complied with. Multinational corporations will have regulations that vary by geopolitical boundaries. Typically, an enterprise will have a regulatory compliance group with which you need to consult to provide the regulatory requirements. In some companies, the HR group or a single executive performs this function, signing off both on the regulatory requirements to be implemented in the BI environment and its compliance when operating.
• Information delivery to BI applications: key goals of the data integration architecture are to enable the information 5 C’s while lowering enterprise BI TCO, decreasing time to analysis, and increasing productivity. These may be lofty goals, but they are attainable if the enterprise has shifted its many data and business transformations, which are typically coded repetitively (and redundantly and differently) in countless spreadsheets and BI applications, to data integration processes and then loaded them into data marts and OLAP cubes. This “do once and use many times” approach is the cornerstone of this architecture.
To design the processes that load the EDW (data preparation) and the data marts (data franchising), it is essential to separate the data sourcing business rules from those that are used to load business process-specific analytical processes used in data marts.
Data Sourcing System Requirements
In addition to the details about the data source tables and columns, the following system-related requirements need to be agreed upon:
• Extraction strategy for each source system
• How will the data from each source system be accessed?
• Will the data extraction be a push from the data source or a pull from the data integration tool?
• Will the extraction be in the form of a file extract or a data stream?
• Will the source system’s application team create a data extract that will be put into a staging area, or will the data integration team be responsible for the extraction regardless of how it is implemented?
• Systems availability
• At what times during the day is each source system available for extractions?
• Is there a time limit or row count limit for any extraction process from any source system?
• Are there specific times that data updates from specific source systems need to be completed and available to business people?
• Staging areas
• Will all, none, or some of data source extracts use a staging area?
• How will each source system extraction process use a staging area?
• Will staging be persistent, transient, or archived?
• Will the staging area contain file extracts or be relationally based? If relational, will staging tables be identical to source system extractions?
• Will the staging area be used for auditing?
• Database strategies (assuming relational)
• Will indexes be treated when loading data? For example, will they be dropped and rebuilt?
• How will partitioning be used when loading data?
• Will surrogate keys be built using database or ETL functionality?
• Can you assume that referential integrity will be handled by ETL processing rather than database constraints? (Confirm this with the DBAs so they are not surprised.)
Data Integration Design
Data integration design starts at the first stage in Figure 11.2 that gathers data from the SORs and proceeds incrementally until you design the final stages that load the data marts. Each stage can be designed as its prerequisites (data architecture, data requirements, and data models for the sources and targets) become available. In this manner, the design can start before all the prerequisites for the entire architecture are completed. This supports the project approach we discuss in Chapter 18.
The steps involved in designing the data integration processes are to:
• Create a stage-related conceptual data integration process model.
• Create a stage-related logical data integration process model.
• Design a stage-related physical data integration process model.
• Design stage-related source to target mappings.
• Design overall data integration workflow.
The design specifications include:
• Conceptual, logical, and physical data integration process models.
• Logical and physical data models for sources and targets.
• Source to target mappings.
There are two approaches to developing the design deliverables that are listed below.
One approach is to develop the design specifications using process modeling tools and to fill in source to target templates. This approach works well when the data integration processing is complex and a senior designer is preparing the specifications for developers to build.
The other approach is to create the conceptual and logical process models with diagramming software and then develop the remaining specifications (physical process model and source to target mappings) by prototyping the data integration processes. And, of course, then using the data integration tool’s documentation capabilities to create the models and mappings. This approach works well when the same people do design and development, so there is not a hand-off of specifications from designer to developer. Creating documentation will likely be faster than using a process modeling tool when the developers are familiar with the data integration tool. However, the benefit of using prototyping when the developers are new to the tool is that it provides a learning opportunity for them, even if the documentation takes longer. The greatest risk in this approach is that the code will be created, and the developer will not create the supporting documentation. A best practice when using this approach is to have the developer conduct a design walk-through with the appropriate members of the BI team.
Create Stage-Related Conceptual Data Integration Model
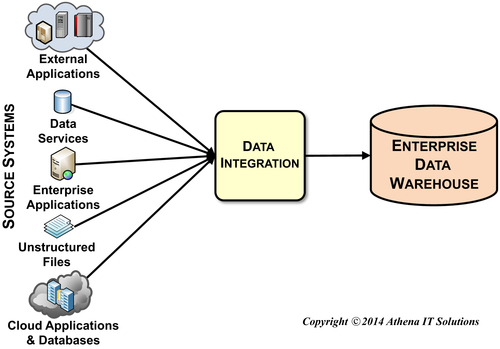
A conceptual data integration process model illustrates the sources and targets for each data integration stage. The model’s granularity is the enterprise applications or databases used as sources or targets. Figure 11.5 provides a generic example. The conceptual model is a visual tool to confirm all the data sources used throughout the data integration workflow; it is also helpful for discussions between the BI team, source system SMEs, and business people.
Because prerequisites to the design stage include identifying source systems and performing data profiling, the conceptual model for the stage that loads the source systems should be fairly straightforward.
FIGURE 11.5Conceptual data integration model—data sourcing.
Create Stage-Related Logical Data Integration Model
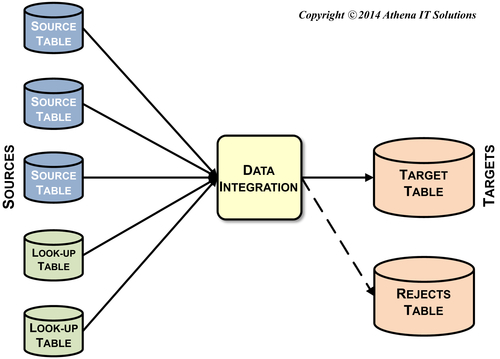
The next step in designing the data integration stage-specific processes is to create a logical model. The logical model, as depicted in Figure 11.6, illustrates the sources and targets at the table or file level of granularity.
Each source and target object illustrated represents a component in the data integration toolkit that gets input data, fetches look-up data, or writes data to an output. Each of these components will be specific to the data store, such as a particular database, file structure (spreadsheet, CSV, XML, etc.), or business application. Sourcing, look-up, and target components typically allow filtering rows and columns, data type conversions, calculations, and custom SQL code or the tool’s own scripting language. The ability of data integration toolkit components to write to targets varies considerably by product. At a minimum, these components will simply write the output data to the targets, but more sophisticated components may provide such functions as truncating the table before loading, creating target tables if they do not exist, or automatically determining which rows should be inserted or updated.
There is a group of data integration components that gathers data from sources, transforms it in some fashion, and then outputs the data to one or more targets. Examples of the functions that these components perform are:
• Join tables.
• Map multiple sources to potentially multiple targets. This function provides expanded join functionality.
• Split table.
FIGURE 11.6Logical data integration modeling.
• Join one or more tables.
• Aggregate tables.
• Update data based on one or more types of SCDs.
• Update data based on prebuilt change data capture (CDC) rules.
It is typical for these components to have one or more “success” paths for data, depending on the type of function being deployed, and to also have a “reject” (or failure) path to direct data that has either not met integration criteria or encounters an error condition. Figure 11.6 is an example of a mapping component with success and reject paths. It is a best practice to always have success and reject paths for each data transformation throughout the data integration workflow.
Create Stage-Related Physical Data Integration Model
The next step in designing the data integration stage-specific processes is to create a physical process model. This model includes:
• All data used in this stage: sources, targets, and look-ups. No data should be used in any data integration component without being accounted for in this model. Even if custom code or SQL is used in this stage, the data that is used in that code needs to be documented.
• The product-specific data integration components used.
• The product-specific workflow with all data and data integration components documented.
Both Figures 11.6 and 11.7 may perform the same data transformations, but because of the differences between product component functionality, the first tool only needs one component, while the other tool requires that you execute a series of components to complete the same task.
One approach to document the physical model is to use a diagram such as Figure 11.7 with the specific tables and data components named (rather than the generic names used in this example), accompanied by a spreadsheet or document explaining the workflow processing details. The other approach is to prototype the physical model and use the data integration tool’s functionality to produce the documentation. With sample data available to develop the prototype, this is an excellent and very productive technique to design and document the physical model.
FIGURE 11.7Data Integration physical model.
Design Stage-Related Source to Target Mappings
An oversimplification in regards to source to target mappings, particularly when loading source systems’ data, is that there is a simple one-to-one mapping between a source table and the target table. Although it is possible to map them one-to-one, it is more common to use multiple source tables because of these typical scenarios:
• A fact table has attribute data spread across multiple source tables, such as a sales order that has separate order header and order line item tables.
• A fact or dimension table has multiple source systems supplying the data, such as when a company has separate order processing systems in different geographies or sales channels.
• A dimension table’s attributes are gathered from multiple source system tables and denormalized, such as when customer-related data is managed in many tables in the source systems.
• A fact table has its foreign keys generated by table look-ups into associated dimension tables.
• A fact table’s measures require calculations using tables other than what was used to get its other attributes.
The source to target mapping must include the target data and all the data used to derive it. The most common documentation tool used is a spreadsheet, but, as previously mentioned, documentation created by the data integration tool from a prototype is an alternative if the prototype represents the complete set of data and components for this stage.
Source to target mappings require the following:
• Target tables.
• Table name.
• Table schema type, such as dimension, fact, or bridge. It is also useful to categorize the type of dimension or fact.
• Table location, such database and schema.
• Column name.
• Column attributes, such as data type, if it is an identity type, if nulls are allowed, and default value and constraints, if applicable.
• List of transformations applied to this column.
• Content SME, who may be a business person or an application expert.
• Target data store SME, who may be a data modeler, an architect, or a business analyst from the BI team.
• Source tables.
• Table name.
• Table location, such as database and schema.
• Column name.
• Column attributes, such as data type, if it is an identity type, if nulls are allowed, and default value and constraints, if applicable.
• Mapping rules applied to this column.
• Relationships or dependencies with other columns.
• SME, who may be a business person or an application expert.
• Source data store SME, who may be a DBA or an application developer.
• Mappings.
• List all mapping connections between source and target columns. This may be as simple as aligning rows in a spreadsheet, but if many-to-many relationships are involved, then diagrams will be needed.
• List all joins, splits, unions, aggregations, or other data integration functions with the columns or variables used to perform these functions.
• List all columns and variables used for data transformations or metrics calculated.
Design Overall Data Integration Workflow
The source to target mappings and data integration process models are the building blocks of the overall data integration architecture. The data integration team needs to design a data integration architecture with a workflow that controls all the data integration processes used throughout the enterprise. The high-level logical view of that workflow is depicted in Figure 11.2, where the completion of each successive data integration stage triggers the start of the next stage. In an enterprise, there are many interactions and dependencies across source systems and tables within the data architecture that influence the design of the data integration architecture; this often creates the need for multiple workflows handling different segments of the enterprise’s data.
There are two things to watch for with these workflows:
• First, you have to synchronize source systems across an enterprise. (If the source systems are large or diverse, however, this task may not be possible until later.) For this synchronization, you will need to design data integration workflows to not only perform the data integration processes, but also to do so in a sequence dependent on the source systems availability and interactions. The EDW will be updated at different times of the day based on the schedules of the different workflows.
• Second, the dependencies in the dimensional model between different table types for related data may also necessitate the design of multiple workflows. For related data, such as accounting or marketing data, load the dimensional table types in the following order: subdimensions, dimensions, and facts. Each data subject may be handled in an independent workflow if there are no data dependencies.
Data Integration Standards
One of the key drivers to developing a cost- and resource-effective data integration architecture is creating and using a broad set of design, development, and deployment standards. These standards include principles, procedures, use cases, templates, and reusable code that is applied to specific combinations of data, data integration processes, and requirements.
Although a business case can easily be made for these standards, we should address the “elephant in the room,” which is that most BI teams are so pressed for time that standards always seem like a “nice-to-have” that they will get to later. This lack of urgency is understandable, because the business people who drive the requirements and the budget do not have data integration standards anywhere on their list of priorities or even on their radar.
For Standards, Adopt a Software Development Mindset
Before I got into consulting, I worked in software engineering for a company that sold software, and then I joined a Fortune 100 company’s IT group. I was very surprised by the differences in attitudes regarding software development and standards when I moved into IT. In the software firm, design, development, and deployment standards were necessities, not “nice-to-haves.” In fact, they were given the same priority as coding.
How is creating an application in a software company so different from an application in an IT department? First, the software product is sold and installed in many companies, but the BI application is built and installed in one company. The software product has, if successful, many versions and releases that may be supported simultaneously, but the BI application has one version supported in one company. A company may have BI users spread across many business units, subsidiaries, and geographies, but it can still keep them all on a single production version of its application.
Second, the software product has formal documentation and training for both technical and business people. You cannot sell a product without them. Although BI applications may have a limited set of documentation and training, it certainly is not as extensive or thorough as what a software company would have.
Third, software firms have people dedicated to building, maintaining, supporting, and selling their products. IT not only creates and maintains BI applications, but it is responsible for many other applications and technologies. Software firms judge their developers by what they produce, while IT staff are judged by how fast they respond to “fire drills” and how much they cost.
Finally, the software we created at the software firm was the firm’s product— its asset. For the Fortune 100 company where I worked in IT, the software was an application used to measure company performance; it was not what the company sold to produce revenue. With this background in mind, it is easier to understand why the software applications in these two cases were treated quite differently. The software company’s product created revenue, and the BI application created costs (disregarding ROI).
In order to be a viable product in the marketplace, the software product needed to have release management, version control, business and technical documentation, programming standards, and adherence to industry standards to work in diverse environments. The BI project, on the other hand, did not need those standards and procedures, or the staff felt that their users did not want to pay for it.
Why do BI applications take so long to modify and maintain? Why are they full of nasty surprises? The short answer is that IT does not adhere to standards during their creation and maintenance. Sure, you can cut corners by not following standards and still create the report that the business people want; however, the IT group will pay for it in the long run with higher IT costs and a whopping loss in responsiveness when they struggle to rediscover the application every time they touch it.
Enforcing standards for building and maintaining BI applications from the start delivers long-term benefits. It takes an investment to implement the standards retroactively; it’s always more expensive to retrofit your applications, but the ROI justifies it.
Development Project Standards
Regardless of whether you are creating a software product, a data warehouse, or a BI application, basic standards are needed to manage the development project and its application. The following key standards apply to the entire project:
Use and enforce source code and version controls: you cannot fix a bug if you cannot find the correct version of the source code or reproduce the problem. Software firms use source code control (software is their asset) but IT groups tend to be much more lax. Lack of code control slows application development and enhancement, and makes it much more costly to maintain. BI applications should be managed like valuable company assets. In more than two decades in the IT industry, I have noticed that it is it uncommon for IT groups to implement and enforce code management controls for the entire application, including data models, data integration code (both tool-generated and manually built), BI applications, and the custom SQL code used for all aspects of the project.
Document your business requirements: document all the business and technical requirements, and keep track as you change the application. The documentation can be used for change management, as well as the business and technical documentation. This used to be a very tedious task with documents that were put into folders no one ever looked at but that has changed. With cloud and mobile collaborative applications that support all aspects of the application development lifecycle (from design to support), all BI stakeholders are able to access and contribute to the requirements, along with providing feedback throughout the project. Regardless of whether the BI team is following a waterfall, agile, or hybrid methodology, these collaborative applications enable business interaction and validation.
Document your application: this is the corollary to source code and version control, as documentation needs to be created and saved whenever a new version of the application is released. This documentation includes BI applications, data integration code, and data models. If the development team is using BI, data integration, and data modeling tools, then they can use those tools to generate the documentation. Manually created code also needs to be documented, and the development team needs to understand that creating that documentation is part of the time and cost of doing it manually. Even with tools, there are still details that need to be created by the development team, such as documenting the code with comments and descriptions. In addition, the data fields accessed by the application need to have data definitions in both business and technical terms; BI, ETL, and database tools make it easy. Document all of your data—database schema, file layouts, reference data—along with the corresponding code.
Develop and implement testing plans: test code with sample data not only in the individual units, but also in the complete application. Allow business people to test the analytical and reporting functionality with samples of real data. If possible, test with full data volumes. Test the ETL functionality with actual data from each of the source systems that will feed the data warehouse or data marts. Too often, the development team is surprised when they learn at the end of the project that the source systems had dirty data. Source systems always contain dirty data; your ETL code must be able to handle it somehow. Before the system goes into production, IT and the business need to agree on how to handle dirty data: pass it on, flag it, suspend it, or delete it.
Document how to use your application: document the use and operation of your application from both the technical and business perspectives. The IT staff may not need to develop the formal user guides, installation notes, and tutorials of a software product, but they should create a simple application guide. Too often, I see application developers trying to figure out which disks and directories contain their programs, scripts, log files, and data. This should all be documented for easy maintenance.
Naming conventions: boring, yes, but absolutely necessary. Consistency should be the driving principle for creating the naming conventions, rather than elegance. It is not worth the time to be elegant or overthink them. Just create the standards and move on. Of course, the team needs to enforce their use. Naming standards apply to data schema, data integration code, and BI applications.
Deliverable reviews: these include technical reviews within the BI team on data models and applications or stakeholder reviews on requirements, testing, user feedback, and project status. Although meetings with people in the same room is optimal, you can also use collaboration tools that enable presentations, remote application access, desktop displays, and interactive document development, along with audio and video conferencing. With all of these choices, there is no excuse to not getting the appropriate stakeholders involved.
Data Integration Reusable Components
“Write once, use many times” is the driving principle for designing and deploying a common set of reusable data integration components. The benefits are consistency and productivity.
The data integration team should examine the data architecture and data integration processes to determine how to break up the processes into a common set of reusable data integration components. Processes that are candidates to be split and used as components are:
• Change data capture (CDC)
• Each of the applicable SCD types
• Error handling
• Auditing
• Fact table processing
• Dimension table processing
• Hierarchy handling
• Special purpose dimensions processing
• Data quality processes
• Building aggregations
The most effective components are loosely coupled and highly cohesive. Loose coupling means the components are modular with little to no dependencies on other components. This type of modularity makes it easier to maintain, test, execute in parallel, and recover. Highly cohesive components focus on performing specific tasks and interact well with other components.
There are several sources for a common set of reusable data integration components:
• A data integration product’s prebuilt components.
• DI team custom-designed components.
• DI team-designed templates used to develop components.
• DI team agreed-upon guidelines used to develop components.
The best scenario is when the data integration product being used has prebuilt components that perform well-defined processes matching your enterprise’s needs. These components will be documented, known by developers who have experience with a product, and maintained by the product vendor.
If prebuilt product components are not available, then the development team needs to determine whether it is better to build custom-designed components, design templates for designing components, or agree on a set of guidelines for designing components. These options are presented in the order of declining productivity gains. The choice of which path to follow depends on the flexibility of the data integration product being used and the software engineering skills of the data integration team.
The pragmatic approach to DI reusable components is to agree on the components that are needed, and then develop them on an as-needed basis, rather than developing them all up front. It is highly likely that the components that the enterprise will actually need and how they will function will evolve over time. The best way to determine this is by getting the components in use as soon as possible.
Data Integration Development Standards
The following is a minimum set of standards that should be agreed upon for the design, development, and execution of data integration processes:
• Assume all dimension tables have surrogate keys that function as their primary keys.
• Decide whether fact tables will use surrogate keys as their primary key. The convention in dimensional modeling is to use the set of foreign keys that, when combined in a multipart key, guarantees uniqueness. If there is not a set of foreign keys that will guarantee uniqueness, you must generate the surrogate key as the primary key. Another reason for using a surrogate key as the primary key is when it is the enterprise database standard to do so.
• Decide if surrogate keys are built using a database function, such as an identity data type, or if they will be generated by a data integration component.
• Decide what data type will be used for surrogate keys. The assumption is that this is typically an integer, but if the table in which it is being used will eventually have more than two billion rows, then another data type will be needed to handle that number of rows.
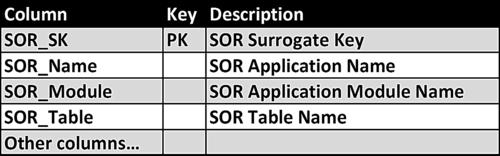
• Implement a SOR dimension listing the SORs used in data integration processes, as depicted in Figure 11.8 and explained in Chapter 10.
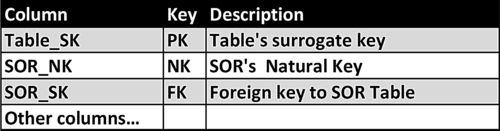
• Retain the primary key from the SOR as a natural key in the BI data store tables and point a foreign key to the SOR dimension if more than one SOR is used to populate the tables, as depicted in Figure 11.9.
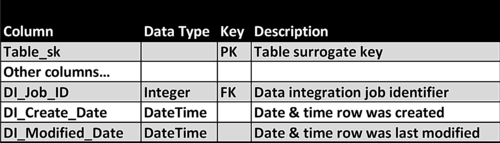
• Add three columns to each table’s schema for operational and audit purposes, as depicted in Figure 11.10. DI_Job_ID uniquely identifies a data integration processing job and, possibly, is a processing ID generated by the data integration tool that can be linked to the processing metadata. The remaining columns track the time a row was created and last time it was modified.
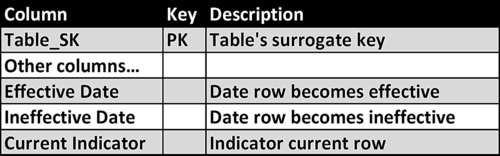
• Ensure that each dimension that supports an SCD type that tracks changes to rows has three columns to determine the time period the row applies to, as depicted in Figure 11.11. There is a date pair that has the effective and ineffective dates (date range row applies), as well as a current indicator.
FIGURE 11.8Systems of record (SOR) dimension.
FIGURE 11.9Natural key standard.
FIGURE 11.10Audit column standard.
FIGURE 11.11Slowly changing dimensions effective date standard.
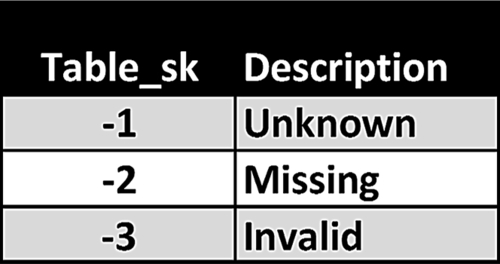
FIGURE 11.12Dimension table with rows indicating null values.
• Assume foreign keys cannot be null.
• Determine the default value used if a foreign key is null when being loaded from a source system. A typical value is a negative number, such as −1, since the surrogate keys are positive integers. The row in the dimension table with the null value indicator should have a description such as “unknown.” There are cases where there may be more than one business condition that results in a null value in the foreign key, such as unknown, missing, or invalid. In those cases, the dimension table would have multiple rows replacing nulls with negative key values and descriptions as depicted in Figure 11.12.
• Determine the SCD type to use for each dimension table and use the appropriate reusable component.
• Determine the SCD type to use when updating an accumulating snapshot table and use the appropriate reusable component.
• Determine how each type of hierarchy will be managed and use the appropriate reusable component.
• Identify each error use case, determine how to process that error, and use the appropriate reusable component.
• Determine how to handle late-arriving dimensions or facts and use the appropriate reusable component.
Loading Historical Data
Data integration design efforts focus on the current state of the enterprise in developing ongoing, incremental processes; however, there may be a need to load historical data in a different manner or to perform historical data conversions. Loading historical data is similar to data migration projects in that it must be repeatable, auditable, and documented, but it does not need the same operational processes as ongoing, incremental processes.
Same as the Old
If an SOR has remained consistent over time from a schema and business processing perspective, then the ongoing, incremental data integration processes that are being designed can be applied to all the historical data in that SOR. These conditions occur when, for example, an enterprise recently migrated to a new ERP system, or when the business group adopted an application to support their business processes and now want to bring that data into the enterprise BI environment.
Under these circumstances, loading data from the SOR begins with the oldest data and progresses until it gets to the current data. Depending on the volume of data, particularly with fact tables, the development team may process the data in incremental batches rather than all at one time. The team may also leverage alternative methods to speed up processing, such as:
• Dropping indexes during the load and rebuilding them afterwards.
• Using database partitions to load specific date ranges of data.
• Using bulk loading of data.
• Using file extracts from the SOR and then presorting the data prior to the data load.
If there have been no changes to the schema or business processing rules in the SOR, then one set of data integration processes will handle both historical and ongoing, incremental data updates.
Typically, these processes assume that only data that has been inserted or updated since the last load cycle will be processed. This is based on the assumption that all loads process correctly; that data feeds from source systems, including those from external vendors, partners, or suppliers never have to be reprocessed (maybe due to their errors); that there is no need to load historical data since it has already been processed; and that no source systems that have historical data will be added to the BI environment in the future. It is a best practice to plan for one or more of these assumptions to be violated.
Design the ongoing, incremental processes to load data based on a range of dates. In the first and most common case, the beginning date of the data to be loaded is the last successful data load time, and the ending date is the time and current load. This use case is identical to a typical ongoing, incremental process.
In the second use case, the beginning and ending dates of the data to be loaded are passed as a set of parameters to the data integration processes. If data in target tables involved can be updated from multiple source systems, then add an SOR identifier from the SOR dimension as an additional parameter. The data in the target tables that represent inserts or updates that have been previously processed for the beginning and ending dates needs to be “backed out” from these tables. The processing for fact tables is straightforward, as the rows in those tables that are within the date range should be deleted. Dimension tables are more complicated than fact tables because of their SCD update processing. Dimension table rows that are within the beginning and ending date needed be deleted just as with fact tables; however, an additional step is necessary to adjust effective and ineffective dates on the remaining rows. The adjustments are necessary to ensure that there are no gaps between the effective and ineffective dates throughout the table.
After adjusting the rows that fall within the beginning and ending dates, process the inserts and updates. Fact table processing is straightforward, as rows are simply inserted as they normally are. Inserting or updating dimension table rows within beginning and ending dates of this load will require adjustments to any existing rows that overlap their effective and ineffective dates.
Historical Data is Different or Dirty
When the SOR schema or business rules have changed in the past or when historical data has data quality problems, then you need to create a historical data integration process that operates independently from the ongoing, incremental process. Although there may be a set of data integration components that are shared across both processes, historical processing is different enough to warrant the split. Under these circumstances, historical data processing should be considered equal to the data migration project.
Schema or business rule changes are the result of business or technology events that occurred in the past. Business events may have been triggered by a merger or acquisition, adding new lines of products or services, adding new sales channels, adding new regulations, or expanding into new geopolitical areas. Technology events are typically related to the replacing, upgrading, or adding of enterprise applications. Besides these major events, the farther back in the past that source data exists, the more likely that numerous small changes have been made to the schema or business rules that, when viewed in total, have created significant changes. A big risk with loading historical data is that small changes are often not documented or have been forgotten, thereby surprising the development team. You can significantly reduce the risk, however, if you perform data profiling, as previously recommended.
The following steps are needed:
• Assess historical data conversions: once the development team has determined if and when changes have occurred in historical data, they need to assess what is needed to convert the historical data and migrate it to existing schemas. This assessment needs to be not only what needs to be done, but also how long it will take, what resources will be involved, and the estimated cost.
• Obtain business sign off on historical data conversion: although the business has requested this historical data, the business sponsors need to examine the impact of the historical conversion on the project timeline, costs, and functionality. Based on this impact, the business may decide to convert all the historical data or alter its requirements and only convert a portion of the historical data. And for the portion of the historical data that is not converted, the business choices are to completely ignore that data or to migrate it unchanged into operational data store (ODS) tables that are available for stand-alone historical data analysis.
If historical data conversions or migrations are required make the appropriate adjustments to the project timeline and costs.
• Design and develop historical data conversions: this follows the standard design and development steps for data integration. Map the historical data sources to their respective target by time frame, design the data integration workflows, and then build and test the data integration processes.
• Load converted historical data: although many refer to this as a one-time process, the reality, just like in the data migration project, is that it will likely take multiple attempts at loading the data before it meets acceptance criteria. Each time the data is loaded, you will need to analyze it to determine if there are any gaps between its quality and the acceptance criteria. If the data is not acceptable, you will need to make the revisions in the data integration processes and then reload the data. This cycle continues until the data meets its acceptance criteria. Until the historical data meets this criteria, it should be loaded into tables separate from the existing current data tables. This enables the loading, testing, and reloading to occur without impacting current processes. When historical data conversion has reached acceptance levels, then it can be loaded with current data.
Data Integration Prototyping
In Chapter 18 we recommend an iterative and incremental project methodology that uses a more traditional waterfall approach to design the overall BI framework and architecture while blending an agile approach to develop the architecture’s components. Data integration is a perfect example of designing the architecture and overall workflow using the traditional approach and then developing data integration components using an agile approach (specifically prototyping).
Although the initial requirements for data integration components can be defined, the final design is typically developed through a discovery process. It is not until the component works with the actual source data that you discover the nuances of that data and its interaction with other data. You need to validate and change data in business rules during the development process. Prototyping is a best practice approach toward enabling this discovery process.
The prototyping tasks include:
• Defining the scope of the prototype: determine the source and target data, along with the transformation logic involved.
• Establish the prototyping environment: ensure that the development environment, data integration tools, and sample data are available for prototyping.
• Create a data integration component prototype: develop the component by mapping source to target data with transformation logic.
• Perform tests: execute the prototype and examine results. If changes are required, then revise and reload.
• Review results: validate results with a SME, who may be a business person or an application developer.
• Revise as necessary: if the prototype does not pass SME validation, then revise and repeat the prototype.
• Prototype signoff: SME validates and signs off on results.
Data Integration Testing
Data integration testing is another set of tasks that should be performed iteratively and incrementally, as advocated in the project methodology that is discussed in Chapter 18. Testing complements prototyping in the requirements discovery process by identifying differences in source system data and business rules.
Test each data integration component to ensure it gathered source data completely and correctly, then proceed to transforming that data and loading it into its targets. The initial sourcing of data from the SOR will need to perform specific checks to validate correctness. The first check will be that the extracted rows match the SOR. Often, row counts and checksums are used as verification. The second check will involve verifying the results of any filters and transformations on those extracted rows. The filters and transformations may result in the source and target rows not matching from a row count and checksums perspective. Testing this process must verify that any differences that exist are the result of the correct processing of those filters and transformations.
The following types of testing need to be performed:
• Unit testing: this involves testing each data integration component to validate that it performs properly.
• Integration testing: this involves testing a workflow with its individual components to validate that they work together cohesively and correctly.
• User acceptance testing: this involves business people validating the data by analyzing it within the various BI applications, such as dashboards and reports that they have access to.
• System testing and performance testing: this involves testing the entire data integration workflow, gathering data from all data sources, and loading into all their target tables. This test not only involves validating data, but also examining the performance of the data integration processes, databases, and BI applications.
A testing plan listing test cases with acceptance success criteria needs to be developed, documented, and signed off by the appropriate responsible party. Each component should have the ability to handle both success and reject rows. After the tests have been conducted, the results need to be documented and reviewed. These results should include processing metadata, such as the time for the components to complete and any inflow or outflow of data through these components.