The technology categories that support business intelligence (BI) and data integration are technology platforms, enterprise applications, and data management. BI appliances usually combine hardware and software into one offering, although some are software only. The BI technology architecture is made up of four layers, as follows. (1) BI and analytics (analyzing information) includes reporting, ad hoc analysis, dashboards, online analytical processing (OLAP), spreadsheets, predictive analytics, performance management, data discovery, data visualization, Big Data analytics, BI search, mobile BI and cloud BI. (2) Information access and data integration (gathering, integrating, and transforming data into information) spans the sources, integration applications, integration services, data access application programming interfaces (APIs) and BI targets. (3) Data warehousing, which uses databases or files to store integrated data that is then be consumed by BI and analytics, generally uses relational databases for structured and semistructured data, and alternative databases for unstructured data. Alternatives include OLAP, columnar, in-database analytics, in-memory analytics, and massively parallel processing (MPP). (4) Data sources capture data for use in the enterprise. With Big Data, enterprises are experiencing rising data volumes, variety, and velocity. Thorough product and technology evaluations are essential.
Keywords
BI analytics; BI appliance; Big Data; BI targets; BI technology; columnar; data access API; In-database analytics; information access; in-memory analytics; integration services; massively parallel processing (MPP); OLAP; relational database
Information in This Chapter:
• Evolution of technology and products
• BI and analytics
• Information access and data integration
• Relational databases and alternatives
• Big Data
• BI appliances
• Product and technology evaluations
Where are the Product and Vendor Names?
The quick answer is, you won’t find them here. A key objective of this book is to be product and vendor agnostic. In fact, I have strived to not mention any business intelligence (BI), data integration, or database product or vendor in this book. It was not easy! It would have been so much easier to use their names.
But the BI world moves fast. There are mergers and acquisitions every month, therefore any discussion that mentions product and company names can be quickly rendered out of date. The concepts of BI, however, have a much longer shelf life. So, this book discusses concepts and how to apply them regardless of the specific product you choose. There are plenty of books, online tutorials, and web videos to help you learn about a product and, quite frankly, this book could not be long enough to teach you how to do all things BI in all products.
Most of my previous articles and blogs have been vendor neutral. Generally, to be fair, one should either mention no vendors or mention all of them. This is where the book’s companion website, www.biguidebook.com and my blog www.datadoghouse.com become useful.
• Positioning of products and vendors in the BI architecture
• Links to independent research reviews and articles
• Technology-related updates
• Descriptions of most effective technology use cases
• Discussions of best practices
The blog www.datadoghouse.com will continue to offer a mix of posts that are neutral and those that name products and vendors. I will also continue to write about mergers and acquisitions in the industry.
You can keep track of updates by following the blog’s RSS feed or subscribing to the e-mail list on www.biguidebook.com.
Evolution Not Revolution
BI’s history spans several decades. Enterprises developed data warehouses using relational databases to support management reporting in the late 1980s, long before anyone called them data warehouses (DWs). As the years progressed, the industry created terminology to describe the existing technologies: business intelligence, data marts, and dimensional models. Over the last decade, BI has been one of the top, if not the top information technology (IT) initiative, according to various industry analyst surveys of chief information officers (CIOs). Regardless of economic conditions, BI has continued to grow faster than the overall IT spending, as enterprises across industries view BI as a strategic requirement to operate and grow.
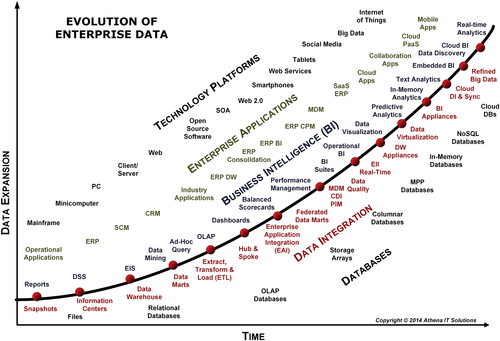
BI is mature in many respects, but it is a significant mistake to equate this maturity with being stodgy or stagnant. BI is a market that has experienced sustaining innovation throughout its history, as depicted in Figure 7.1. Each wave of innovation has unleashed the power of increased analytical capabilities, and is then soon followed by even greater demands for more data and greater insights.
The diagram illustrates the innovation of several technology categories. The technology categories that have supported BI and data integration are:
• Technology platforms
• Enterprise applications
• Databases
FIGURE 7.1Evolution of enterprise data.
Enterprises’ data and analytical needs have driven the advances in these technology areas; in turn, the advances in these technology areas has affected the evolution of BI and data integration. To understand BI and its future, one needs to briefly examine the evolution of these related technology areas.
Technology Platforms
The evolution of the technology platforms depicted in Figure 7.1 has given rise to the data deluge that enterprises are dealing with. As Chapter 1 explained, the ever-increasing data volumes, variety, and velocity are the result of this evolution.
In the early days of data warehousing, the mainframe was the primary computing platform with minicomputers, PCs, and client/server computing emerging to expand the implementation options available to IT. Enterprise networking expanded, supporting client/server computing and a proliferation of servers and PCs.
It is hard to imagine that data warehousing preceded the dot-com bubble and the now ubiquitous Web by more than a decade. As the Web expanded into commerce, technology trends such as service-oriented architecture (SOA) and Web services expanded the capabilities of both BI and data integration. With exposure to the Web industry, open source software (OSS) became a viable option for IT with OSS databases, extract, transform and load (ETL) and BI emerging.
With over one billion smartphones and tablets sold in 2013, it is easy to overlook the fact that the first iPhone was introduced in 2007. Since that time, smartphones, tablets, and a wide variety of mobile devices have become a new source of data for enterprises to analyze.
With the Web and mobile devices, social media exploded onto the scene, creating new data exceeding the amount of data that enterprises had previously been capturing and analyzing. And the challenge isn’t just the amount of data; it’s the type. This data is unstructured, very different from the structured data that everyone was accustomed to working with. This then led to the creation of Big Data platforms and tools.
With the expansion of these technology platforms, businesses and consumers are expanding the use of networked devices that monitor, measure, and transmit data related to all types of human and machine activities. This has been labeled the Internet of Things (IoT) and is the latest technology platform evolution that will significantly impact data.
Although BI’s original technology platforms are drastically different today, people still need to monitor, measure, analyze, and act on that data. There are people who would label some of the changes in technology platforms as revolutionary, but the reality is that, at least from the BI context, each new extension fed the sustaining innovation in that field.
BI’s demand and supply have been significantly impacted by the technology platform changes. This does not discount that the changes to our lives and businesses may have been disruptive innovation (or revolution), but that is different from what BI experienced.
On the demand side, we face a data deluge that does not seem to be abating any time soon. Fortunately, the supply side has experienced a significant expansion in technology capabilities in CPUs, networking, memory, storage, and other infrastructure components.
Enterprise Applications
When data warehousing began, enterprises were using applications (often custom built) that were narrowly focused on supporting specific business functions. At that time, DWs were typically updated monthly to align with the accounting cycle. The data came exclusively from internal sources.
Beginning in the 1990s and accelerated by the Y2K scare, the enterprise resource planning (ERP) market significantly altered enterprises’ internal systems, as they replaced almost all of the legacy function-oriented applications. Vendors promised that ERP systems would be one-stop shops for all the applications managing enterprise systems, hence all the data as well.
After the initial migration wave, ERP vendors introduced additional applications such as customer relationship management (CRM), supply chain management (SCM), corporate performance management (CPM) and master data management (MDM) over the next decade or so. This significantly increased the amount of data that enterprises generated and needed to report on.
The hype proclaiming the ERP application to be a one-stop shop for an enterprise proved illusionary. First, with significant merger and acquisition activity, many of the ERP applications were collections of acquired modules that were not tightly integrated. Second, ERP applications were implemented as modules serving specific functions, much like their predecessors, thereby fragmenting data and workflows. Finally, much of the innovation and new functionality came from startup or smaller enterprise application firms, meaning the large ERP vendors were not the one-stop shop.
ERP vendors offer reporting capabilities bundled with their applications for operational purposes. It is fairly typical for the ERP-bundled operational reporting to be less robust than what standalone BI tools provide. After more than a decade of this situation, the largest ERP vendors acquired the largest independent BI vendors and bundled their tools with the ERP applications. The ERP vendors continue to sell these BI products as standalone products. Many of the smaller ERP vendors have shifted from building homegrown reporting capabilities and partnered with standalone BI vendors to provide operational BI.
Another significant trend that permeated the ERP application market occurred when the vendors started offering prebuilt data warehouses, operational data stores (ODS), or data marts to the customers. Prior to that trend, ERP vendors had fought the need for data warehousing but came to recognize that their ERP data was not structured for analytics, and the customers had many sources of data beyond their ERP applications. The ERP vendors’ prebuilt DWs have proved to be fairly effective at supporting operational BI for the application-centric data, but most enterprises have built DWs that are customized to their enterprise’s data, metrics, and analytical needs.
Data Management
From a technology perspective, the ERP applications built with relational databases swept away the legacy systems, which had used network databases, hierarchical databases, and file-based systems. This was the beginning of the relational era, which, after two decades, continues to thrive, expand, and adapt.
During the initial ERP migration wave, the knock on relational databases (from the competing database technologies) was that they could not handle the transaction activity that many enterprises experienced. Relational vendors responded with innovations that cemented their databases as the bedrock for transactional processing across enterprises of all sizes. There have been many database challengers to relational databases in the analytics space over the years, including online analytical processing (OLAP) cubes, columnar databases, massively parallel processing (MPP) databases, in-memory databases, and BI appliances (covered further in this chapter). Relational database vendors have responded with sustained innovations built to enhance their products’ BI and analytics capabilities. Indexing, partitioning, optimization, in-database analytics, and in-memory databases are just some of the enhancements that have been made into relational technology. The top relational vendors are high-tech titans who respond to innovative competitors by either copying the technologies—I am not implying intellectual property (IP) infringement—or acquiring the products with their vendors. The relational databases of today are significantly different from what I first started using decades ago; they will likely change as the future unfolds.
A cornerstone of using relational databases for BI has been the adoption of dimensional modeling. This, as we discuss in Chapter 10, enables business relationships and rules to be represented in the database schemas that BI and analytical tools query. Many of the data integration design principles that are covered in Chapter 13 also rely on dimensional schemas. With BI and data integration tools leveraging dimensional modeling and relational databases in a symbiotic relationship, there have been continual improvements in the effectiveness and ROI of BI applications.
During BI’s history, there has been a steady improvement in infrastructure, networks, and CPU power, but the two most significant breakthroughs in this area for BI have been (1) the arrival of storage arrays and (2) significant expansion of available memory for computing with the adoption of 64-bit operating systems. These innovations, and many that followed, address the two key historical constraints on BI implementations: disk I/O and memory limitations. These capabilities have become so pervasive that enterprises of all sizes can leverage faster I/O and memory in querying or loading data.
One area where relational database technology has not been able to adapt, nor will it, is to capture and manage unstructured data, i.e., Big Data (covered further in this chapter). Although some relational database vendors have expanded their offerings by including NoSQL technology, this is a coexistence strategy recognizing that relational databases will not adequately handle unstructured data.
Also, although this book discusses how relational database technology has innovated to keep up with OLAP cubes, columnar databases, MPP databases, in-memory databases, and BI appliances, it does not mean that relational databases are the only alternative to use in BI; quite the contrary, we discuss some of these alternatives to relational technology later in this chapter.
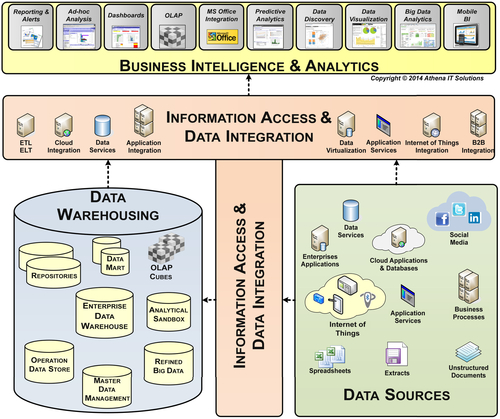
Technology Architecture
There are four technology layers, as depicted in Figure 7.2 that form the BI technology architecture:
• Business intelligence and analytics: the tools that a person or process uses to analyze information.
• Information access and data integration: the tools used to gather, integrate and transform data into information, and then make it accessible.
• Data warehousing: any database or file that is used to store integrated data that would then be consumed by BI and analytics.
• Data sources: any data source that captures data that will be used by an enterprise.
There are several key differences between the conventional view of BI technologies and what is shown in Figure 7.2. The conventional wisdom regarding BI is much too narrow, and has led not only to data silos but also to analytic, integration, and application silos resulting in higher costs, low productivity, inconsistent information, and smaller returns on investment (ROI). The key differences from conventional wisdom are:
FIGURE 7.2Technology architecture.
• Information access and data integration: Rather than the conventional view that narrowly defines data integration to be batch-driven ETL processes, the recommended technology architecture in the figure includes all tools used to query, gather, integrate, cleanse, and transform data into information that is delivered to a person, a process, or database.
• Data warehousing: The conventional view portrays the enterprise data warehouse (EDW) at the center of BI efforts along with data marts and OLAP cubes being loaded from the EDW. The recommended expanded technology architecture encompasses all databases where data has been transformed for analytics from other sources or integrated from multiple data sources. Collectively, this data represents an enterprise’s logical data warehouse (LDW), creating the data foundation for its analytics platform. Based on its requirements and capabilities, the enterprise would decide to implement its LDW as a tightly integrated or a loosely federated platform.
In addition to the EDW, data marts and OLAP cubes, the LDW may include:
•Analytical sandboxes
•Refined Big Data (unstructured data that has been reduced or refined)
•MDM
•ODS
•Repositories, which include those used to store metadata for BI, analytics, data integration, and data virtualization
• Data sources: Conventional wisdom has always been that data should be stored only once to support both data capture and information consumption, whether it is a relational database, NoSQL database, or something else. The recommended technology architecture, however, recognizes that there are times when information consumption is limited to querying directly from the data capture database, but for those other times, integrating and transforming data into information is required. When integration occurs, the recommended technology architecture assumes the data is moved into a data warehousing environment. This does not mean that data capture and information consumption cannot use the same database technologies, but that they need to be structured and stored differently.
Business Intelligence and Analytics
An enterprise’s business community will have a very diverse set of analytical needs and work styles. The type of analysis they perform will vary based on the depth, subject, volume, and structure of the data used, as well as the business processes: examining salespeople’s performance, providing customer support, predicting customer behavior, etc. Business people will also approach analysis differently based on their background and experience. In Chapter 13, we describe those different approaches to analysis as the following BI personas: casual consumers, analysts, power users, and data scientists. The BI personas are helpful when designing BI applications and selecting BI tools.
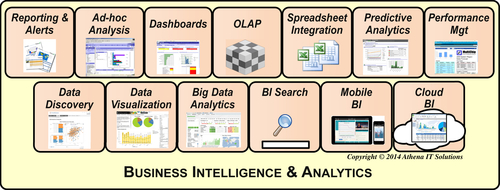
Although BI tools have been around for a couple of decades, the depth, breadth, and variety of BI capabilities and styles continue to expand and change. The BI marketplace has responded to the diverse set of BI personas, application needs, and type of analysis that a business person will perform by creating a variety of BI analytical styles, as depicted in Figure 7.3.
FIGURE 7.3BI analytical styles.
Previously, dashboards and scorecards were the rage versus the typical reporting tools at that time; these tools were followed by OLAP and ad-hoc query tools. BI options now include data discovery, data visualization, in-memory analytics, predictive modeling, BI appliances, and Big Data analytics. Below, we describe the most common BI styles.
Reporting and alerts: This is the traditional and most pervasive BI style in an enterprise. Reports have a preset format, sometimes requiring pixel-perfect design if delivered to customers, and are used by a variety of enterprise stakeholders. There are several delivery options:
• Static reports pushed to users via e-mail: These reports may be “burst” with each user’s report only containing the data pertinent to them.
• Parameter-driven reports run on-demand by user to filter and sort data.
• Drill-down capabilities, although not historically a reporting capability, are often available when users are interactively using the report.
• Alerts, sent via email or other messaging, signaling specific events or data values.
Ad hoc analysis: Rather than presenting data in a prebuilt report, ad hoc analysis presents the data to the users, who then create their own custom reports with queries and data they select. This is a report builder geared to the business person, and was the precursor to OLAP analysis and data discovery. Typically, the business person using this BI style is a power user.
Dashboards and scorecards: These styles are a mashup of other BI styles presented on a single page or screen. Originally used to provide executives with an at-a-glance view of corporate performance metrics or balanced scorecards, dashboards have expanded to display other BI styles in their panels and to support people at all levels of the enterprise. Typical characteristics include:
• Two to six panels on the page with combinations of data charts, tabular grids, or other data visualizations
• The first dashboard a user sees displays summarized information and exceptions, and then the user drills down into details in other dashboards that are linked through a drill path.
• May be updated periodically using a time-based schedule, triggered by an event, or run on-demand by a user.
OLAP analysis: This is a more structured approach providing a form of ad hoc reporting, in which users can select various combinations of dimensions and measures for their analysis. The following terms are often used to describe the query capabilities:
• Drill-down: drilling down a dimensional hierarchy to get more details
• Drill-across: querying across multiple dimensions
• Slice and dice: use drill-down and drill-across capability
This style was named after the type of data it queried from, which historically was a multidimensional (or OLAP) cube. An OLAP cube is no longer a requirement, because relational, columnar, and in-memory structures are now used to support this type of analysis. A pivot table in a spreadsheet is an example of this BI style, and it is why many business users are very comfortable using it.
Spreadsheet integration: This BI style enables spreadsheets to use the data derived from BI queries, so that the spreadsheet becomes the user interface (UI). In the early days of BI, many BI vendors considered spreadsheets competition, there was no integration, and business people simply cut and pasted data from their BI application display into a spreadsheet. Since that time, based on business demand, most BI tools offer integration with spreadsheets.
Predictive analytics: This is more of a BI analytical process. It is a distinct BI style that combines statistical analysis, data visualizations, and either ad hoc query or data discovery. This is discussed in Chapter 15. Data scientists use predictive analytics to create predictive models or forecasts. These models are then used by other business people in their business analysis and may be built into processes such as credit scoring and fraud detection. This falls in the category of advanced analytics.
Data discovery: Although some may view this BI style as a disruptive innovation (compared to conventional BI), this style is really an evolution from using OLAP analysis (without the cube) to select data and a mashup of data visualizations and dashboards to present the data. This BI style follows the tradition of the latest BI generation being easier than the last from a business user perspective. The key difference from other BI styles is the visual self-service UI to select data; however, the analytical presentation itself does not deviate from the BI styles it mashes up.
Big Data analytics: This is narrowly focused to the exclusive BI analytical style offered, which is textual analytics. This type of analytics searches for patterns in unstructured data that meet query criteria by the business person. This item is not about an all-inclusive Big Data analytics platform, nor is it about a variety of BI analytical styles which that platform may support.
BI search: This BI style has been the Holy Grail of many business users. They wonder why they cannot simply type a few words in a Web browser and the search engine returns a list of useful results, Searches of unstructured data use Big Data or text analysis as the BI capability. Structured data, however, becomes a problem in this situation. Whereas the textual search compares what you typed with lots of text out on the Web, it is indeed looking for matches based on keywords and linguistic knowledge. Structured data, however, is different. First, structured data is stored as columns of numbers and text; all you see are column names, not a human language. Second, and more important, how does the BI search engine know what one business person means by the word “profit” versus another business person? One of the key reasons BI takes so much hard work is precisely because the business terms that a person would use are imprecise or inconsistent.
Mobile BI: This is more about where business people perform their analysis—a smartphone or a tablet—than it is about a particular type of analytics. A smartphone, even the largest one sold, has too small a UI to provide rich graphics or detailed tabular data, but instead is perfect for receiving alerts about exceptions and events. A tablet, on the other hand, provides a rich graphical platform capable of displaying data visualizations and tabular data. Consider that the business person may not always be connected to a network to access or update the data.
Cloud BI: This is more about the back end of how the BI tool operates than it is what analytics it delivers on the front end. The only caveat is that the first generation of a product vendor’s cloud application typically offers the business person less functionality than a comparable on-premise tool. Based on experience with other application categories, however, cloud BI will likely become on par with on-premise offerings as the product vendors upgrade it.
Information Access and Data Integration
The conventional view of a BI environment is that an ETL tool loads a DW by integrating data from many source systems, and then a business person uses a BI tool to query the DW to perform analysis. That view is correct, but it does not tell the full story of what should or could be happening in the BI architecture. This oversimplified view creates misperceptions that constrain how enterprises approach BI and integration projects. It causes them to create integration and data silos due to overlapping integration projects. It raises the enterprise’s overall costs and reduces the effectiveness of both BI and integration. The misperceptions caused by this oversimplified view are:
• A business person is always the BI consumer
• BI and analytics applications merely query data
• BI tool is always the destination of data in the BI architecture
• Data integration is always an ETL batch process
• BI is the only enterprise project that needs data integration
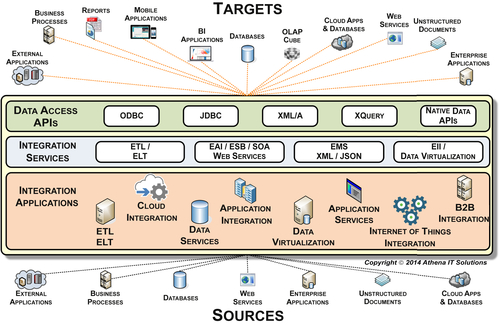
A more comprehensive view of a BI technology architecture is depicted in Figure 7.4. This architecture breaks from the conventional view in many ways.
FIGURE 7.4BI’s information access & data integration layer.
BI Targets
A business person using a BI tool is a typical BI consumer or delivery target just as the conventional wisdom portrays. However, business processes and applications are increasingly important BI targets, particularly as BI expands into internal operations and interacts with external enterprise stakeholders. BI may be embedded into business processes or used to communicate with business applications, both of which potentially trigger actions based on its data. In Figure 7.4, nonpeople BI targets include external applications, business processes, cloud applications and databases, Web services, unstructured documents, enterprise applications, OLAP cubes, and databases.
Data Access APIs
Many data access Application Programming Interfaces (APIs) are used in information access and data integration. The most common protocols include:
• Open Database Connectivity (ODBC): standard middleware API used to access databases. ODBC was developed to be database and operating system independent, replacing database-specific APIs.
• Java Database Connectivity (JDBC): data access API used by Java programming languages.
• XML for Analysis (XML/A): industry standards for accessing analytical data sources such as OLAP and data mining. It is based on industry-standard Extensible Markup Language (XML), SOAP, and HTTP. It can execute several query languages such as Multidimensional eXpressions (MDX), SQL, Data Analysis eXpressions (DAX), and Data Mining eXtensions (DMX).
• XQuery: query language used to extract and transform data from XML data sources and Simple Object Access Protocol (SOAP) and Representational State Transfer (REST) web services. There is a variety of structured and unstructured data sources that can be viewed as XML.
• Native database or data APIs: these APIs access specific data or database sources whose providers may feel these APIs provide better functionality than industry standard APIs, or that they cannot conform to those standards.
Integration Services
There are two reasons that there should be a variety of integration services much more expansive than the conventional view. First, although BI and analytics applications always query data, they may also need to integrate and transform data to complete a business analysis. The integration may take place at the beginning of, or during the business analysis process. Under these circumstances, data access APIs will not be sufficient to complete the analysis. Second, when BI was limited to accessing integrated data from internal enterprise applications, batch-driven ETL was typically sufficient. However, with data sources spanning a wide variety of locations, protocols, data types, security, and currency, there is a need for a variety of integration services.
The types of integration services in a BI architecture include:
• Enterprise application integration (EAI) including enterprise service bus (ESB), service oriented architecture (SOA), and Web (or data) services. EAI is a group of integration approaches to provide interoperability between the multiple disparate systems. One of the key characteristics of the EAI approach is a loose coupling of integration tasks rather than using point-to-point integration tasks; this results in more flexibility and reliability. The earliest versions of EAI used a broker-based architecture, but that approach was very costly and complex, and there was a high project failure rate. EAI applications have evolved to the bus-based architecture or ESB, which is the most common approach used in application integration. ESBs are scalable, distributable, expandable, and support SOA. For BI, this provides an application-centric integration capability rather than the database-centric approach used with ETL. There are many use cases, often real-time, where sources such as business processes, B2B integration, cloud applications, and IoT should be integrated using data services. In addition, if an enterprise is using an ESB application, then leveraging the technology and skills will accelerate integration efforts.
• Enterprise message services (EMS) including XML and JavaScript Object Notation (JSON). Although similar to an ESB, the EMS focuses solely on providing messaging between disparate applications using structured formats such as XML and JSON. EMS is a very quick and scalable approach to interapplication communication. The message queue sometimes becomes a bottleneck, with the result that EMS is often used in conjunction with an ESB implementation. For BI, EMS offers a lightweight integration service that can very effectively provide real-time data updates from disparate data sources.
• Enterprise information integration (EII) including data virtualization and data federation. The earliest generations of EII applications enabled access to an enterprise’s disparate data sources and presented a unified view of that data to its users, but only provided limited integration. This flavor of EII was called data federation, as it loosely coupled the sources together. Supported by advances in access (data and network) standards and memory capabilities, EII has significantly evolved its access and integration capabilities. EII, or data virtualization as it is now called, provides both data abstraction and data services layers to a wide variety of data sources: structured, semistructured, and unstructured. The BI use cases include:
• Create a logical data warehouse, virtually integrating EDW and other data stores used for BI and analytics.
• Virtually integrate Big Data, cloud application or MDM application with EDW.
• Create virtual BI data stores to supplement DW.
• Create or supplement virtual data marts or operational data stores.
• Enable self-service BI by providing business people with a virtual data catalog that can access and integrate BI data stores and operational data sources.
• ETL and extract, load & transform (ELT): This is the primary data integration tool used in BI and data warehousing. As the name implies, the data from source systems is extracted, transformed from raw data into the information 5Cs (although typically the data undergo multiple transformation processes), and loaded into the target database. Historically, ETL was run in batch on a periodic basis, often nightly, with all the data integration processes taking place at that time. The nightly load would source all data and then iteratively load the staging area, DW, data marts, and OLAP cubes. Nowadays, much of the ETL processing is still run in batch, but the periods have gotten more frequent with many enterprises running ETL process every few minutes to provide near real-time data updates. The book discusses data integration processes and their workflow in Chapter 11.
Data Integration Suites
Many ETL products have evolved into data integration suites with a portfolio of integration services: ETL, ELT, EAI, ESB, EMS, EII and other data integration services. In addition, many of these suites include other services such as data cleansing, data profiling, and MDM. Unfortunately, many people still think of these data integration suites as just ETL tools, and use them only as batch-driven ETL tools. Underutilizing (or worse, misusing) the data integration suites lowers developer productivity, increases data integration costs, lengthens project time, and lessens the amount of information with the 5Cs available to business people.
This raises the issue of whether an enterprise should use one data integration suite to perform all of the integration services discussed above, or use separate products for each integration service. This is the classic software suite versus best-of-breed scenario; however, some of the data integration suites offer one integration service that is best-of-breed. Typically, buying a suite lowers the total cost of ownership (TCO), leverages skill sets across services, and avoids the creation of integration and data silos. An enterprise’s decision, however, needs to be based on its business and technical needs, and generalities may not apply to its situation. Undertake a product evaluation (as discussed later in this chapter) if new types of integration services need to be used in the enterprise.
Many enterprises have already invested in different products to implement each of the integration services discussed. Enterprises that implement a significant number of integration services with different products and have expertise in those products will most likely continue using them. In this scenario, the recommendation is to perform an integration assessment to position each integration service within an overall architecture and determine, based on use cases, when a particular integration service should be used. This will result in a more cost- and resource-effective architecture that better addresses the information integration needs of the enterprise. The integration services assessment tasks are:
• Examine and prioritize the enterprise’s integration needs.
• Create a vendor-neutral integration architecture based on needs.
• Take an inventory of the products and integration services currently being used in the enterprise.
• Position existing products and integration services within the integration architecture.
• Identify any overlaps or misuse of products and make appropriate adjustments in their use.
• Identify any gaps.
• Conduct a product evaluation to select what will be used to fill those gaps.
An enterprise that needs multiple integration services and is using different integration products should implement a data integration center of excellence (DI COE). We discuss this topic in Chapter 19.
Integration Applications
We have looked at things from the viewpoint of a technology architect. Now we switch to that of an application developer. An enterprise may need to deploy one or more of the following integration applications in its BI architecture:
• ETL or ELT
• Cloud integration
• Data services
• Application integration
• Data virtualization
• Application services
• IoT integration
• B2B integration
ETL versus ELT
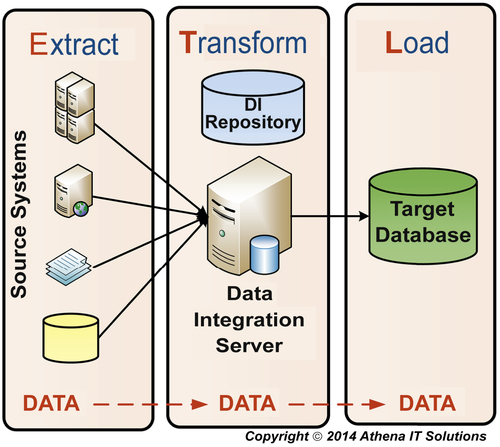
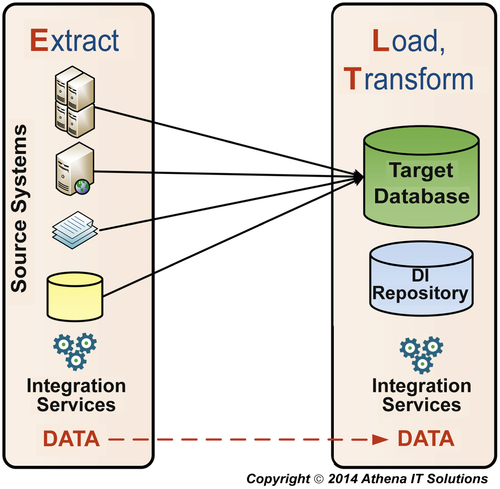
The same data integration processes are performed using either ETL or ELT products, but the differences are in the where, when, and how they are performed. The classic ETL architecture is depicted in Figure 7.5, while the ELT architecture is depicted in Figure 7.6.
The initial generation of ETL products comprised code generators that created COBOL or C code with a graphical interface, and then deployed it on source and target servers. These tools helped improve developer productivity and code reusability, but did not offer any specialized data integration functionality.
FIGURE 7.5ETL architecture.
FIGURE 7.6ELT architecture.
The next generation of ETL products, as depicted in Figure 7.5, introduced the data integration server dedicated to performing the transform or integration services. Vendors improved this generation of ETL products with innovations such as increased integration capabilities built into the data integration server. Many of the innovations in processing data, such as parallel processing, originated in these products and were later implemented in database management systems (DBMSs). ETL products using this architecture were chosen as a best practice for data integration. The data integration products at the top of the industry analyst charts for more than a decade have used this architecture as they have evolved into the data integration suites (discussed above).
As the advanced integration capabilities were adopted by DBMSs, an opportunity arose that spawned the ELT architecture. ELT, as depicted in Figure 7.6, does not have a dedicated data integration server, but instead runs integration services on either the source or target database servers, leveraging their integration capabilities. ELT is a more lightweight architecture than ETL because it does not require a dedicated data integration server. It also has a lower TCO because it does not require the specialized database and data integration server expertise that is required of an ETL product.
Although ELT products have a cost advantage, ETL products typically have the advantage of greater integration capabilities and better performance. The key criteria for product selection should be established according to which data integration product and architecture are the best fit for an enterprise, rather than which product has the most features or the best performance. The trade-off is between capabilities and performance versus cost and complexity. The enterprise should perform a product selection to make that determination.
Data Integration Expanding from BI
With the emergence of the more powerful suites, data integration has moved beyond BI to include other integration initiatives in an enterprise, such as:
• Data migration
• Application consolidation
• Operational and real-time BI
• MDM, customer data integration (CDI), and product information management (PIM)
Enterprises often undertake data migration or application consolidation projects because of mergers and acquisitions, or because they need to streamline applications. In the past, these projects were seen as one-offs and typically hand coded. As systems integrators (SIs) became proficient in ETL tools from BI projects, they realized that they would be much more productive in data migrations and application consolidation projects if they used these same data integration tools. Even though the projects were one-offs, data integration tools enabled the SIs to reuse code, leverage prebuilt transformations, better manage processes, and produce documentation without laborious manual effort. In addition, they did not have to deploy a cadre of coding gurus, but could leverage the data integration developers they already employed.
Several market forces have converged to produce the perfect storm, enabling operational or real-time BI with the same data integration and BI tools as used in DW projects. These forces include enterprise applications built on relational databases and data integration tools no longer bound to batch ETL constraints. In addition, with the major enterprise application vendors also bundling data integration and BI tools, this convergence is leading to more consistent, comprehensive, and current information (business benefit) with the same data integration and BI infrastructure (IT benefit).
MDM, CDI, and PIM all deal with conforming and maintaining master data or reference data for data subjects, such as customers and products. The initial wave of technology solutions bundled a set of tools and applications that were business process-specific or industry-specific. What got lost in many of the initial implementations was that these applications relied heavily on data integration, and that it made sense to leverage a company’s existing data integration platform to create MDM, CDI, and PIM solutions.
Databases
For decades, enterprises have been storing increasing amounts of data captured in their ERP, CRM, SCM, and other applications used to manage operations and interface with stakeholders such as customers, suppliers, partners, and investors. This data predominantly represents the transactions and events that occur within an enterprise and among its stakeholders. External data, such as customer demographic and economic data, captured by other entities is used to supplement the data captured by an enterprise. A key characteristic of most of this data is that it is structured and its integrity needs to be guaranteed.
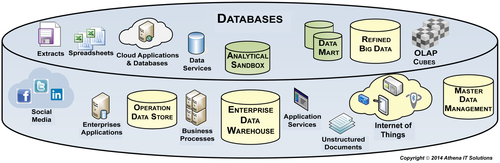
In today’s environment, much of the data being gathered by enterprises is unstructured, and that can be a game changer. Yesterday’s enterprise, with its transactional systems and relational databases, was well poised to collect and store structured data such as sales figures, prices, and addresses. But today’s enterprise is gathering more unstructured data from sources such as e-mails, social media, patient records, and legal documents. Also, the IoT with networked devices monitoring, measuring, and transmitting data about all sorts of things may exponentially expand the pool of data being generated yet again. Figure 7.7 depicts a sample of some of the data that an enterprise may use for data capture and analytics.
With the data spanning structured, unstructured, and semistructured formats, enterprises need to examine what technologies and products they will use to capture and analyze that data. Today there is a wide variety of database and file system technologies available for these purposes. It is a lot more complicated now; it is no longer strictly selecting the right database or file system and operating it on a general-purpose server and storage devices. Now, there are many more choices with a variety of combinations of hardware and software configured to handle data capture or analytics.
When examining database choices to be used in the BI technology architecture, base the selection on analytical rather than data capture capabilities. Even when the same database technology is used for both data capture and analytics, analytical data (depicted as data warehousing in Figure 7.2) is stored separately from the data capture (depicted as data sources). Real-time queries and operational BI will take place on the data capture database while analytical BI accesses the analytical data that has been integrated and transformed from the data capture databases. (Refer to Chapter 6 for more details on the concept of using the same database for data capture and analytics, and the sections on data modeling explaining the different schemas that data capture and analytics use.)
FIGURE 7.7Technology architecture - databases.
Relational
We are in the relational database era, with IT using it as the database engine for the majority of data capture and analytical operations. With a significant installed base that works well, and an extensive body of skilled resources and BI tools built with relational in mind, these databases continue to dominate with structured and potentially semistructured data.
There were many relational database vendors in the 1990s, but since the dot-com bubble, the top three relational vendors, who are high-tech titans, broke out of the pack and have dominated market share. Open-source databases are being used in many Web-related applications, but are not significant players in the BI market even though they have sufficient capabilities to handle many BI workloads. Open source may be constrained because IT staffs favor a particular relational database vendor, and they do not see the business value in migrating to another product.
Since the top-tier relational vendors are high-tech titans, they have the resources to continually invest in sustaining innovation and acquiring other vendors with technology to enhance their product. The relational vendors continue to improve workload management, query and load processing, parallelization, and systems administration. In addition, they have been able to leverage advances in infrastructure such as CPUs, memory, network bandwidth, and storage.
As part of their sustaining innovation efforts, relational vendors also use other technologies such as BI appliances, in-memory analytics, in-memory databases, and MPP in various combinations with their relational databases to better support their customers.
Relational Alternatives for BI
There are various technologies that are used as an alternative to relational databases. These can also be combined with relational databases or each other to better support enterprise BI.
Online Analytical Processing
This technology was developed to provide query and analysis of data in a multidimensional schema. Initially, OLAP applications were nonrelational, and created physical multidimensional databases called cubes. Later on, some OLAP applications allowed the data to be stored in a relational database and created a logical multidimensional schema using a metadata layer. The person creating the schema would assign which tables were facts and dimensions, define hierarchies and drill-paths, create calculated measures, and specify aggregations. Eventually there would be three types of OLAP:
• Relational OLAP (ROLAP): data stored in relational with logical schema.
• Hybrid OLAP (HOLAP): mixture of ROLAP for detailed data and MOLAP for aggregations.
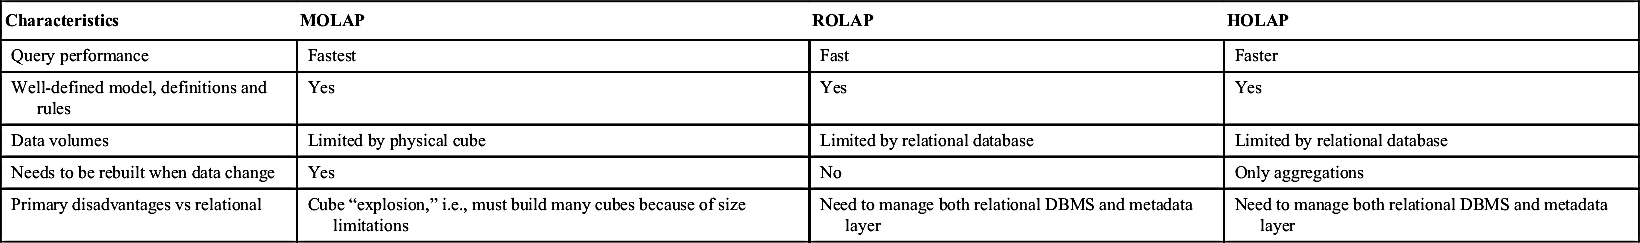
OLAP applications are widely used, in BI especially, by business power users. Since a spreadsheet pivot table visually represents a multidimensional schema, it is easily understood by business people who are quite comfortable using it. Besides OLAP UIs and spreadsheets, many other styles of BI, such as data discovery, have adopted the multidimensional or pivot table UI when providing self-service BI capabilities. Table 7.1 compares and contrasts each type of OLAP with each of the other types and with relational database systems. All three types have proven to be popular with business people, and various vendors have chosen to offer a particular type.
The MDX language is a specialized language to query and manipulate multidimensional data. Although it was not introduced as an open standard, it has been widely adopted in the industry. Later, XMLA, based on industry standards such as XML, SOAP, and HTTP, was created as an industry standard for accessing analytical applications, such as OLAP and data mining. With XMLA referencing the MDX query language, MDX became a standard and widely used. MDX is the multidimensional equivalent of SQL.
Table 7.1
OLAP Comparisons
Characteristics
MOLAP
ROLAP
HOLAP
Query performance
Fastest
Fast
Faster
Well-defined model, definitions and rules
Yes
Yes
Yes
Data volumes
Limited by physical cube
Limited by relational database
Limited by relational database
Needs to be rebuilt when data change
Yes
No
Only aggregations
Primary disadvantages vs relational
Cube “explosion,” i.e., must build many cubes because of size limitations
Need to manage both relational DBMS and metadata layer
Need to manage both relational DBMS and metadata layer
Columnar Databases
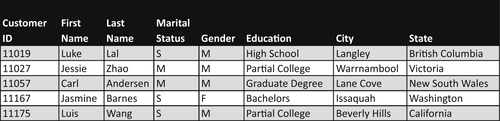
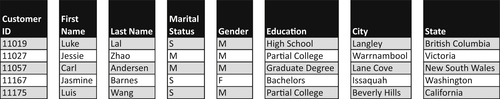
Columnar databases turn the row-based orientation of relational databases on its side, instead storing data vertically by columns. An example of customer data stored on a relational table is depicted in Figure 7.8, whereas the same data stored in columnar format is depicted in Figure 7.9.
FIGURE 7.8Customer data on a relational table.
Query processing is sped up in a columnar database because:
• All columns are indexed automatically.
• With all the data in a columnar table having the same data type, there can be significant data compression reducing the amount of data that is processed by a query.
• Most queries only use a subset of the columns in a table, so by having the columns already separated, the queries only need to retrieve exactly the data they need, whereas a relational database reads the entire row and then reduces the results.
FIGURE 7.9Customer data stored in columnar tables.
The columnar approach is based on analytical usage patterns and essentially indexes all of the data automatically. This reduces the laborious effort needed to tune relational databases to run specific queries in data marts, and can also lower the number of skilled database administrators needed to do the tuning work. In fact, many enterprises have found that they can combine their various relational data marts into just one columnar database.
It is important to note that column-oriented databases can be accessed by BI and advanced analytics tools in the same manner that they access relational databases. This means that a shift to columnar database technology, or indeed to other types of analytical database platforms, typically does not require an organization to change the reporting, query, and analytics software it uses.
Columnar databases actually predate relational databases, but for decades they languished in relative obscurity. The reason was that businesses primarily needed databases to handle the steadily rising demands of transaction processing from enterprise applications, which was the strength of the relational database, not the columnar database. Today, most enterprises have robust transaction processing operations and are instead focused on trying to meet the analytical demands of the exploding volumes of data.
As with much of this technology, there is a good deal of mixing and matching when vendors are building their products. In-memory, MPP, and BI appliances have all been coupled with columnar databases in different products and in different combinations. There’s a full range of capabilities, from spreadsheets with in-memory columnar databases to large-scale BI appliances with MPP columnar databases. In a BI architecture, columnar databases are well suited to providing data mart and OLAP cube functionality. Depending on which columnar product is used, a columnar database could function as an enterprise-wide data mart, eliminating the need for multiple data marts or cubes.
In-database Analytics
Just as database vendors have implemented integration services in their DBMS, they have also been implementing BI and analytical services into their DBMS. With in-database analytics, compute-intensive analytical processing is moved directly into a data warehouse built on top of an analytical database. This shift eliminates having to transform and move data between a database and a separate analytical application.
The in-database approach can reduce both setup and data retrieval times, ultimately resulting in much faster analytics performance. It also simplifies the BI data architecture by:
• Eliminating the need to preaggregate data.
• Reducing the need for multiple data marts, since the analytical processing is shifted from the ETL process to the in-database analytical process.
The most significant advantages are achieved when in-database analytics are combined with BI appliances that leverage MPP and other advanced technologies that expand scalability and performance of databases.
In-memory Databases
Traditionally, databases stored their content on disk because it was the most cost-effective and reliable option. Storing data on nonvolatile disks ensured that it was persistent (excluding disk failure), whereas data would be lost if power was cut off to volatile memory. Also, there are capacity issues with how much data can reside in memory. But the key constraint on database performance has always been I/O to disk, and despite advances in storage technology, the goal continues to be storing the data in memory.
With the advent of 64-bit architectures, multicore processing, and advances that enable data to persist in memory indefinitely, the technological barriers have been broken. The amount of data from a database that can be put into main memory continues to increase, although it will continue to be more expensive than storing data on disk.
Database vendors have been enabling their DBMSs to store some or all of the system’s data in memory. The hybrid approach is storing the most frequently used data in memory while the rest uses disk. Enterprises that experience trouble achieving the database performance that the business needs should consider in-memory databases. Those enterprises will need to examine the performance versus price curve of the in-memory databases compared to what they currently use to determine if it is a cost-effective solution. If an enterprise is considering moving to an in-memory database, then they need to calculate database migration costs in their database evaluations. If the enterprise’s current database vendor is offering in-memory capabilities with their DBMSs, the cost of upgrading to a version of the database software may be less than the cost of migrating to another DBMS.
Massively Parallel Processing
There are two hardware-related architectural approaches to DBMSs:
• Symmetric multiprocessing (SMP)
• Massively parallel processing (MPP)
An SMP databases operates on one or more identical CPUs sharing a common operating system, memory, I/O resources, and disks. When SMP databases are running on more than one server, it is called a clustered configuration. SMP databases always assign tasks to a single CPU. The SMP architecture is called a “shared everything” system. By contrast, MPP databases use multiple CPUs, each having their own operating system, memory, disks, and I/O resources. This architecture is called a “shared nothing” system. The data in an MPP database is spread across processes. The MPP system has software that splits processing and coordinates communication between CPUs. The primary constraint on SMP databases is memory, whereas MPP scales linearly as CPUs are added. SMP databases typically cost less than MPP databases and require less expertise to operate.
SMP databases are typically used for transaction processing systems and are very common in BI implementations, since the top relational vendors by market share offer this architecture. MPP systems have been around a while, but because of their cost, their use had been limited to the most demanding database applications. With the cost of processors, memory and disks declining and with data volumes soaring, MPP databases are being more widely used. The BI market has responded by building many of the BI appliances, columnar databases, and NoSQL databases using an MPP database architecture.
Big Data
Enterprises have been experiencing an ever-increasing rise in data volumes, data variety (source and formats), and data velocity (the need for real-time updates.) This phenomena has been labeled Big Data. This trend started when enterprises created more data from their operations, exploded with Web and social media data and is expanding with the IoT, creating more and more networked devices feeding even more data.
There are three categories of data based on its form in the primary source:
• Structured: transactional data from enterprise applications
• Semistructured: machine data from the IoT
• Unstructured: text, audio and video from social media and Web application
Relational database technology is terrific at handling structured data and has the following attributes:
• Large installed base of applications, often running key business processes within an enterprise.
• Large pool of experienced people with skills such as DBA, application developer, architect, and business analyst.
• Increasing scalability and capability due to advances in relational technology and underlying infrastructure that it uses.
• Large pool of BI, data integration, and related tools that leverage the technology.
• Requires a schema with tables, columns, and other entities to load and query database.
• For transactional data, it provides ACID (atomicity, consistency, isolation, and durability) support to guarantee transactional integrity and reliability. The terms making up the acronym “ACID” stand for:
• Atomic: Entire transaction succeeds or it is rolled back.
• Consistent: A transaction needs to be in a consistent state to be completed.
• Isolated: Transactions are independent of each other.
• Durable: Transactions persist after they are completed.
For all its strengths with structured data, relational technology cannot handle unstructured data effectively. NoSQL databases, rather than relational databases, are being used to handle unstructured data such as Web and social media. NoSQL databases are referred to as “Not Only” SQL databases, because SQL is not required but may be used for some of these databases. NoSQL databases have the following attributes:
• Significant installed base of systems, particular websites, using a NoSQL database.
• Supports distributed, scalable, and real-time data updates.
• Schema-free design that provides flexibility to start loading data and then changing it later.
• Provides BASE (basically available, soft state, eventual consistency) rather than ACID support (yes, someone appears to be a high school chemistry nerd!). This eventually consistent model informally guarantees that if no changes occur in the intervening time span, then eventually all access queries will return the latest data values. The terms in the acronym “BASE” stand for:
• Basically available: high availability of 24/7, for example, demanded for most transactional systems, is relaxed.
• Soft state: database may be inconsistent at any point in time.
• Eventually consistent: at some point in time the data will be consistent.
There are product market differences between relational and NoSQL:
• Relational has a few dominant products and vendors, as the vendor market has thinned considerably since its early days, while there are over 150 NoSQL products in the market.
• Although there are several OSS relational products, the market is dominated by proprietary software. On the other hand, many of the top NoSQL products are either OSS or have their origins in OSS.
NoSQL databases fall into several technology architectures categories:
1. Key-Value
2. Column-Family
3. Document
4. Graph
Key-Value: This database works by matching keys with values. The key, typically unique, serves as the index to search for a value. Key-value databases use an associative array, also called a map or dictionary, to represent a collection of key-value pairs. Some implementations have extended the key-value model to include ordering the keys to allow for range searches. This is considered the most basic implementation of NoSQL.
Column-Family: This database extends the simple key-value model by creating a collection of one or more key-value pairs that match a record. Each column of each record can be different. Column-family databases contain two-dimensional arrays with each key (row) having one or more key-value pairs. These databases are extremely powerful and are used to keep very large amounts of important data.
Document: This database works in a similar manner to column-family databases, but enables much deeper nesting and complex structures. The nesting allows for the value associated with a key to contain structured or semistructured data. Unlike a key-value database, a document database allows queries on both the structure of a document and the elements within it. A liability of this database is that queries and updates need to access most or all of the complex structure, regardless of what portion is really needed. The advantage of these databases is that they are quite effective at separating a large amount of unrelated, complex information that has highly variable structures.
Graph: This database does not involve key-value pairs like the others, but instead uses treelike structures or graphs with nodes (also referred to as edges) that are linked to other nodes through relationships. This model, more so than key-value pairs, enables the ability to more easily link and group related data.
If an enterprise needs to capture and analyze unstructured data, then it need a NoSQL database. Use a product evaluation to determine which type of NoSQL database should be used and the specific product to implement.
BI Appliances
BI appliances are a combination of products designed to improve performance and increase scalability for BI and analytical applications. There are also comparable appliances built to do the same for data warehousing, Big Data, and transaction processing.
There are significant differences between BI appliances. To start with, an appliance typically includes hardware and software components, but there are some that are software only. All will have specialized components to improve something by making it better, faster, or less expensive, but each BI appliance takes a different approach to achieving those benefits. Increasingly, BI appliances are taking advantage of the declining costs of hardware―processors, memory and disks―by using commodity products in their configurations. In addition, some BI appliances leverage OSS for its operating system or its database.
Some BI appliances have redesigned hardware, such as specially designed chips that handle analytical I/O and compression techniques, to increase capacity and throughput. Incorporating this capability into hardware speeds up business analytical processing even before it hits a database or disk. This means that a business person’s dashboard or other analytical application is quicker “out of the box” with BI appliances designed with these components.
Other BI appliances have gone further than these hardware advances and have reduced the reliance on relational databases to enable business analytics. Columnar databases, MPP, and in-memory analytics are all designed to speed up processing and reduce (or eliminate) the time necessary to build specially designed and tuned relational databases or OLAP cubes to support BI behind the scenes. These technologies enable business analytics by supporting the onslaught of variety, volume, and velocity of data. Business people always wish to examine data in new ways to meet changing market conditions and customer needs. These technologies enable self-service business analytics by eliminating reliance on newly designed and tuned BI data structures every time a business person wants to examine data in a different way.
A WORD OF CAUTION
When you are examining and evaluating the use of BI appliances to implement an enterprise’s business analytical needs, be sure to look under the covers to determine what the true innovation is, both in terms of hardware and software, in the BI appliance’s architecture. There are a few BI appliance pretenders whose vendors have merely bundled existing hardware and software into a product offering, using the BI appliance label.
Make sure you understand what is being offered in the BI appliance architecture, how it addresses your business analytical needs, the impact on speed to implementation, and how/if it lowers the TCO compared to the traditional “roll your own” BI systems, for which you pick each component separately.
Product and Technology Evaluations
BI has had a long history of sustained and disruptive innovations that continue to improve an enterprise’s ability to meet the challenge of increasing data volumes, velocity, and varieties, while at the same time returning more value to its stakeholders. The BI industry also has a long and sustained history of technology and product hype resulting in too many inflated expectations and project failures―not because of technology, but rather from missed expectations.
BI Product Vendors
Interestingly, each BI style was introduced by a new generation of BI vendor responding to the perceived limitations of the existing popular BI styles. There have been hundreds of BI vendors over the last couple of decades with one of the following outcomes:
• The most successful or innovative of the vendors are acquired by larger BI vendors who then incorporate their product into their BI product suite. Usually, there is a product roadmap that shows the product becoming part of the BI suite over the span of several product releases. Often, the level of integration is far from seamless, and customers end up implementing the product in the BI suite separately.
• Some BI vendors and products fade away.
• Surprisingly, many BI vendors and their products linger on for years with sales in the tens or hundreds of millions of dollars and a very loyal customer base. These vendors do not “break out” to dominate the BI industry, but remain niche players. Often, the vendors specialize in an industry and offer terrific customer service to retain their customers and their loyalty.
After determining your BI requirements (data to be accessed, type of analysis to be performed, number and diversity from a skills perspective of your BI business consumers and the BI styles they need), you need to look at which products and vendors in the marketplace can meet your needs. We will discuss product evaluations later in this chapter. The vendors in the BI marketplace―BI, data integration and databases―can be split into the following categories:
High-tech titans: These are the largest technology firms that offer the full range of BI technologies plus other software categories, services, and potentially hardware. Some of these titans also sell ERP systems that use their BI tools, but those tools can be purchased independently. These vendors may also offer BI appliances.
Enterprise application stack vendors: These companies will offer applications for ERP, CRM, SCM, specific industries or other business processes along with BI applications. Their tools may be homegrown or they may partner with an independent BI vendor to use their tools. Sometimes a DW, data mart, or ODS is prebuilt to support standardized BI applications that can be customized later.
Independent BI vendors: These companies may offer the complete spectrum of BI technologies, or they may specialize in specific technologies such as data integration, data discovery, or predictive analytics. These vendors’ offerings will fall into one or more of the following categories:
• Full BI stack
• BI and analytic specialists
• Data integration specialists
• OSS
• Cloud or SaaS (software as a service)
• Big Data specialists
Enterprises have a wide variety of BI products and vendors that will meet their business and technical requirements. When conducting a technology or product evaluation, examining the product vendor is a critical to positioning their product(s) in your architecture, assessing their ability to execute now and in the future―and, determining if the level of support you will likely get matches your needs. It is generally safe to pick the largest vendor, although that vendor might not necessarily be the best for your enterprise.
Dazed and Confused
Each new generation of BI vendors, consultants, and pundits boldly proclaim that they have discovered BI’s Holy Grail and can implement BI in minutes or hours with their latest BI tool, technique, or service. Their sales people have slick demos that show BI applications being built instantly without the need for those stodgy IT folks who are clinging to the last generation’s tools, techniques, or services. These generations occur every 3 to 5years, because that is typically how long it takes for the last wave’s BI Holy Grail to become part of the mainstream. Each generation has indeed expanded and improved BI’s capability, its use and its value, but none have eliminated the BI backlog in enterprises or the hard work involved with integrating data.
There are foundational concepts that keep eluding each new generation of BI pundits:
• It’s the data. Each new generation keeps approaching the development of a BI application as if the fundamental issue is the business user accessing data. Accessing data is easy; accessing the correct information and understanding what it means is the tough part. The reason that data management and data integration work requires lengthy discussions with business people to define data is that the business needs some or all of the 5C’s―clean, comprehensive, consistent, conformed, and current―when it comes to information to be used for analysis, not just data access.
• Data capture is different from information consumption. Data is captured in the context of a business transaction, an event, or an act by someone or something. The information consumed in business analysis is in the context of the person performing the analysis. That analysis involves data relationships, business rules, and business measures that typically are of no relevance or may not have even existed at the time of data capture. The same information may be analyzed many different ways by different people for different purposes.
• The tail does not wag the dog. Each new generation blames the previous generations of tools for the reasons various BI techniques and approaches were followed, claiming that now it eliminates the need for them. Relational databases, ETL tools, and existing BI tools are blamed for the need for dimensional models, data integration, data warehouses, and many other things. But with BI’s rich history of evolution to meet increasing business demands, it is more accurate to assume that these techniques are based on business needs, not the demands of the technologies. It is not the tail wagging the dog―i.e., technologies dictating BI best practices―but rather these practices that are driving the direction of the technologies.
Without these foundational concepts, much of what occurs in data management, data integration, and BI seems superfluous. The newest generation of BI tools has great demos and they work well in their initial projects because they primarily deal with one group of business people that performs analysis on a data silo. But once the BI tool starts being used beyond the data silos, the same data issues appear as with the previous tools, and then we wait for the next newest generation to appear.
Beware the hype.
Technology and Product Evaluations
With each new technology and product, the best practice is to conduct an evaluation and, if possible, a proof of concept (POC). The evaluation should have stakeholders, both technologists and business people, involved throughout the process. The people who are going to use these technologies in their day-to-day jobs need to be engaged in the evaluation, whether it’s the business person who will perform analysis or the developer who will use the tools to create the BI environment. Management personnel, business power users, and architects (if you have them) should be involved, but if they are the only people involved, then the results may not be the best fit for purpose and might be rejected by the people who will really use the tools.
Product evaluation tasks include:
Gather and prioritize requirements: This includes business, data quality, and analytical needs along with volumetric estimates such as data volume, frequency of updates, number of data sources, and number of business users (total, active, average and maximum at any time).
Establish success and value criteria: Although numeric scores look quantitative and scientific, they are often subjective, and many times attributes that are not needed or will never be used end up influencing the selection decision. To avoid these shortcomings, it is best to establish, at a minimum, the following classifications: (1) must have, (2) nice to have, and (3) will not use. Numeric scores can still be used, but they can be judged within these classifications instead of just by themselves.
Select shortlist of product candidates. It is a good practice to conduct a quick survey of the many products available with their vendors placed in the categories we previously discussed (high-tech titan or independent BI vendor). This list should be reduced to, at most, three to five candidates before any detailed due diligence begins. If there is a legacy BI product being used, include it, if only for a baseline (unless it is hated). Also, include only products and vendors that have a chance of being selected, For example, if your enterprise will not use OSS products or buy from a vendor whose sales do not meet a specific threshold, then do not waste your time or theirs in the evaluation.
Conduct product reviews. The first step is to examine online demos or have the vendor perform them for you, followed by a question and answer session. The next step is to have hands-on experience with the product. Some vendors may offer a very robust demo environment where business people can interact with the product using various BI styles, performing different types of analysis, and with different types of data. Of course, that type of demo is for using the product, not building the BI or data integration applications, so in those cases you may be able to use a trial version of the product and any available tutorials to become familiar with it. The final step, if time and resources allow, is to conduct a POC or pilot using your enterprise’s data, and creating sample BI or data integration applications that demonstrate your specific needs. The scope can vary greatly, but if there are more than two vendors involved, you should keep the scope limited. After all, the goal is to eventually develop BI applications for your enterprise, not to spend all your time conducting product evaluations.
Score and rank products. All stakeholders should have some someone representing them in this process. Classify as (1) must have, (2) nice to have, or (3) will not use. Assign numeric scores or grades to each attribute that is being examined based on guidelines created before the scoring begins. Most evaluations have a long list of functional and usability criteria from both technology and business perspectives. After product reviews, each product is scored according to this criterion and then ranked, creating a final score that identifies the winner. The evaluation team should feel that it has been very objective and has arrived at the best solution for the organization.
Review results and select product(s). Although the evaluation process tries to be as objective and democratic as it can, the reality is that there is subjectivity, as we are humans. As long as there is no appearance that the process was “rigged,” then a little bias is fine and unavoidable.
Hassle with product vendors over pricing. Although this is not generally discussed, it is what happens. Sorry, product vendors! That is why the task above was to select the top two products. The goal will be to come to terms with the top product from an evaluation perspective, but purchasing departments like this scenario.
There is a wide range of costs for almost all these technologies. They range from free (at least in respect to licensing costs) to very expensive. Prior to selecting your product shortlist, you need to get a ballpark estimate on what your organization would likely spend and what the products will cost. You probably will not tell the vendor what your budget is (I would not), but you need to filter products based on what you can afford or are willing to spend. Do not evaluate products that are not realistically within your budget. As an aside, if you are engaging an outside consultancy or independent consultant in the product evaluation, tell them what your product budget is, otherwise they may waste everyone’s time, including that of the vendors selling the products that you cannot afford.
Product Migration
Many times, an enterprise is new to a particular technology, so there are no legacy products in their enterprise. But when there is, take special considerations.
Many large enterprises, for instance, already have more than six BI tools in use by various business people. If your existing BI, ETL, or database product is indeed not able meet your enterprise business needs or is too costly, then it is time to replace it. However, many times when new products are evaluated and selected, it is based on unrealistic expectations or product hype.
Although I would never discourage a product evaluation to determine if there is a better tool to meet business requirements or to lower costs, it is a best practice to include the costs of product migration if you do chose to replace your existing product. Some of the considerations and costs include:
• New product licensing (or subscription) and support costs.
• Cost of expertise. New skills or expertise will be needed and previous skills no longer needed. Existing staff are not likely to be experts in the new technology or product. Options:
• Bring in new people and let go of the existing staff. Add in hiring and firing costs.
• Keep the existing staff but retrain them. The costs are:
- Training: Include both formal and on-the-job training for IT and business people.
- Lost productivity: It takes time to become an expert and it takes longer to get things done.
- Quality issues: Deliverables are not likely to be done well at first and lots of foundational work will be shabby and difficult, or costly to replace or improve later on.
• Consulting costs, if you choose to have outside resources with expertise augment your staff.
• Cost of lost opportunity. Rather than working on business needs during the migration, the focus is on technology, not business. What could have been built or improved for the business has to be part of the cost of migration. If you migrate what you have and the result is the same business functionality on a new platform, then there is no gain to the business. “If it ain’t broke, don’t fix it.” Why migrate to another technology or product if the existing one works well and there is no significant gain to migrating to the new platform?