
CHAPTER 5
Visual Principles of Design
In this chapter, you will learn about
• Determining image specifications for a video system, including character height, farthest and nearest viewing locations, and good and acceptable viewing areas
• Calculating the aspect ratio of a display, given its height, width, or diagonal
• The advantages and disadvantages of front-screen and rear-screen projection
• The basics of videowalls
• Measuring reflected light bouncing off a screen and into a viewer’s eyes
• Calculating lumens, projector brightness, and task-light levels for a given projection system
• Using industry standards to calculate contrast ratio correctly
The visual display components of an AV system drive room design. Designers must configure the space to ensure that an audience has a high-quality viewing experience. They must then design the other elements of the room to fit that layout.
The display system (also referred to as the video system) consists of the display devices themselves (flat-panel display, projector and screen, etc.) and the components that support those devices (sources, switchers, etc.). Every aspect of the video system affects what the audience sees; therefore, it all requires careful consideration by the AV designer.
Determining Image Specifications
When designing a video system, your first task is to determine image specifications. After all, you can’t select effective video equipment if you don’t know what needs to be displayed and who’s going to be displaying/looking at it. For example, where will the viewers be located? Will they be sitting? Where should the screen go so the most people can see it? How tall should any displayed text be so viewers can read it?
If you determine this information first, you can use it later when you select the display gear needed to produce the right image to communicate the intended message.
An AV designer must consider four parameters before selecting an actual display: text size, farthest viewing distance, nearest viewing distance, and good or acceptable viewing areas.
Determining Text Size
When designing a video system, you should first consider the size of any text the user wants to display. After all, people should be able to read information on the display from a given distance. And if customers can’t read digital signs, what good are they? Once you determine the required text size, you can explore the presentation medium.
Displays are characterized by resolution; the human eye is characterized by acuity. Resolution describes a video system’s ability to reproduce highly detailed information. Visual acuity is an eye’s ability to discern fine details. Put another way, visual acuity is what an individual set of eyes can see, but screen resolution is what an electronic display can output.
There are several different kinds of acuity, including resolution acuity, which is the ability to detect that there are two stimuli, rather than one, in a visual field. Resolution acuity is measured in terms of the smallest angular separation between two stimuli that can still be seen as separate.
Recognition acuity is the ability to identify correctly a visual target. In terms of text onscreen, it’s the ability to differentiate between a G and a C, for example. Usually—but not always—recognition acuity is measured in terms of the angular dimension of the smallest target that can be discriminated. A clinical eye chart, where visual-acuity testing is performed using letters, is a form of recognition-acuity testing.

Watch a video about determining image specifications at www.infocomm.org/ImageSpecVideo. Appendix C provides a link to the video.
Visual Acuity and the Snellen Eye Chart
You’re probably familiar with standard eye charts. Figure 5-1 shows a Snellen chart. It’s a great reference for understanding acuity. The Snellen chart displays several characters, called optotypes, which look like letters. An optotype is a character used to assess a person’s visual acuity. It looks like a block letter and is drawn with specific and rigid geometric rules. Only ten optotypes are used on the traditional Snellen eye chart: C, D, E, F, L, N, O, P, T, and Z. The perception of five out of six letters (or a similar ratio) is called the Snellen fraction. In this chart, the thickness of the lines equals the thickness of the white spaces between lines and the thickness of the gap in the letter C. In addition, the height and width of the letter are five times the thickness of the line.

Figure 5-1 A Snellen eye chart
Character Height
When determining text size, your design goal is to create a text height that is easy to read and won’t cause eye strain or fatigue. Imagine an audience looking at PowerPoint presentations for three days.
Eye charts are designed to have a high contrast and a clear font. AV presentations likely won’t have this kind of contrast, especially in situations of front-screen projection. You also cannot control the creation of the presenter’s material, backgrounds, text color, or font style.
There is a rule for determining whether onscreen text is legible.
Text height × 150 = maximum distance from the screen
For example, if a line of text is 3 in (75 mm) high, the maximum viewing distance for this font is about 37.5 feet (about 11.5 meters). You can determine this by multiplying 3 in by 150, which gives you 450 in (450/12 = 37.5 feet). In metric, that would be 75 mm multiplied by 150, which gives you 11,250 mm, or 11.25 meters.
License plates are an excellent example of visual acuity in the real world. After all, they’re designed to be legible from a distance. In Nevada, the laws governing license plates read, “The Director may determine and vary the size, shape and form and the material of which license plates are made, but each license plate must be of sufficient size to be plainly readable from a distance of 100 feet (about 30.5 meters) during daylight. All license plates must be treated to reflect light and to be at least 100 times brighter than conventional painted number plates. When properly mounted on an unlighted vehicle, the license plates, when viewed from a vehicle equipped with standard headlights, must be visible for a distance of not less than 1,500 feet (about 457 meters) and readable for a distance of not less than 110 feet (about 33.5 meters). (This is an angle of 7.16 or 1.43 times larger than 20/20 vision).”
The United States isn’t the only country with such laws. The Department for Transport in the United Kingdom specifies that each character in a registration mark must be 79 mm high and 57 mm wide.
Technically, both the Nevada and United Kingdom laws exceed the 150 rule. This is because they include provisions for people who don’t have 20/20 vision.
The AV designer plans for where viewers will (and won’t) be positioned to see a quality image. This means considering the height of the font in light of the viewing task or purpose of the space. Let’s consider an airport display wall.
Figure 5-2 shows an airport departure display at Washington Dulles airport. An AV designer, when developing this installation, considered questions like, “Who will be viewing this sign, and why? Where is the viewing area? Should viewers be able to walk and read at the same time, or will they have to stand still?”

Figure 5-2 An airport display wall
This videowall consists of eight individual screens: two high by four wide (2 by 4). Each 32 by 24 in (813 × 610 mm) screen is 800 by 600 pixels and displays 21 rows of information. Because the videowall comprises eight screens, it can display 168 lines of text.
The font height is 12 mm, and the pixel count is 12. Because you know the height of the font used for the board, you can calculate the farthest viewing distance using the 150 rule: 12mm × 150 = 1.8 meters (5.9 feet). This puts the farthest viewing distance right at the edge of the carpeted area and just on the tiled walkway. Perfect. The smaller font forces people to move out of the walkway and closer to the sign. It also makes people slow down or stop to get the required information.
Conversely, if you know where the people need to stand, you can figure out how big text needs to be—or more specifically, what size font you should use for your display. Characters are measured in both inches/millimeters and pixels. The screen size and font size in inches/millimeters are directly proportional to the screen size and font size in pixels. A fairly standard 10-point font (Arial or Times Roman, for example) will be 10 pixels tall when viewed at 100 percent. Some flashier fonts may not adhere to this concept, but because of readability and other factors, users are less likely to use such fonts for presentations, digital signage, and so on.
Earlier, you learned to use the 150 rule for the farthest viewer to determine the font size in inches/meters. When you know how tall a font must be in inches/meters, you can convert that to pixels to recommend the right font size. If you know the screen height in inches or millimeters, you can calculate the font size in points. With that information in hand, you’ll know the screen height and font height in inches/meters.
Determining the Farthest Viewing Distance
When people view content on a screen or display, they’re performing a viewing task. The viewer expects to see the displayed content comfortably. If you know the maximum distance of the farthest viewer, you can determine the required image height that best suits the task. Conversely, if you know the height of the image, you can determine how far the farthest viewer should be.
For the purposes of determining the farthest viewing distance for a display system, AV designers group viewing tasks into three general areas.
• Observing content This could be for any type of motion picture viewing where details are not critical. This task is also known as general viewing.
• Inspecting content, or observing content with clues This could be reviewing web pages, spreadsheets, or simple presentations. In addition, words sometimes offer clues to the meaning of images for easier interpretation. This viewing task—a combination of words and images—is known as reading with clues.
• Inspecting content without clues This could be analyzing engineering drawings or medical images. For this task, there are no words displayed to help interpret an image’s meaning. This task is also known as inspection.
One way to determine a comfortable viewing experience is to base the height of the image on two criteria.
• What the viewers are going to see
• Where the farthest viewer will be seated
These two factors are important because viewers may need a larger screen to see more detail without having to strain their eyes. They may also need to move closer to a display to view material comfortably.
The formula for determining image height based on a viewing task is as follows:
IH/ID = DT/VT
where:
• IH = Image height.
• ID = Distance from the farthest viewer to the image.
• DT = Viewing task ratio (height). This will always be 1.
• VT = Viewing task ratio (distance).
The image height formula reveals that tasks requiring more detail require bigger images. For the viewing task ratio, which is based on levels of detail, use a factor of 8 when viewers will observe content (general viewing), use 6 when viewers will inspect content with clues (reading with clues), and use 4 when the viewers will inspect content without clues (inspection). Figure 5-3 shows a seated display area with a screen to the left and three curves showing maximum viewing distances based on factors of 4, 6, and 8.

Figure 5-3 Viewing distances based on tasks
The Simple Image Height Formula Wheel
The relationship between image height, viewing task, and farthest viewer distance can also be represented as a wheel, as shown in Figure 5-4. Just as with the Ohm’s law wheel, if you know two of the variables, you can easily calculate the third.

Figure 5-4 The simple image height formula wheel
To use the wheel, locate the value you want to calculate. Here’s a reminder:
• ID = Farthest viewer distance
• IH = Image height
• VT = Viewing task
Calculate the value by performing the operation between the two remaining variables. If variables are on top of each other, divide the top variable by the bottom. If variables are next to each other, multiply them, as shown in Figure 5-5.

Figure 5-5 Derivative formulas from the simple image height formula wheel
Determining the Nearest Viewing Distance
Designers need to lay out a viewing area to ensure the audience gets the best visual quality from the display screens. To do this, you need to know the position of the audience, and the first question you need to ask is, “How close is too close?” The answer to this question will determine the location of your nearest viewer.
Not surprisingly, viewers can be too close to a screen. How close is too close? InfoComm states no less than 1× the screen width, which closely matches your eyes’ viewing angle (approximately 60 degrees for color discrimination), is too close. Therefore, a useful rule of thumb is to make sure that the distance to the first row in a viewing area is no less than the image width (see Figure 5-6). This allows viewers to see the entire screen within a natural field of vision.

Figure 5-6 The first row of a viewing area should be no closer than the image width.
When determining the closest viewing position, designers should also consider the height of the image. You don’t want viewers in the front row to have to turn their heads up through an entire presentation. When specifying image dimensions, the top of a screen should be no higher than 30 degrees above the standard line of sight for a seated viewer in the nearest viewing position. The middle of the screen should fall about 15 degrees above the standard line of sight (see Figure 5-7).
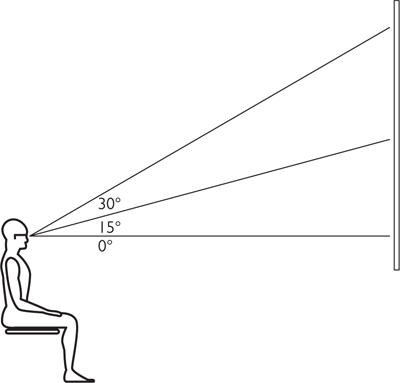
Figure 5-7 A screen size based on comfortable viewing angles for the nearest viewer
Determining the Viewing Range
Earlier, you learned how to calculate the farthest viewer using the 4, 6, and 8 rule. Then you learned how to find the location of the nearest viewer based on an image’s width. The space between these two positions is your viewing range.
Next, you need to determine how far to the left and right viewers can sit and still see the image, as shown in Figure 5-8. Once you have these dimensions, you will have a complete picture of the viewing area.

Figure 5-8 Optimal viewing areas
Screens have limitations that can reduce the viewing range. Off-axis viewing angles limit a viewer’s ability to make out characters. The maximum acceptable viewing angle is 45 degrees from the far edge of the screen. Beyond that, characters or image elements may become indecipherable.
What we’ll call the good viewing area is the best place to view a screen. It is typically defined as any point within 45 degrees to the left or right from the straight-on axis (see Figure 5-9). Therefore, the total good viewing area is 90 degrees.

Figure 5-9 A good viewing area is 45 degrees off-axis in either direction.
A major part of designing an AV-enabled room is ensuring that an audience can see what’s presented while seated in the good viewing area. In Figure 5-10, the good viewing area is within 45 degrees of the display axis. The short line coming off the screen represents 1× the screen width, and the long lines coming out of the screen represent the farthest viewer length.

Figure 5-10 A good viewing area, taking into account the distance to the first row, farthest viewers, and viewing angles

NOTE Take another look at Figure 5-10. If the room had a larger screen, you might be required to move the table farther back. Such a design decision might impact access to the room and pathways for getting in and out.
Of course, although a design should strive to ensure a good viewing area, you may need only an acceptable area, depending on your needs analysis, examination of the space, and other criteria. The acceptable viewing area for a screen falls within a 45-degree line extending outward from the left and right edges of a displayed image, rather than the center.
Watch a video about determining a viewing area at www.infocomm.org/ViewingVideo. Appendix C provides a link to the video.
Display Device Selection
Once you’ve done the math and determined the specifications needed for your images, you are ready to determine which equipment you need for your system, starting with display sources. In digital video systems, the term format refers to the source of the image. Digital sources can include Blu-ray players, DVD players, streaming media players, personal computers, cloud-based services, and personal devices, such as tablets and smartphones.
Knowing your customer’s source media, resolution, refresh rate, color space, audio format, and more will help you identify the proper player for that media. Remember, as you specify display devices, it is important to employ the highest-quality signal available while still maintaining system functionality.
To that end, let’s start breaking down some of the important characteristics of display equipment.
Video Resolution
Graphic chips, regardless of the type of source they come in, produce many different display resolutions. It’s up to the AV professional to select a resolution output that looks good on the display used in a video system.
A display device has a “native” resolution, which is the resolution that is optimized for the display. For example, if a display has 1024 pixels horizontally and 768 pixels vertically, it has a native resolution of 1024×768.
If an image is larger or smaller than the display’s native resolution, it might not look good. If a source image is a different height or width than the display, the display’s scaler may stretch the image or create unsightly borders. Whenever possible, you should match the resolution of the source to the native resolution of the display.
A higher-resolution display means more pixels, greater detail, and better image quality. It also means the system requires more information to build an image. Figure 5-11 shows a variety of display resolutions.

Figure 5-11 Common video display resolutions
Aspect Ratio
Human vision is oriented horizontally. Your eyes’ angle of view is wider than it is high—landscape rather than portrait. Therefore, people naturally frame a scene horizontally. This perceptual quality is translated into a mathematical equivalent known as aspect ratio, which is the ratio of image width to image height.
Aspect ratio is expressed as two whole numbers, separated by a colon (for example, 16:9), or by the decimal equivalent of the implied division (for example, 1.77). Common video aspect ratios include the following:
• 4:3 (1.33) for standard-definition (SD) video
• 16:9 (1.77) for high-definition (HD) video
Some computer and video production displays operate at a 16:10 (1.6) aspect ratio. Your ability to determine the correct aspect ratio for any image, screen, or display will help you specify the right product for your design, match a projector’s image to the correct screen size, or select the correct image size for a given environment. Without a solid understanding of aspect ratio, you could make a costly error.
The worst-case scenario is a mismatch between a screen and projector and a mismatch from image to projector. In such a scenario, the size of the image will be reduced. When an image gets smaller, the audience will have to move closer to get a good view. Moving closer will, in turn, change viewing angles and the closest/farthest viewer calculations.
Calculating Aspect Ratio
An HDTV display with a 1920×1080 resolution has an aspect ratio of 1920:1080 or 16:9 or 1.77. Using this aspect ratio, if you know one of the image dimensions, you can easily find the other.
Let’s say you need a projected HD image to fill a custom space above the chair rail in a room. You measure and find the height to be 63 in (1600 mm). By multiplying 63 in (1600 mm) by 1.77, you will get the width for a 16:9 HD image, which is 111.5 in (2832 mm). Conversely, if you know the width and are looking for the height, you simply divide the width by 1.77 to find the height required to show a 16:9 image. If you have a width of 102 in (2600 mm) and divide that by 1.77, you will get a height of 57.6 in (1469 mm).
So, let’s try it. Find the width of an image 60 in high with a 16:9 aspect ratio.
Width/height = 16/9:
X/60 = 16/9
Cross multiply:
9 * X = 60 * 16
9 * X = 960
Divide both sides by 9:
(9 * X) / 9 = 960 / 9
X = 106.666666…
Rounded to the nearest tenth, the image width is 106.7 inches.
Calculating Screen Diagonal
The width and height of an image can also be used to determine a screen’s diagonal measurement using the Pythagorean theorem: A2+ B2 = C2, where A is the height of a screen, B is the width of a screen, and C is the diagonal length of a screen. Doing the math, a 16:9 image has a diagonal of 18.36.
If you know the aspect ratio and any dimension—width, height, or diagonal—you can calculate the other dimensions using the “cross multiply and divide” method. Let’s give it a shot. A screen has an aspect ratio of 16:9:18.36. The diagonal of the screen is 2.5 meters. What is the width?
Cross multiply.
2.5 * 16 = X * 18.36
40 = X * 18.36
Divide both sides by 18.36.
40/18.36 = (X/18.36)/18.36
X= 2.178649
Rounded to the nearest tenth, the width is 2.2 meters.
Display Types
There are many display options on the market. The type an AV designer chooses will depend on different factors. In general, display options include projected, direct, and interactive.
Projection systems can be inexpensive and create large images. Increasingly, creative AV designers can “map” projected images onto buildings, cars, or other objects that aren’t shaped like traditional screens. With projection, however, image quality can suffer in some situations because of ambient light.
Direct-display systems, such as popular LCD or LED flat-panel TVs, can provide bright, excellent images, but they are usually limited in size. Large direct displays come at a price premium. Still, direct-display systems offer excellent contrast ratios, and there is no projected light path for viewers or presenters to block.
Interactive displays allow users to make electronic notes directly on an image. An interactive display can use a projection system or a special overlay on a direct-view display. Some interactive displays are large, purpose-built touch screens.
In this section, we will focus on three popular display designs: front-projection systems, rear-projection systems, and videowalls.
Front Projection
Although flat-panel, direct displays are getting bigger, cheaper, and more ubiquitous as the primary screens used for video systems, projection systems are still popular for certain types of installations. As such, AV designers need to know how to integrate these two-piece display systems into spaces.
For starters, a designer needs to understand the properties of projection screens to enhance the projection environment. Projectors produce light, but they do not direct the light toward viewers. Projection screens, however, give substance and quality to projected images. They help direct and focus light to the audience and define image limits by separating them from the wall.
Projection screens are passive devices. This means they cannot amplify or create light energy. They can reflect light rays back at wide or narrow angles. Screen gain is the ability of a screen to reflect or redirect light energy in a narrower viewing area, making projected images appear brighter to viewers sitting on-axis. The higher the gain number of a screen, the narrower the viewing angle over which it provides optimal brightness.
A matte white screen diffuses light uniformly along both horizontal and vertical planes. In this way, a matte white screen creates a wide viewing area, which can be up to 180 degrees along both axes. Such screens provide good color rendition and may be the best choice for projection applications that incorporate sufficiently bright projectors.
Ambient light rejection—the ability of a screen surface to negate the effects of distracting, ambient light in a space—generally increases as screen gain increases. This is because as the screen gain increases, the angle at which light hits the screen becomes more important. Ambient light that is not on-axis between the projector and viewer (light from exit signs, hallways, windows, etc.) is reflected away from the viewer. This makes the screen appear darker, increasing the contrast ratio. The contrast ratio of a display system is the ratio of the luminance of the brightest color (white) to that of the darkest color (black). A better contrast ratio means viewers can see or read images onscreen more easily. We will discuss contrast ratio in more detail later in this chapter.
Where ambient light is too great and can’t be adequately controlled using curtains or other solutions, a high-gain screen is often used. A screen with high gain directs most of the light energy from the projector away from the audience. The screen is therefore more tolerant of high-ambient light conditions because any ambient light that hits the screen can be directed away from viewers. The angle of incidence (light striking the surface) equals the angle of reflectance (light bouncing off the surface).
In general, front projection requires less floor space than rear projection because the projector is often placed in the audience area. Front projection is also less costly and easier to install than rear projection. For these main reasons, front-projection screens are the most common screens.
However, putting a projector in the same space as viewers poses some issues that must be addressed. For example, most projectors have cooling fans that create noise. Moreover, when a projector is in the same space as its users, people such as presenters or instructors, especially, can interfere with the image by walking in front of the projected light (which, frankly, can also be annoying for the presenter).
Front-Projection Screens
With front projection, the image is viewed from the same side of the screen as the projector’s location. As mentioned, front-projection screens are passive reflectors of light. This means they allow light to bounce off of them toward the viewing area. The contrast ratio of a front-projection system is largely dependent on the AV designer’s ability to control ambient light in a space, but the brightness of the projector and the screen material are also important.
Matte white screens evenly disperse light 180 degrees horizontally and vertically, creating a wide viewing area. Such screens have a smooth, nonglossy surface, similar to a white sheet. They provide accurate color rendition and completely uniform reflection, which makes them the best choice for data and graphics applications. However, because reflected light will diffuse equally in all directions, room lights can be a problem when using matte white screens.
NOTE A matte white screen is a projection screen made of magnesium carbonate or a similar substance that provides a perfect diffuser for the redistribution of light. In other words, the light energy striking the screen surface is scattered identically in all directions. Matte white is a reference surface, with a screen gain of 1.0 (also known as unity gain).
There are also angularly reflective screen surfaces, which reflect light at various angles, rather than a uniform 180-degree reflection. Such surfaces perform like a mirror and have a gain greater than five. The light is reflected at the same angle, it strikes the screen but on the other side of the screen’s axis. If a projector is mounted at a height equal to the top center of the screen, the light would be directed back at the audience in a downward direction. This screen type works well for motion video.
Specifying Front-Screen Projection
A designer must consider several factors when specifying front-projection screens.
• Will the screen be fixed, manual, or electric? Electric screens have motors that are offset or inserted into the roll. Offset motors require a larger cutout than the screen to accommodate the motor.
• How will the screen be mounted? For example, will it be mounted to the wall or ceiling? Will it be recessed in the ceiling? Will it be foldable? Roller screens are the most common mounted screens. Tension screens are made of a thinner material and have “arms” that gently stretch the material flat. Fixed-mount screens are stretched and mounted to the wall.
• Where in a room will the screen be mounted? If it’s mounted near air diffusers, will the screen vibrate as air blows on the screen? The image can also be shaken by structural vibrations. You need to pay attention to the location of other wall-mounted devices, such as exit signs, fire alarms, and whiteboards.
• How far does the screen need to lower to get into the proper position? Will it require extra fabric, called extra drop, at the top or bottom? Designers should specify whether extra drop is required to compensate for ceiling or projection height. This drop should be communicated to the screen manufacturer and written into the specs.
• Do you need to specify reverse wrap? Usually, screens wrap (roll up) toward the back and around. This allows the screen to be placed close to the wall. With a reverse wrap, the screen wraps toward the front and around, which puts it a few inches out from the wall. Such placement, with reverse wrap, allows the screen to be located where it avoids other mounted items, such as chalk trays or whiteboards.
• What size screen do you need, and can it be easily delivered to the required location through doors or up elevators? Will multiple people be required to deliver it?
• Do you need to specify a masking system? A masking system (active or passive) allows you to change the aspect ratio of the visible area of a screen.
NOTE When specifying a front-projection screen in the United States, you may need to specify a plenum-rated box in which to roll it up and store it when not in use. Plenum is the breathable air space above the ceiling that serves as an environmental air-return pathway. Cables, loudspeakers, projector screen cases, and other AV gear mounted in this area must be plenum rated, meaning if it caught fire, it would not release toxic fumes into the air space. Wooden boxes for screens are not plenum rated.
Rear Projection
Rear-screen projection describes a presentation system in which the image is projected from behind and through a translucent screen, toward the audience on the opposite side. It is a transmissive system, in which light passes through the screen toward the viewer.
Rear projection requires more space for installation because it needs a projection room or cabinet behind the screen to accommodate the projector. Mirrors are commonly used to save space in rear-projection applications. Generally, in spaces that suffer from high ambient light, a rear-projection system can deliver better contrast and color saturation than a front-projection system.
Rear-projection systems have a number of characteristics that make them especially suited to specific AV installations, including the following:
• High tolerance of ambient light The images on a rear-projection screen can usually be seen clearly without requiring the room to be as dark as it might be for a front-projection screen.
• Unobtrusive equipment placement Because the projector is out of sight in a rear-projection area, it will not interfere with the room layout or sightlines.
• System black level Rear-projection screens can create a system black level (the level of brightness at the darkest—blackest—part of an image) that is superior to front-projection screens. This can translate into brighter images and greater contrast.
• Contrast Images produced by a rear-projection system usually benefit from a better contrast ratio than those produced by a front-projection system. Sometimes, rear-projection systems can also focus projected light on viewers, further reducing ambient light and improving contrast.
• Low noise Because the projector and associated equipment go into a rear-projection room, the noise they produce is isolated.
• User mobility Presenters can walk in front of a rear-projection screen without disturbing the projected image, making such screens more appropriate for certain types of rooms, such as command-and-control centers or visualization spaces.
All that said, rear-projection systems have their downsides, too, including the following:
• High cost On average, the mirrors, mounts, and screen material required for a rear-projection system add up to cost more than a front-projection system would cost. This is why the needs analysis is so important when deciding between a rear-projection system and a front-projection system.
• Required floor space Because rear-projection systems need space to house the projector behind the screen, they require more floor space than front-projection systems do. Moreover, the projector room needs to be kept clear of objects that could block the light path or push the projector out of alignment. Users can’t think of their rear-projector room as extra storage space!
Rear-Projection Screens
Diffusion screen material for rear projection is usually rigid acrylic, glass, or vinyl fabric. These materials provide a diffused, coated, or frosted surface on which to focus an image. The ambient light rejection of these materials is considered moderate, based on the viewer-side material’s reflectivity or sheen. Assuming the projection room is painted flat black, any ambient light behind the screen will be absorbed while still in the room.
Rear-projection screen materials offer a wide viewing angle—horizontally and vertically—but with little or no gain. The light from the projector is transmitted through the screen with relatively little bending. You may see some hot spotting with rear projection, where an image is unevenly illuminated, because of the transparency of the screen fabric and the vertical placement of the projector in relation to the audience.
Optical-pattern rear-projection screens capture and concentrate light to maximize the amount passing through to the audience. An image can appear less bright if viewers or the projector are moved off-axis. Therefore, the projector must be at the focal point indicated by the manufacturer.
For permanent rear-projection applications, you’ll want to use optical screen material. This type of screen system comprises a series of lenses formed into the screen material. The most common is a two-lens system, in which the lens that faces the projector is a Fresnel lens. It is a flat glass or acrylic lens in which the curvature of a normal lens surface has been collapsed, creating concentric circles on the lens surface. This lens gathers the light from the projector. The second lens, molded to the other side of the acetate or to another sheet, is a vertical lenticular lens. It must be flat to avoid hot spots. The lenticular lens faces the viewing audience and spreads the light horizontally, providing a relatively large viewing area. See Figure 5-12.

Figure 5-12 Types of rear-screen projection material
When creating specifications for a rear-projection screen, AV designers should consider the following:
• The required size of the screen The raw screen should be of sufficient size to account for mounting and framing. This means the screen will need to be larger than the desired viewing area. Other size issues to consider include the type of framing to specify and whether the screen will fit through the doors of the building (because a rigid screen cannot be folded or broken down into separate pieces). The size will also factor into the size of the wall opening required for installation.
NOTE When specifying the size of a rear-projection screen, anticipate mounting requirements. Most screen manufacturers offer mounting and framing options. Remember, the frame will reduce the actual viewing area slightly. You will need to provide the general contractor (GC) with the “rough opening” size for your screen and frame assembly. Given the room dimensions and the preferred projector and lens, most screen manufacturers can help with screen recommendations, mirror assembly drawings, framing options, and more to make the design and installation go smoothly.
• Delivery Some screens will be larger than the doors to the space they’re intended for and should be delivered prior to wall completion. Rear-projection screens are delicate and must be protected if stored onsite while a space is being completed. If the screen is installed early in the construction process, it must be protected from accidental damage by other trades, using plywood, for example.
• The side that will face the audience There are two sides of a projection screen—the projector side and the audience side. Typically, the projector side is smooth and clear, while the audience side is rougher. Always refer to the manufacturer of the screen to identify which side is designed to face the audience. Failure to do so will reduce the quality of the image.
• Other attributes Rear-screen material can be lighter or darker in color. The darker the screen, the darker the blacks in an image will be. Whites will be less so, but overall contrast should improve. In addition, optical screens need to be matched to the lens of the projector because both have optical specifications. There are screens designed for short-throw projectors and other special applications.
Rear-Projection Design Considerations
A designer must consider a number of factors when designing a rear-projection system, including the following:
• Screen materials Diffusion rear-projection screens need to be specified with the required density, tinting, and protective coatings.
• Screen frames Frames of the appropriate type, finish, and size create borders around a rear-projection screen.
• Space requirements Because of the need for a rear-projection room, designers must determine whether the advantages are worth the amount of floor space required.
• Mirrors Mirror systems can help reduce the size of a rear-projection room, but they require more time and skill to design and install.
• Lens local length Short focal-length lenses can also help reduce the size of a rear-projection room. But they can also create distortion and reduce screen brightness compared to longer focal-length lenses, which create a straighter light throw that is more closely aligned with the viewers.
• Sources of light reflections Shiny objects in a rear-projection room can reflect light onto the screen and reduce viewability for the audience. All surfaces in the projection room need to be specified matte black, including doors and hardware.
Videowalls
A videowall features several monitors, video screens, display cubes, video projectors, or flat-screen TVs that are configured on top of each other or side by side to form a single, large, contiguous display.

Depending on the component technology used, a videowall can give clients a large display surface with uniform brightness and clarity that can be harder to accomplish with traditional, single-projector systems.
Because videowalls often comprise multiple smaller displays, they can be designed in many sizes and shapes, depending on the display environment. Not only will the size of the room dictate the size and shape of a videowall (a high or low ceiling, for example, is often a determining factor), but so will the available wall space. Available space will also determine the display technology used. One of the advantages of a videowall designed to incorporate flat-panel monitors, for example, is that it requires less physical space than a videowall that incorporates projection technology or video cubes, which are often deeper than flat panels.
When designing a videowall, it is important to specify displays that can be color matched in applications where one or few images will span multiple screens. Remember that the sum of the parts will need to appear as one display when all is said and done, so the reds on one screen need to match the reds on another.
In a simple videowall system, a videowall processor will take a single image and divide it among many screens. Alternately, the processor can route several different sources to different parts of the videowall. The processor maps the appropriate image (or portion of an image) to each display and synchronizes them. More advanced videowall processors can adjust the output image size for display on videowall screens that aren’t necessarily identical in shape or size.
Common Videowall Applications
The choice to design a videowall is driven by the application. Videowalls can be more expensive and intricate than more traditional video systems, so there should be a compelling reason to include one. That said, as video technology becomes better and less costly, more and more clients see videowalls as a way not only to accomplish their business goals but also to create visually engaging experiences—the “wow” factor. Here are some typical videowall applications:
• Digital signage
• Corporate lobbies
• Boardrooms
• Command-and-control centers
• Emergency operations centers
• Scientific visualization
• Simulation and training
• Sports bars
In general, videowalls are fertile ground for AV designers to be creative and tailor video solutions to their clients’ needs. Designers can mix and match technologies, screen orientations, source content, and more in unique solutions.
Videowall Design
Because videowalls can vary widely in their composition, it is especially important to understand what the client intends to use a videowall for. A videowall can be a significant investment, so a thorough needs analysis is needed to determine whether it’s the best solution for the video application. Many of the questions you will ask are similar to those for other video systems.
• How much room is there for a videowall?
• Is there an equipment closet or other space for processors, switchers, and so on, as necessary?
• What type of information will be displayed? Is any of it protected content?
• How many people will view it, and what will the room layout be?
• What and how many video sources will feed images to the videowall?
Most of the principles that dictate other video systems design also apply to videowall design. You will need to determine image specifications, viewing distances, and viewing angles. You will also need to take into account ergonomics and human factors (see Chapter 4). But videowalls also require some unique considerations, including but not limited to the following:
• Bezels Because they consist of individual screens, videowalls can include gaps or borders (mullions) where the screens come together. This is most prominent when flat-panel displays are used; projection displays and cubes don’t typically show noticeable gaps. It is important to determine from the client how much of a gap or border around screens will be tolerated. The more the client is trying to create a single, uninterrupted image, the more necessary it may be to specify displays with thin to no bezels—the frames that hold the screen in place. Videowall processors or technology built into many videowall screens can help compensate for gaps, which can make moving or still imagery look poor or unnatural when it spans multiple screens across bezels.
• Hours of operation Some videowalls are intended to be on 24/7—whether for digital signage or a command-and-control room. Knowing this will help guide your design. A more mission-critical videowall will require sturdier, reliable components. In addition, should there be a technical problem with one or more screens in a videowall, the client’s reliability requirements may guide you to a solution that is easier to maintain. For example, some videowall displays can be serviced from the front of the wall.
• Source inputs and processing Depending on the application, videowall sources—and their location—can vary greatly. In a more centralized design, the sources are local to the videowall and feed directly either into the processor (or, in the case of a simple videowall, directly into the displays) or into a switcher, or both. But videowall sources can also be remote, as in the case of an emergency operations center that needs to be able to patch in remote camera feeds to view situations in the field. In this case, the format of video sources can vary significantly, and they likely will be delivered over a network. Such a scenario may require a more distributed processing model.
• Blending Videowalls can include video from multiple projectors, combined to create one, seamless image. When this is the case, the projected images overlap at the edges. A video design that includes processing to blend those edges is necessary.
Videowalls are a rapidly emerging specialty of AV design. If, during the needs analysis, you and the client determine a videowall is a proper solution, you will determine other factors beyond the scope of this guide, such as screen orientation, wall composition, source resolutions and formats, pixel density, user control, and more.
Display Environment
Once you’ve performed image specification and display selection, the next step is to consider how the display environment will impact a video system. Mostly, this comes down to making calculated predictions and measurements about how light will affect your design. For example, you need to know how much reflected light might bounce off a screen and into viewers’ eyes. And you should be able to calculate precisely projector brightness given ambient light, screen area and gain, contrast ratio, and other factors. Much of how an AV design accounts for the display environment comes down to the designer’s understanding of light.
Measuring Light
When people first set out to quantify visible light, they chose a source that was familiar to be their standard—a candle. It was a specifically sized candle, made of a specific material, and molded in a specific way, but it was an ordinary candle nonetheless. The amount of light emitted from such a candle became the first and most fundamental unit of brightness. That unit is one candlepower.
Looking at a lit candle in the center of an otherwise darkened room, early scientists observed that light energy radiates equally in all directions, creating a sphere of light around the flame. They also observed that the farther you get from the flame at the center of the light sphere, the more the light energy is spread out, and the less the light appears to be shedding.
You may think of light in terms of AV systems, but light affects every aspect of a user’s experience in the environment. It is used for everything from reading and writing to walking through a building. You must therefore be able to measure and quantify the types of light in your environment.
Light is measured using two types of meters. An incident meter (also referred to as an illuminance meter) measures light coming directly from a source, such as a lightbulb, projector, or monitor. A spot meter (sometimes called a luminance meter) measures the light that is reflected off an object back to the meter and can vary based upon the attributes of the subject being measured.
Incident Light Measurements
Using an incident light meter, you can measure the brightness of an emitting light source. There are three units of measure that are commonly used in the audiovisual industry. See Figure 5-13.

Figure 5-13 Units of light measurement
• Lumens
• Footcandles
• Lux
Lumens is the most common measurement term used for describing light output from a projector or lightbulb. A lumen is a measure of the light quantity emitted from a constant light source across 1 square meter. Manufacturers state brightness measurements in lumens on their product literature. A higher lumen rating means a brighter displayed image.
NOTE Different organizations measure lumens by different methods. The most common standard for the lumen measurement worldwide is from the American National Standards Institute (ANSI). Officially, the two ANSI lumen standards, ANSI/NAPM IT7.228-1997 and ANSI/PIMA IT7.227-1998, were retired in July 2003. However, most manufacturers still use them today. The International Electrotechnical Commission has a similar standard, IEC 61947-1.
Footcandle (fc) is also a unit of measurement for direct light. It is an English unit of measurement expressing the intensity of light illuminating an object and describes the illumination from one candle falling on a surface of 1 square foot at a distance of 1 foot. Footcandles are customary U.S. measurements; one footcandle equals 10.78 lux.
Lux is a contraction of the words luminance and flux. One lux is equal to 1 lumen per square meter, or 0.093 footcandles. Again, 10.78 lux is equal to 1 footcandle. Lux is usually associated with metric measurements. Generally, the lux measurement is taken at a task area, which could be a video screen, note-taking location, or reading area.

TIP Lux and footcandle are units for the same measurement, just different metrics (like millimeters and inches).
Reflected Light Measurements
Originally, light measurements were based on a candle’s light output. Today, the candela, which is an SI unit, has replaced the candlepower standard.
The measurement of light reflected off a screen, the value of which depends on the intensity of the light and screen gain, is measured in candelas per meter squared (cd/m2). In fact, you can use the candela to measure the amount of light that is reflected off any surface. Candelas measure luminance. It differs from footcandles and lux because they measure reflected, not direct, light.
NOTE Technically, a candela is defined as the luminous intensity, in a given direction, of a source that emits monochromatic radiation of frequency 540×1012 hertz and that has a radiant intensity in that direction of 1/683 watt per steradian. (A steradian is a unit of solid angular measure—a conical shape in a sphere.)
Luminance and Illuminance
As you’ve learned, the way an AV system performs should be all about people. The human eye (and a video camera, for that matter) can react only to luminance. Luminance is the photometric quantity most closely associated with a person’s perception of brightness. It usually refers to the amount of light that reaches the eye of the observer measured in units of luminous intensity (candelas) per unit area (m2).
Luminance is the quantitative measure of the brightness of a light source or illuminated surface, measured in candelas per meter squared (cd/m2). It can be direct from a light source or from a reflective surface, and AV professionals measure it with a luminance meter.
Keep in mind that the luminance for a camera is not the same as for lighting. In video, luminance (Y) is the monochromatic, or black and white, picture information. The imager of a camera passes red, green, and blue color signals into the camera’s circuitry. The circuitry takes the three signals and combines them into a single luminance signal while also producing color difference signals.
Illuminance is light that falls on a surface, measured in footcandles (fc) or lux (lx). It is not visible to the human eye except in the form of reflected luminance. For designers, illuminance is expressed as IL-luminance or Incident Light-Luminance.
System Black
Projectors can’t project black light. Instead, a bright projected image tricks the brain into perceiving a black area by making whites brighter.
System black is the lowest level of luminance a system is capable of producing for a task under defined operating conditions. System black is defined by three parameters.
• The material of the display screen
• The ambient light level
• The light from the display with a solid black image input
Contrast Ratio
In the AV industry, the level of contrast between black and white in a displayed image is critical. A person who views a display needs to be able to distinguish clearly the edges of objects and the subtle changes of color that result from proper contrast. If the difference between black and white is not great enough, the resulting images are difficult to see and text is difficult to read.
Contrast ratio describes the dynamic video range of a display device as a numeric relationship between the brightest color (typically white) and the darkest color (typically black) that a system is capable of producing.
Ensuring a high-contrast ratio will make projected images appear crisper and seem to have more depth. High-contrast ratios will make reading text easier because viewers’ eyes will be able to find the edges of the characters.
A checkerboard pattern projected onto a screen shows eight areas of white and eight areas of black (see Figure 5-14). Using a light meter, AV professionals take measurements of the whites and blacks. When both sets of measurements are averaged and expressed as a ratio (white:black), you arrive at the contrast ratio.

Figure 5-14 Checkerboard pattern for measuring contrast ratio in accordance with ANSI/INFOCOMM 3M-2011 Projected Image System Contrast Ratio (PISCR) standard
According to the ANSI/INFOCOMM 3M-2011 standard (often referred to as PISCR), the formula for calculating contrast ratio is as follows:
Contrast Ratio = Luminance average max / Luminance average min
where:
• Luminance average max = the average level of luminance of all eight white squares
• Luminance average min = the average level of luminance of all eight black squares
ANSI/INFOCOMM 3M-2011
Because projected images are often the centerpiece of AV systems, the image contrast ratio is one of the most important criteria. The ANSI/INFOCOMM 3M-2011, Projected Image System Contrast Ratio (PISCR), standard was developed to ensure high-quality images.
This standard applies to front- and rear-projection systems. It defines four acceptable contrast ratios for various use cases, based on certain criteria within a space, including ambient room light. The following are the four contrast ratios:
• 7:1 for passive viewing
• 15:1 for basic decision making
• 50:1 for analytical decision making
• 80:1 for full-motion video (home theater)
The standard includes a set of simple measurements to verify that a system conforms to the desired contrast ratio of the viewing task. We will explore the PISCR standard in more detail in the following sections.
Five Viewing Positions
The ANSI/INFOCOMM 3M-2011 PISCR standard calls for taking measurements in five viewing locations: closest left and right, farthest left and right, and center. If there is an obstruction in the center, such as a table, designers should use the first available position behind the obstruction.
Designers—or during actual installation, AV technicians—should measure contrast ratio using a 16-position checkerboard test pattern and calculate the contrast ratio at each viewing location using a spot meter. See Figure 5-15.

Figure 5-15 Five viewing positions for measuring contrast ratio, according to the Projected Image System Contrast Ratio (PISCR) standard
Four Viewing Tasks
As mentioned earlier, the ANSI/INFOCOMM 3M-2011, Projected Image System Contrast Ratio (PISCR), standard defines four viewing categories. It’s important to understand what they are and how they relate to the needs analysis conducted for the AV space where the display systems will be located.
Passive Viewing
The viewer is able to recognize the images on a screen and can separate text or the main image from the background under typical lighting conditions for the viewing environment. The content does not require assimilation and retention of detail, but the general intent should be understood. There may be passive engagement with the content, such as noncritical or informal viewing of video or data. Passive viewing requires a minimum contrast ratio of 7:1.
Basic Decision Making
The viewer can make basic decisions based on the displayed image. The decisions are not dependent on critical details within the image, but it allows for the assimilation and retention of information. The viewer is actively engaged with the content, such as with information displays, presentations containing detailed images, classrooms, boardrooms, multipurpose rooms, and product illustrations. Basic decision making requires a minimum contrast ratio of 15:1.
Analytical Decision Making
The viewer can make critical decisions by analyzing details within the displayed image. The viewer is fully engaged with the details of the content, as in medical imaging, architectural/engineering drawings, forensic evidence, or photographic image inspection. Analytical decision making requires a minimum contrast ratio of 50:1.
Full-Motion Video
The viewer is able to discern key elements present in a video, including details included by the cinematographer or videographer necessary to support the story line and intent. This could be in a home theater, business screening room, or broadcast postproduction suite.
For more examples of where these viewing requirements are relevant, see the chart on page 19 of the standard (which has been copied into the instructor version of the ANSI/INFOCOMM contrast ratio activity). Full-motion video requires a minimum contrast ratio of 80:1.
3M Conformance
Standards conformance means you meet the conditions laid out in a standard. Conforming to the ANSI/INFOCOMM 3M-2011, Projected Image System Contrast Ratio (PISCR), standard means the contrast ratio of your display design matches the standard specifications from all viewing locations. Here’s a breakdown of conformance:
• Conforms The contrast ratios at all five measurement (viewing) locations meet or exceed the contrast ratios required by the identified viewing category.
• Partially conforms The contrast ratio of one location—but no more than four measurement (viewing) locations—falls below the required ratio for the identified viewing category by no more than 10 percent.
• Fails to conform The contrast ratio at any one of the measured locations falls below the identified viewing category by more than 10 percent.
Projector Positioning
Calculating the correct projector position can be complex. The formula for projector position depends on the specific equipment. Manufacturer specifications include instructions for positioning the gear.
Projection positioning calculations are usually made in three dimensions, as shown in Figure 5-16.

Figure 5-16 Projector position in relation to horizontal offset (x), vertical offset (y), and throw distance (z)
• x, the horizontal offset of the projector to the screen
• y, the vertical offset of the projector to the screen
• z, the throw distance
If you don’t have access to a manufacturer-specific formula, estimating the third variable, throw distance, can be useful all on its own. Estimating throw distance reveals how far away the projector needs to be from the screen. Your goal is to have an image fill the entire screen surface.
Projector Light Path
When designing a front-projection system, you need to make sure that the projector sightlines are unobstructed. Obstructions can be found in the ceiling, such as lighting fixtures, fire sprinklers, soffits, uneven ceiling, or loudspeakers. They’re also on the floor, in the form of standing or sitting people, lecterns, tables, and microphone stands.
If you know that a room will be used for presentations, place presenters and their lecterns out of the light path. Viewers may become frustrated if the image is frequently obscured by presenters. From the presenter’s point of view, staring at a bright projector bulb for an extended period of time will be uncomfortable.
Projection Throw
Throw distance refers to the distance that a specific combination of projector and lens needs to be from the projection screen to project a specific image size. Throw distance ratios can vary widely depending on the model, manufacturer, and lens type of a projector.
Manufacturers tend to have specific formulas that provide the best results for their projector and lens combination. Refer to the owner’s manual of your specific projector and lens combination to find the most accurate throw distance and projector position relative to the screen. The projector manual will contain the correct lens information and reference point of measurement (e.g., screen to front of lens). Remember that all lenses are not the same. Also, the distance from the projection screen may vary because screen size and lens zoom ratio will impact projector location. In addition, image processors within each projector can create images of different sizes.
The formula for estimating throw distance is as follows:
Distance = Screen width * Throw ratio
where:
• Distance is the distance from the front of the lens to the closest point on the screen.
• Screen width is the width of the projected image.
• Throw ratio is the ratio of throw distance to image width.
You may need to refer to the owner’s manual of your chosen projector and lens combination to find an accurate formula for your specific projector.
Let’s try the throw distance formula. Say a projector has an installed lens with a throw ratio of 2:1 (you’ll get that information from the manufacturer documentation). The width of the screen in the room is 72 inches. What’s the throw distance?
Distance = Screen width * throw ratio
Distance = 72 inches * 2
Distance = 144 inches
In metric, if the screen were 1830 mm with a throw ratio of 2:1, the calculation would be as follows:
Distance = Screen width * throw ratio
Distance = 1830 mm * 2
Distance = 3660 mm
And let’s try it again. A projector has an installed lens with a throw ratio of 2.5:1. The width of the screen in the room is 72 inches. What’s the throw distance?
Distance = Screen width * throw ratio
Distance = 72 inches * 2.5
Distance = 180 inches
In metric, let’s assume the same screen of 1830 mm, and a throw ratio of 2.5:1. What’s the throw distance?
Distance = Screen width * throw ratio
Distance = 1830 mm * 2.5
Distance = 4575 mm
Compare those two calculations. Notice that the screen width stays the same, but the throw ratio determines how far away the projector is from the screen.
TIP When using a lens that has a zoom feature, use two throw ratio calculations that provide the range from closest distance (minimum) to farthest distance (maximum) for a given combination of projector and zoom lens.
Predicting Projector Brightness
Image brightness is impacted by several factors.
• Brightness of screen
• Screen gain
• Lumen rating of the projector
• Age of projector lamp
• The lens aperture and f-stop settings
Designers will need to employ more math calculations to determine a suitable brightness level for a viewing environment. Let’s go over several of the factors that will go into brightness calculations.
Screen Gain
A projection screen is a passive device and does not have the capacity to amplify or create brightness. But the surface of a screen can focus reflected light to help increase projector brightness.
Screen gain is the ability of a screen to redirect projected light to make the image appear brighter within the viewer area. As a result of this ability, off-axis viewing is actually diminished. Screen gain refers to the amount of light reflected by the screen materials, not the amplification of light.
The higher the gain number of a screen, the brighter the picture viewed on-axis. When someone is seated within the good viewing area, a screen should provide uniform brightness over the entire image area, with no dim areas or hot spots.
Ambient light rejection generally increases as screen gain increases. This is because the light becomes more directional as screen gain increases and reflected ambient light appears outside the viewing cone.
NOTE Ambient light will have its own viewing cone, which should be outside the projected image’s viewing cone. If this is not the case, you’ll need to adjust the lights.
A gain of 1.0 refers to a matte white screen surface that does not absorb or channel light, is uniformly reflective, and can be seen from all directions. A glass-beaded screen that has a gain reading of 1.3 or 1.5 is highly reflective, less uniformly reflective, and has more hot spotting.
Hot Spotting
As gain increases, so does hot spotting. A hot spot is the part of a displayed image that is unevenly illuminated, usually appearing as a bright area in the center.
Hot spotting is caused by the properties of the screen surface. It manifests itself as a brighter area on the screen. For example, when shining a flashlight on a wall, the reflected spot is not of uniform brightness. The brightest area in that spot is the hot spot.
Screen manufacturers develop surfaces to yield high gain with minimal hot spotting. Hot spotting is one of the trade-offs for screen gain in front-projection screens and some rear-projection screens and is most noticeable when viewing a projected image off-axis.
Lamp Life
A projector’s brightness will be greatest on the first day of installation and decline over the life of the projector’s lamp (see Figure 5-17). Projector lamps become dimmer over time. When calculating light levels, you will need to account for derating the lumen specification of the projector. This will allow you to factor in the average amount of decay over the life of a projector lamp.

Figure 5-17 Lamp life derating over time. Operating hour figures are not displayed because each lamp is specified differently.
Lamp life is defined as the time it takes for a lamp to reach 50 percent of its initial light output. After or near the 50 percent point, not only will the lamp get dimmer, but its color temperature will change.
For the purposes of derating a projector’s specified lamp output, we select the halfway point between 100 percent and 50 percent brightness, or 75 percent. This means the projector should be derated by 25 percent of its specified brightness. The derating factor will be important to calculating a projector’s required brightness, which we will discuss in the section “Calculating Required Projector Brightness.”
Projector Lens
When a projector manufacturer writes its specifications, it usually describes the lens and electronics as a complete package. The projector’s lens has a specific f-stop, or focal ratio. This indicates the amount of light that is lost as it travels through the lens.
In case you select a lens that’s not the lens supplied with the projector, it is important to compare the new lens f-stop with that of the old lens. The difference in f-stops can mean the projector’s light output goes up or down. A full f-stop—going from f2 to f4, for instance—will cut the specified light output in half. Similarly, going from f8 to f4 will double your light output. Either way, if you don’t plan around the f-stop of a projector lens, it can lead to major issues with the system’s performance.
Ambient Light Levels
Figure 5-18 represents a simple display environment. The screen is a front-projection screen with a gain of 1. A projector is hung from the ceiling to project some amount of light on the screen. A lightbulb represents the task light required for the audience to see around the room and take notes. The other lightbulb represents all the ambient light that strikes the screen (lighting fixtures, sun, and light from the projected image that’s reflected around the room). When designing a display environment, there is natural competition between ambient light levels and the projector light levels as they impact the viewing area (the screen).
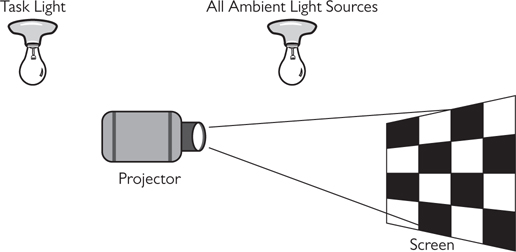
Figure 5-18 Sources of light in a projection environment
Reducing ambient light at the screen location is the most important element of creating a good contrast ratio for the projected image. It can also be the most difficult thing to do.
In new construction, communicate often with lighting designers and electrical contractors. These allied trades have more flexibility to control ambient lighting. The lighting designer will be able to give you the planned light levels so you can factor them into your projector brightness specifications. This is also an opportunity for you, as the AV designer, to discuss issues that are important to the AV design, such as screen placement, lighting zones, and dimming systems.
As a designer, it’s important that you develop an awareness of lighting levels by using a light meter on all projects. Taking accurate measurements and making specific recommendations will help you communicate your needs to allied trades.
Calculating Required Projector Brightness
When you select a projector, you need to make sure the one you choose is bright enough for your viewing environment. That means taking a number of variables into account.
Because most front screens are matte white finish, it is fairly easy to assume that the ambient light reading near the screen location will be nearly the same as a measurement of black at the screen. This is because a white screen can only get brighter when light is applied, but the screen can never become darker. So, with no light from the projector, what you have is a screen that is as black as it will ever be. To calculate what the white level would be with a contrast ratio of 15:1, for example, you simply multiply the black level by 15.
Once the white level and screen dimensions are known, you can find the rated projected output level. Just remember that you need to account for the projector lamp’s derating factor because of its loss of light output over its useful life.
When calculating projector brightness, your black level is a measurement of the ambient light at the screen. To achieve a 15:1 contrast ratio—or to know the white level—multiply the ambient light at the screen by 15 (note that this works only for a front matte white screen). Multiply the result by the area of the screen. Because the light is spread across the screen, you need to consolidate the light to the projector lamp. Divide the previous answer by the gain of the screen. You divide because the light will need to be less if the gain is higher; conversely, if the gain is low, you will need a brighter projector. Dividing the final result by (1 to 0.25) will increase the projector brightness to account for the lamp loss over its life.
The formula for required projector brightness is as follows:
Lumens = L * C * A SG/DR
where:
• Lumens = The required brightness of the projector in lumens.
• L = The ambient light level.
• A = The screen area.
• C = The required contrast ratio.
• SG = The gain of the screen. Assume a screen gain of 1 unless otherwise noted.
• DR = The projector derating value. Assume a derating value of 0.75 unless otherwise noted.
TIP Projectors are typically derated by 25 percent (1 – 0.25 = 0.75). DR is therefore typically equal to 0.75.
Measuring OFE Projector Brightness
As you see, it’s possible to calculate brightness requirements for a given application to specify a projector. However, how can you be sure that a projector you already have on hand (owner-furnished equipment, or OFE) is actually producing the amount of light needed? When using a client’s existing equipment in a design, you should test it to ensure it still meets its original specifications. Even the performance of new equipment should be verified.
Calculating the brightness of a fixed-resolution projector requires a light meter, which takes a reading of the received light and provides a value in lux or footcandles, and requires an ANSI lumens nine-zone graphic, projected on the screen. The amount of light energy delivered to the screen is measured in lumens. This is one of the primary issues when considering the amount of light that should be produced by the lamp for the viewing environment.
The ANSI method for determining lumens was developed to provide a standardized method of measuring the light output of projector lamps. This is the measurement detailed in most projector specifications. The ANSI standard was retired in 2003 and is now maintained by the International Electrotechnical Commission in standards 61947-1 and 61947-2.
Here is the formula for calculating the ANSI brightness of a screen:
Lumens = [(Z1+ Z2…Z9)/9] * (SH * SW)
• Zn = One of the nine zones on a screen (lux)
• SH = Height of the image (in feet or meters)
• SW = Width of the image (in feet or meters)
TIP When calculating projector brightness, your incident light and area measurements must match. If your light measurement is in lux, a metric unit, but your screen area measurement is in feet, a U.S. customary unit, you must convert square feet to square meters before calculating the required projector brightness. To do this, multiply square feet by 0.0929.
Task-Light Levels
The difference between the white levels of an image and a viewer’s work surface, or task area, should be within a range of three times greater and three times less than the white image. The purpose of keeping this level within three times is to keep eye strain at a minimum. Greater differences in the two light levels (projected and task) can cause a viewer’s iris to contract and dilate too often, causing eye strain and some discomfort.
In many cases, task lighting can raise the ambient light in the room. This is especially true if the task lighting is broadly directed and the room treatments (wall coverings, table surfaces, ceiling, and floor) reflect light to a large degree. In a properly designed room, the task-light measurements should be independent of the ambient-light measurements at the screen. Consider moving or directing light fixtures closer to the task area and away from the screen. Ideally, the lighting system would combine directed fixtures and a dimming controller.
Luminance differences are normally necessary for vision. Print, for instance, can be seen and interpreted because of the difference in luminance between the white page and the black print. In a display space, luminance variations are a function of both the reflectance of the surfaces and the distribution of light on those surfaces.
Large variations in luminance can be problematic. Office interiors should be lit to provide for good visibility with distracting glare. Direct and reflected glare should be avoided. However, it is important to provide enough variation in luminance (or color) to contribute to a stimulating, attractive environment. Where there are no prolonged visual tasks, as in lobbies, corridors, reception areas, and lounges, greater variations in luminance are a good idea, using attractive colors and appropriate focal points of high contrast to catch the eye.
In a working office environment, luminance near each task area and other parts of the office within the field of view should be balanced with task luminance. Two separate phenomena are influenced by luminance ratios within the field of view: transient adaptation and disability glare. To limit the effects of these phenomena, the luminance ratios generally should not exceed the following:
• Between paper task and adjacent screen 3:1 or 1:3
• Between task and adjacent dark surroundings 3:1 or 1:3
• Between task and remote (nonadjacent) surfaces 10:1 or 1:10
It is not, however, practical or aesthetically desirable to maintain these ratios throughout the entire environment. For visual interest and distant focus (for periodic eye muscle relaxation throughout the day), small visual areas that exceed the luminance-ratio recommendations are desirable. This would include artwork, accent finishes on walls, ceilings or floors, small window areas, accent finishes on chairs and accessories, and accent focal lighting.
Calculating Task-Light Levels
Once you know the projector brightness, you can solve for task lighting. The objective is to have a task-light level that is in a range of plus or minus three times the white level, in lux. Once you have selected a projector, you can find its lumen output within the projector’s specifications. From this, you can calculate how bright the white level should be on the screen.
The following are the formulas for task-light levels:
Task Lightupper = [(Lumens / A) * SG * DR] * 3
and
Task Lightlower= [(Lumens / A) * SG * DR ] / 3
where:
• Task Lightupper /Lightlower = The task-light levels at the top and bottom of the acceptable range
• Lumens = Specified projector brightness
• A = Area of the screen
• SG = Screen gain
• DR = 1 minus projector derating percentage
NOTE Remember to keep like measurements throughout your calculations. If the screen is in feet and you measure in footcandles, you will get the same answer as if you used a lux meter and a metric screen size.
Chapter Review
In this chapter, you studied the fundamental principles needed to determine image specifications, including text size, farthest and nearest viewers, and viewing area. All are critical components to consider early in your design.
With an understanding of image specifications, you’re ready for display selection. Available options include front-projection, rear-projection, and videowall systems. It is always important to remember how aspect ratios play a role in ensuring a quality image in your design.
Finally, you learned how environmental factors affect image quality and how to apply measurements to perfect your design. With the information you gained from this chapter, you can appropriately position and select equipment for your display design.
Review Questions
The following questions are based on the content covered in this chapter and are intended to help reinforce the knowledge you have assimilated. These questions are not extracted from the CTS-D exam nor are they necessarily CTS-D practice exam questions. For an official CTS-D practice exam, download the Total Tester as described in Appendix D.
1. A conference room requires videoconferencing and AV presentation capabilities. Which of the following design elements are defined by the architectural dimensions and orientation of the room?
A. Display size
B. Display type
C. Display aspect ratio
D. Display brightness
2. What is the recommended (highest) ambient lighting level illuminating a front-projection screen within a videoconferencing space?
A. 5 footcandles (50 lux)
B. 30 footcandles (108 lux)
C. 45 footcandles (161 lux)
D. 25 footcandles (215 lux)
3. If a font height is 2 in (50 mm), the screen height is 60 in (1,525 mm), and screen resolution is 1080 pixels high, what is the font size in pixels?
A. 28 point
B. 32 point
C. 36 point
D. 40 point
4. A matte white screen surface has a gain of _____.
A. 0.5
B. 0.75
C. 1.0
D. 1.25
5. A 16:9 screen will be installed in a lecture hall. The screen’s diagonal is 72 in (1,829 mm). What is its width?
A. 50 in (1270 mm)
B. 63 in (1594 mm)
C. 70 in (1778 mm)
D. 72 in (1829 mm)
6. If you have a projector that is 2500 ANSI lumens on a 5.5 m2 standard matte white screen, what should be the limits of the task lighting? Note that the projector specification is derated by 25 percent.
A. 113.6 to 1022.7 lux
B. 120 to 175 lux
C. 515 to 1001 lux
D. 527 to 632 lux
7. Lamp life is defined as the time it takes for a lamp to reach _____ percent of initial output.
A. 10
B. 25
C. 50
D. 75
8. You need to project an image that has a 4:3 aspect ratio. You measure the screen height and determine that it is 2,286 mm high and 3,048 mm wide. Can you use this screen for the 4:3 image?
A. Yes
B. No
C. Not enough information to determine
D. All of the above
9. You require a 16:9 screen with a height of 60 in (1,524 mm). What will the screen’s diagonal be?
A. 90 in
B. 1,524 mm
C. 3,109 mm
D. 100 in
10. In videowall design, __________ is the process of adjusting for the edges of multiple projected images.
A. Blending
B. Pixel mapping
C. Processing
D. Orienting
Answers
1. A. For visual systems, the architectural dimensions and orientation of the room will determine display size.
2. A. The highest recommended ambient lighting level for a front-projection screen in a videoconferencing space is 5 footcandles, or 50 lux.
3. C. In this case, 2/60 = X/1080. Cross multiply and divide to arrive at 36 pixels, or a 36-point font.
4. C. A matte white screen surface has a gain of 1.0.
5. B. Width/diagonal = Width ratio/diagonal ratio, and width/72 = 16/18.36. Therefore, width = 63, rounded to the nearest inch.
6. A. Task light = [(2500/5.5) * 1 * (1 – 0.25)]. For the upper limit, multiply by 3; for the lower limit, divide by 3. Your task-light range is 113.6 to 1022.7 lux.
7. C. Lamp life is defined as the time it takes for a lamp to reach 50 percent of initial output.
8. A. Yes, because 3,048:2,286 is the same as 4:3, or 3,048/2,286 = 4/3.
9. C. At 16:9, length = 106.7 inches; 602 + 106.72 = C2; C = 122.4 inches, or 3,109 mm.
10. A. In videowall design, blending is the process of adjusting for the edges of multiple projected images.