Chapter 4
Capital employed and invested capital
The end-of-period snapshot
So far in our analysis, we have looked at inflows and outflows, or revenues and costs during a given period. We will now temporarily set aside this dynamic approach and place ourselves at the end of the period (rather than considering changes over a given period) and analyse the balances outstanding.
For instance, in addition to changes in net debt over a period, we also need to analyse net debt at a given point in time. Likewise, we will study here the wealth that has been accumulated up to a given point in time, rather than that generated over a period.
The balance represents a snapshot of the cumulative inflows and outflows previously generated by the business.
To summarise, we can make the following connections:
- an inflow or outflow represents a change in “stock”, i.e. in the balance outstanding;
- a “stock” is the arithmetic sum of inflows and outflows since a given date (when the business started up) through to a given point in time. For instance, at any moment, shareholders’ equity is equal to the sum of capital increases by shareholders and annual net income for past years not distributed in the form of dividends plus the original share capital.
Section 4.1 The balance sheet: definitions and concepts
The purpose of a balance sheet is to list all the assets of a business and all of its financial resources at a given point in time.
1. Main items on a balance sheet
Assets on the balance sheet comprise:
- fixed assets,1 i.e. everything required for the operating cycle that is not destroyed as part of it. These items retain some value (any loss in their value is accounted for through depreciation, amortisation and impairment losses). A distinction is drawn between tangible fixed assets (land, buildings, machinery, etc.),2 intangible fixed assets (brands, patents, goodwill, etc.) and investments. When a business holds shares in another company (in the long term), they are accounted for under investments;
- inventories and trade receivables, i.e. temporary assets created as part of the operating cycle;
- lastly, marketable securities and cash that belong to the company and are thus assets.
Inventories, receivables,3 marketable securities and cash represent the current assets, a term reflecting the fact that these assets tend to “turn over” during the operating cycle.
Resources on the balance sheet comprise:
- capital provided by shareholders, plus retained earnings, known as shareholders’ equity;
- borrowings of any kind that the business may have arranged, e.g. bank loans, supplier credits, etc., known as liabilities.

By definition, a company’s assets and resources must be exactly equal. This is the fundamental principle of double-entry accounting. When an item is purchased, it is either capitalised or expensed. If it is capitalised, it will appear on the asset side of the balance sheet, and if expensed, it will lead to a reduction in earnings and thus shareholders’ equity. The double-entry for this purchase is either a reduction in cash (i.e. a decrease in an asset) or a commitment (i.e. a liability) to the vendor (i.e. an increase in a liability). According to the algebra of accounting, assets and resources (equity and liabilities) always carry the opposite sign, so the equilibrium of the balance sheet is always maintained.
It is European practice to classify assets starting with fixed assets and to end with cash,4 whereas it is North American and Japanese practice to start with cash. The same is true for the equity and liabilities side of the balance sheet: Europeans start with equity, whereas North Americans and Japanese end with it.
A “horizontal” format is common in continental Europe, with assets on the left and resources on the right. In the UK, the more common format is a “vertical” one, starting from fixed assets plus current assets and deducting liabilities to end up with equity. These are only choices of presentation.
2. Two ways of analysing the balance sheet
A balance sheet can be analysed either from a capital-employed perspective or from a solvency-and-liquidity perspective.
In the capital-employed analysis, the balance sheet shows all the uses of funds for the company’s operating cycle and analyses the origin of its sources of funds.
A capital-employed analysis of the balance sheet serves three main purposes:
- to illustrate how a company finances its operating assets (see Chapter 12);
- to compute the rate of return either on capital employed or on equity (see Chapter 13); and
- as a first step to valuing the equity of a company as a going concern (see Chapter 31).
In a solvency-and-liquidity analysis, a business is regarded as a set of assets and liabilities, the difference between them representing the book value of the equity provided by shareholders. From this perspective, the balance sheet lists everything that a company owns and everything that it owes.
A solvency-and-liquidity analysis of the balance sheet serves three purposes:
- to measure the solvency of a company (see Chapter 14);
- to measure the liquidity of a company (see Chapter 12); and
- as a first step to valuing its equity in a bankruptcy scenario.

Section 4.2 A capital-employed analysis of the balance sheet
To gain a firm understanding of the capital-employed analysis of the balance sheet, we believe it is best approached in the same way as the analysis in the previous chapter, except that here we will be considering “stocks” rather than inflows and outflows.
More specifically, in a capital-employed analysis, a balance sheet is divided into the following main headings.
1. Fixed assets, also called non-current assets
These represent all the investments carried out by the business, based on our financial and accounting definition.
It is helpful to distinguish wherever possible between operating assets and non- operating assets that have nothing to do with the company’s business activities, e.g. land, buildings and subsidiaries active in significantly different or non-core businesses. Non-operating assets can thus be excluded from the company’s capital employed. By isolating non-operating assets, we can assess the resources the company may be able to call upon in hard times (i.e. through the disposal of non-operating assets).
The difference between operating and non-operating assets can be subtle in certain circumstances. For instance, how should a company’s head office on Bond Street or on the Champs-Elysées be classified? Probably under operating assets for a fashion house or a car manufacturer, but under non-operating assets for an engineering or construction group which has no business reason to be on Bond Street (unlike Burberry).
2. Operating working capital
Operating working capital is the difference between uses of funds and sources of funds linked to the daily operations of a company.
Uses of funds comprise all the operating costs incurred but not yet used or sold (i.e. inventories) and all sales that have not yet been paid for (trade receivables).
Sources of funds comprise all charges incurred but not yet paid for (trade payables, social security and tax payables), as well as operating revenues from products that have not yet been delivered (advance payments on orders).
The net balance of operating uses and sources of funds is called the working capital.
If uses of funds exceed sources of funds, the balance is positive and working capital needs to be financed. This is the most frequent case. If negative, it represents a source of funds generated by the operating cycle. This is a nice – but rare – situation!
It is described as “working capital” because the figure reflects the cash required to cover financing shortfalls arising from day-to-day operations.
Sometimes working capital is defined as current assets minus current liabilities. This definition corresponds to our working capital definition + marketable securities and net cash – short-term financial and banking borrowings. We think that this is an improper definition of working capital as it mixes items from the operating cycle (inventories, receivables, payables) and items from the financing cycle (marketable securities, net cash and short-term bank and financial borrowings). You may also find in some documents expressions such as “working capital needs” or “requirements in working capital”. These are synonyms for working capital.
Operating working capital comprises the following accounting entries:
| Inventories | Raw materials, goods for resale, products and work in progress, finished products | |
| + | Trade receivables | Amounts owed by customers, prepayments to suppliers and other trade receivables |
| − | Trade payables | Amounts owed to trade suppliers, social security and tax payables, prepayments by customers and other trade payables |
| = | Operating working capital |
Only the normal amount of operating sources of funds is included in calculations of operating working capital. Unusually long payment periods granted by suppliers should not be included as a component of normal operating working capital.
Where it is permanent, the abnormal portion should be treated as a source of cash, with the suppliers thus being considered as playing the role of the company’s banker.
Inventories of raw materials and goods for resale should be included only at their normal amount. Under no circumstances should an unusually large figure for inventories of raw materials and goods for resale be included in the calculation of operating working capital.
Where appropriate, the excess portion of inventories or the amount considered as inventory held for speculative purposes can be treated as a high-risk short-term investment.
Working capital is totally independent of the methods used to value fixed assets, depreciation, amortisation and impairment losses on fixed assets. However, it is influenced by:
- inventory valuation methods;
- deferred income and cost (over one or more years);
- the company’s provisioning policy for current assets and operating liabilities and costs.
As we shall see in Chapter 5, working capital represents a key principle of financial analysis.
3. Non-operating working capital
Although we have considered the timing differences between inflows and outflows that arise during the operating cycle, we have, until now, always assumed that capital expenditures are paid for when purchased and that non-recurring costs are paid for when they are recognised in the income statement. Naturally, there may be timing differences here, giving rise to what is known as non-operating working capital.
Non-operating working capital, which is not a very robust concept from a theoretical perspective, is hard to predict and to analyse because it depends on individual transactions, unlike operating working capital, which is recurring.
In practice, non-operating working capital is a catch-all category for items that cannot be classified anywhere else. It includes amounts due on fixed assets, extraordinary items, etc.
4. Capital employed
Capital employed is the sum of a company’s fixed assets and its working capital (i.e. operating and non-operating working capital). It is therefore equal to the sum of the net amounts devoted by a business to both the operating and investing cycles. It is also known as operating assets.
Capital employed is financed by two main types of funds: shareholders’ equity and net debt, sometimes grouped together under the heading of invested capital.
5. Financial resources or invested capital
Capital employed is financed by two financial resources: shareholders’ equity and net debt.
Shareholders’ equity comprises capital provided by shareholders when the company is initially formed and at subsequent capital increases, as well as capital left at the company’s disposal in the form of earnings transferred to the reserves.
The company’s gross debt comprises debt financing, irrespective of its maturity, i.e. medium- and long-term (various borrowings due in more than one year that have not yet been repaid), and short-term bank or financial borrowings (portion of long-term borrowings due in less than one year, discounted notes, bank overdrafts, etc.). A company’s net debt goes further by deducting cash and equivalents (e.g. petty cash and bank accounts) and marketable securities, which are the opposite of debt (the company lending money to banks or financial markets), that could be used to partially or totally reduce the gross debt.
All things considered, the equation is as follows:
| Medium- and long-term bank and other borrowings (bond issues, commitment under finance lease, etc.) | |
| + | Short-term bank or financial borrowings (discounted notes, overdrafts, revolving credit facility, etc.) |
| − | Marketable securities (marketable securities) |
| − | Cash and equivalents (petty cash and bank accounts) |
| = | Net debt |
A company’s net debt can be either positive or negative. If it is negative, the company is said to have net cash.
In the previous paragraphs, we looked at the key accounting items, but some are a bit more complex to allocate (pensions, accruals, etc.) and we will develop these in Chapter 7.
From a capital-employed standpoint, a company balance sheet can be analysed as follows:

Section 4.3 A solvency-and-liquidity analysis of the balance sheet
The solvency-and-liquidity analysis of the balance sheet, which presents a statement of what is owned and what is owed by the company at the end of the year, can be used:
- by shareholders to list everything that the company owns and owes, bearing in mind that these amounts may need to be revalued;
- by creditors looking to assess the risk associated with loans granted to the company. In a capitalist system, shareholders’ equity is the ultimate guarantee in the event of liquidation since the claims of creditors are met before those of shareholders.
Hence the importance attached to a solvency-and-liquidity analysis of the balance sheet in traditional financial analysis. As we shall see in detail in Chapters 12 and 14, it may be analysed from either a liquidity or a solvency perspective.
1. Balance sheet liquidity
A classification of the balance sheet items needs to be carried out prior to the liquidity analysis. Liabilities are classified in the order in which they fall due for repayment. Since balance sheets are published annually, a distinction between the short term and the long term turns on whether a liability is due in less than or more than one year. Accordingly, liabilities are classified into those due in the short term (less than one year), in the medium and long term (more than one year) and those that are not due for repayment.
Likewise, what the company owns can also be classified by duration as follows:
- assets that will have disappeared from the balance sheet by the following year, which comprise current assets in the vast majority of cases;
- assets that will still appear on the balance sheet the following year, which comprise fixed assets in the vast majority of cases.
From a liquidity perspective, we classify liabilities by their due date, investments by their maturity date and assets as follows:
Thus they comprise (unless the operating cycle is unusually long) inventories and trade receivables.
Balance sheet liquidity therefore derives from the fact that the turnover of assets (i.e. the speed at which they are monetised within the operating cycle) is faster than the turnover of liabilities (i.e. when they fall due). The maturity schedule of liabilities is known in advance because it is defined contractually. However, the liquidity of current assets is unpredictable (risk of sales flops or inventory write-downs, etc.). Consequently, the clearly defined maturity structure of a company’s liabilities contrasts with the unpredictable liquidity of its assets.
Therefore, short-term creditors will take into account differences between a company’s asset liquidity and its liability structure. They will require the company to maintain current assets at a level exceeding that of short-term liabilities to provide a margin of safety. Hence the sacrosanct rule in finance that each and every company must have assets due to be monetised in less than one year at least equal to its liabilities falling due within one year.
2. Solvency
In accounting terms, a company may be regarded as insolvent once its shareholders’ equity turns negative. This means that it owes more than it owns.
Sometimes, the word solvency is used in a broader sense, meaning the ability of a company to repay its debts as they become due (see Chapter 12).
3. Net asset value or the book value of shareholders’ equity
This is a solvency-oriented concept that attempts to compute the funds invested by shareholders by valuing the company as a difference between its assets and its liabilities. Net asset value is an accounting and, in some instances, tax-related term, rather than a financial one.
The book value of shareholders’ equity is equal to everything a company owns less everything it already owes or may owe. Financiers often talk about net asset value, which leads to confusion among non-specialists, who can construe them as total assets net of depreciation, amortisation and impairment losses.
Book value of equity is thus equal to the sum of:
| Fixed assets | |
| + | Current assets |
| − | All liabilities of any kind |
When a company is sold, the buyer will be keen to adopt an even stricter approach:
- by factoring in contingent liabilities (that do not appear on the balance sheet);
- by excluding worthless assets, i.e. of zero value. This very often applies to most intangible assets owing to the complexity of the way in which they are accounted for (see Chapter 7).
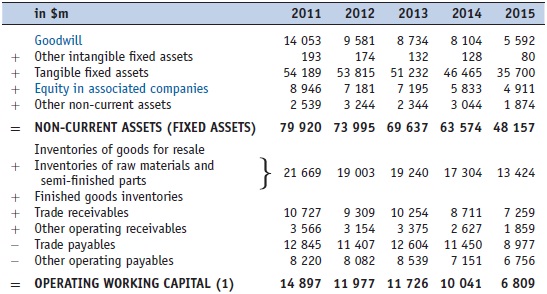
Section 4.4 A detailed example of a capital-employed balance sheet
Here we present the capital-employed balance sheet of the ArcelorMittal group, the world steel leader. This balance sheet will be used in future chapters.
Items specific to consolidated accounts are highlighted in blue and will be described in detail in Chapter 6.
BALANCE SHEET FOR ARCELORMITTAL