In This Chapter
Comparing absolute and conditional formatting
Enhancing readability with Highlighting Expert
Inserting a picture into a report
Working with preprinted forms
Importing text-based objects from a file
Using the Formatting Options dialog box
Adding special fields to a report
Emphasizing important information with Report Alerts
Speeding development with report templates
Formatting is the primary reason for the existence of Crystal Reports — or any report-writing software, for that matter. Any ol' database management system (DBMS) can retrieve results from a database and then display or print them. The primary purpose of a DBMS is to maintain data. Putting retrieved results in the most understandable form isn't the DBMS vendor's job.
Crystal Reports offers you a comprehensive, creative array of tools that you can use to excel at transforming the raw data retrieved from a DBMS into a report that communicates your data to your desired audience. To achieve your goals, use the full power of formatting in Crystal Reports to shape the appearance of any report you generate, which allows you to create the desired impression for your readers.
In this chapter, I compare absolute and conditional formatting, showing you the advantages of using one or the other. I go on to describe the Crystal Reports formatting tools at your disposal, including Highlighting Expert, Report Alerts, and Report Templates.
Absolute formatting is the regular kind of formatting that you can apply to text and fields with Crystal Reports in your quest to present data the best way for your audience. After you apply absolute formatting, the format is fixed, regardless of the values of the data making up the content of the report.
Warning
I also want you to note the following, which is both a good and a bad thing about using absolute formatting: After you set a format with absolute formatting, the format is fixed unless you change it from the Design tab or Format Editor. Every time you run the report, the formatting is the same.
Absolute formatting can comprise setting how elements and text look — fonts, font color, centered or bold text, and so on — as well as how certain elements are presented, such as a date format.
Sure, the report might show what you want, but consider giving the report more visual appeal by changing the fonts of various report elements. A change as simple as making the text bold is a snap. Just select the text you want to change (in Design view, double-click the text box) and then click whatever formatting icon you want (say, Bold) from the Formatting toolbar.
Choosing the best font for the job, though, takes a little more consideration. You want the data presented in your report to be as clear, informative, readable, and attractive as possible. With that in mind, take the following into consideration:
Readability
Choose a font that is easy on the eyes. The tried-and-true fonts, such as Times New Roman and Arial, are pretty safe choices.
Choosing a font couldn't be much more easy. Just select the font you want from the appropriate pane at the left end of the formatting toolbar. If you don't like what you see, it is easy to choose another.
Viewer-available
Choose fonts that are likely available on all the computers and printers used by the people who view the report.
Warning
If viewers don't have the same fonts loaded on their machines, Crystal Reports substitutes the one that it thinks is the closest to what you have specified. To see the most common fonts — the ones I recommend that you use to assure universally readable reports — see Table 8-1.
Appropriate
Choose fonts that fit your report. As I mention earlier in the book, you probably want to stick with something staid for a standard corporate presentation. However, if your business is a little on the adventurous side, you can get away with something sharper. Just envision your audience, and make sure that avante garde doesn't mean unreadable.
Color
Don't overlook using a color for your font. Color can really make a heading or a block of text stand out and command attention. Of course, that assumes that your viewer will be seeing this in color (not a problem in a slideshow or an online venue) or printing in color (a little more risky). Just remember to make the font color harmonize with whatever background color you choose. Of course, black text on a white background is very readable, and black text on a yellow background is supposed to be the most readable combination available. If you really want something to stand out in red text, though, avoid using that fuchsia background that caught your eye.
Here's how to change font color:
You can certainly mix and match fonts — to a point. Generally accepted design rules call for using sans serif fonts (without serifs, like Arial) for major headings and serif fonts (such as Times New Roman) for body text. Don't get carried away and use a lot of fonts, styles, colors, and sizes just because you can. Too jumbled an appearance gives you report an amateur look. On the other hand, using the same font for a repeated element adds an air of professionalism and continuity to your reports, giving readers a visual cue as to what a section will contain.
Size
Common sense will see you through this choice. Choose larger sizes for headings, smaller for subordinate headings, and smaller still for body text.
Table 8-1. Safe, Common Fonts
Name | Looks Like This |
|---|---|
Times New Roman | Times New Roman |
Arial | Arial |
Courier New |
|
Bookman Old Style | Bookman Old Style |
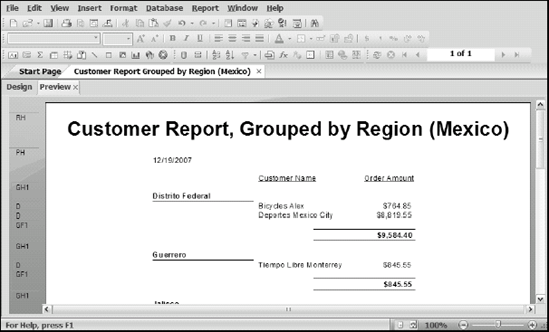
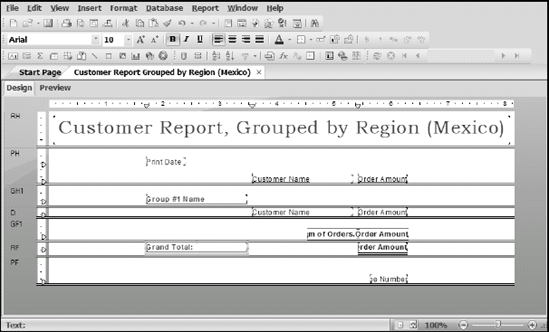
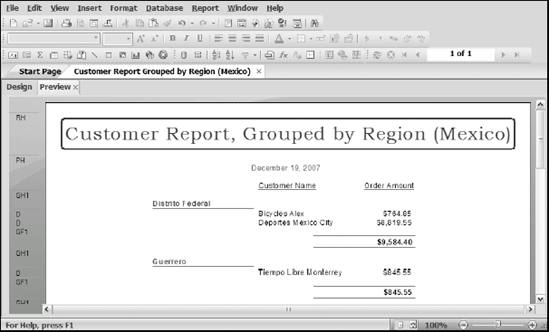
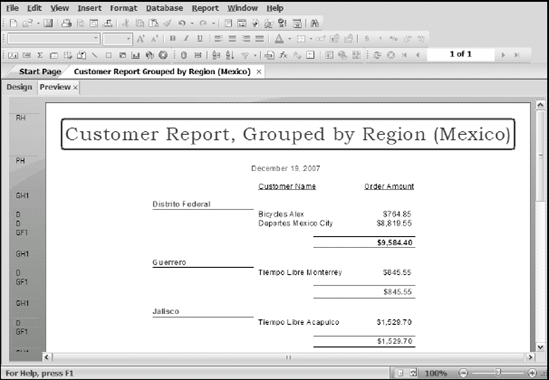
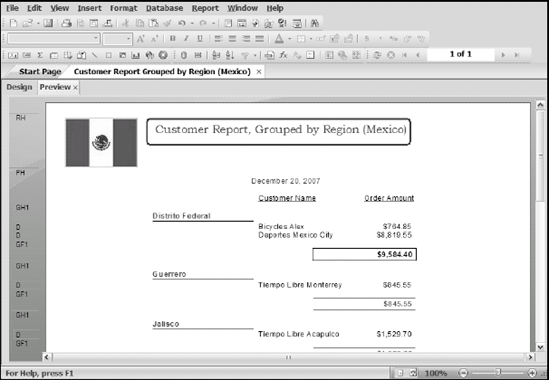
In this section, I show you how to tinker with the formatting in the Customer Report, Grouped by Region (Mexico), which is one of the reports from Chapter 6. The report is shown in Figure 8-1.
Sure, the report shows what you want, but consider giving the report more visual appeal by changing the fonts of various report elements. For example, alter the report title:
In Design view, click the report title.
From the contextual menu that appears, right-click the text to activate Edit Text mode, and then select the entire title.
From the Formatting toolbar, choose one or more of the fonts available on your machine to give the report title a different look.
Warning
Make sure that whatever font you choose is also available on all the computers and printers used by the people who view the report. This is not a problem if you work in an organization where everyone has the same standard software on their machine. In a more diverse environment, you might have to give some thought to what might be running on your target audience's machines. Alternatively, you could play it safe and stick to the fonts listed in Table 8-1.
Select the style, size, and color of the font.
In the present case, the style (bold, italic, and so on) and size are fine, but you might want to experiment with font color to get the look you want. Here's how:
Right-click the text you want to change.
Choose Format Text to display the Format Editor.
On the Font tab, choose whatever as the font color.
Figure 8-2 shows the report at this point (in black and white).
I chose the Bookman Old Style font face — a distinctive font, available on Windows machines — for the report title. I chose green as the color for the report title, date, grand total in the report footer, and the group headers. You can't see that in this book, but the color change adds some contrast to the report, grabbing more of the reader's attention.
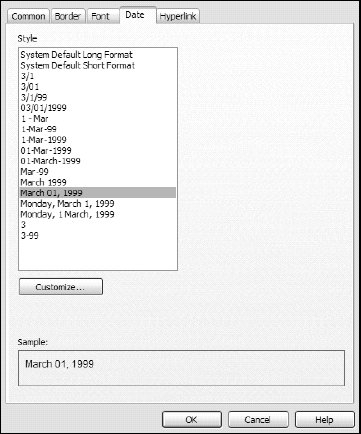
I think that centering the date is a good idea. You might also want to change the date format. Crystal Reports provides a presentable default format — March 08, 2008 — but you can choose from many others: for example, 08-Mar-2008. Figure 8-3 shows the Date tab of Format Editor with a longer date format selected.
Another technique you can use to improve the visual appeal of your reports is to add graphical elements (such as lines and boxes) for emphasis. For example, set off the report title from the body of the report by enclosing it in a box. Follow these steps to see how it changes the visual impact of a report:
Give the title some more vertical space, to make room for the outlining box.
Expand the Report Header section: In Design view, drag down the lower border of the Report Header section about ¼ inch.
Center the report title vertically in the Report Header section.

The cursor changes to a pencil.
Draw a box around the title by clicking and holding over one corner, dragging diagonally to the opposite corner, and releasing the mouse button.
After you draw the box, you can format it.
Click the box to select it; then right-click it and choose Format Box.
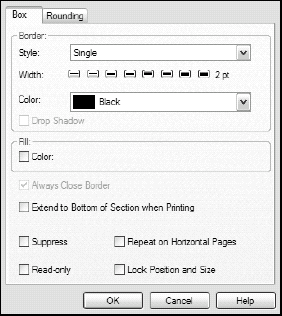
Format Editor appears, as shown in Figure 8-4.
From the Box tab, select a line thickness and a color (or other options, if you like).
I chose a medium thickness for the line and green as the color.
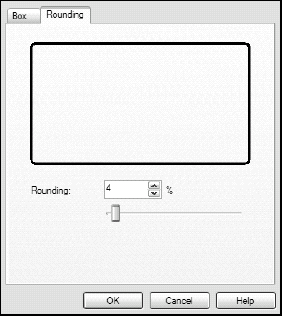
(Optional) Click the Rounding tab, and then choose the amount of rounding.
Use settings on the Rounding tab to round the box corners to whatever extent you like, all the way from a rectangle to a circle. I selected a little bit of rounding (4%), as shown in Figure 8-5.
See the result in Figure 8-6. It's a substantial improvement over the first version, which was created automatically by the Standard Report Creation Wizard.
In contrast to absolute formatting (which is fixed after you complete a report's design), you use conditional formatting to vary the appearance (or even the presence or absence) of a particular field, depending on the value contained in the field. From these choices, you get greater flexibility in how you can help your report's audience focus on relevant details.
For example, Xtreme (the company in the sample database used for this book) might want to draw attention to underperforming regions by coloring group totals red for all states or districts that have cumulative orders less than $2,000. A state might qualify for a red group total one month but (through additional sales) earn the right to a black group total the following month.
To demonstrate how to add conditional formatting to a report, use the Mexico Orders report from the preceding section and add the condition that group totals less than $2,000 should show as red rather than black.
Switch to Design view.
In the Group Footer section, right-click the Sum of Orders.Order Amount field and choose Format Field from the contextual menu that appears.
Format Editor appears.
Click the Font tab.
You can see that the default color is black, which is the color you want most of the time, but not this time.

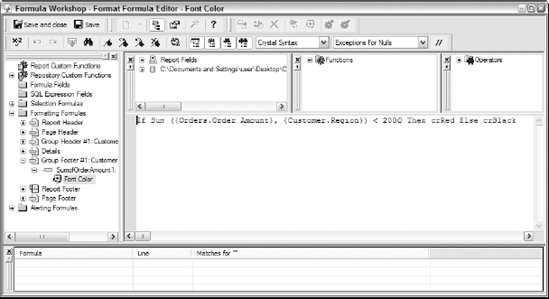
The Format Formula Editor dialog box appears, as shown in Figure 8-7. Comments list the available color names.
Expand the Report Fields node in the first of the three panes above the work area, so the items shown in Figure 8-7 are visible.
Build the formula shown in Figure 8-7.
To do so, type the keyword If. Then double-click the Σ Group #1 line in the Report Fields node (in the upper-left pane above the work area). Complete the formula by typing the following:
< 2000 Then Red Else Black
The final formula should look like this:
If Sum ({Orders.Order Amount}, {Customer.Region}) < 2000 Then crRed Else crBlackClick the Save and Close button in Format Formula Editor.
Click OK in Format Editor.
Preview mode now displays the report in Figure 8-8. State totals of less than $2,000 are displayed in red, and all totals greater than $2,000 are shown in black.
Format Formula Editor is a powerful tool that you can use for creating complex conditions that govern what's shown on a report as well as how it prints. To maximize the capabilities of this editor, though, you need to know either the default formula-language syntax used in Crystal Reports or the BASIC language syntax. You can type a formula by hand or build it up by selecting fields, functions, and operators from the panes in the top half of the Editor.
There is, however, an easier way to get some of the features of Format Formula Editor — and without learning formula syntax: Use Highlighting Expert, coming up next.
Highlighting Expert is one of the easiest-to-use formatting tools in the Crystal Reports repertoire. Compared with Format Formula Expert, Highlighting Expert has limited flexibility, but you could use it instead of a formula to get the same red group total in the preceding section. Here's a major difference to note: Highlighting Expert operates only on number and currency fields; Format Formula Editor works on any type of field.
To see Highlighting Expert in action, follow these steps:
Click the Design tab of the Customer Report shown earlier in Figure 8-8.
In the Group Footer section, right-click the Sum of Orders.Order Amount field and choose Highlighting Expert from the contextual menu that appears.
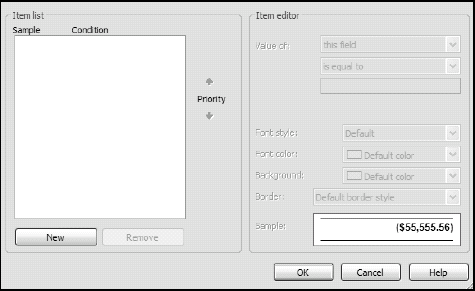
The Highlighting Expert dialog box appears, as shown in Figure 8-9.
You can change the font color, the background color, or the border of the selected item. For this example, put a single-line box around all state or district order totals equal to or greater than $5,000.
Click the New button.
In the Value of This Field box, select is greater than or equal to. In the text box below Value of, enter $5,000.00.
In the Border box, select Single box.
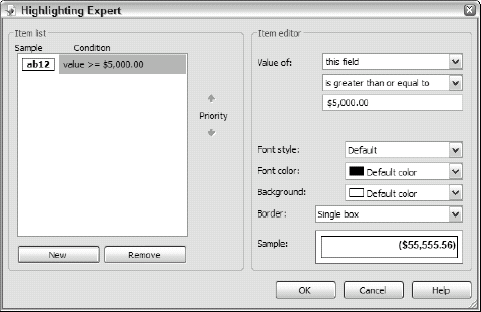
The Highlighting Expert dialog box now appears, as shown in Figure 8-10.
Click OK.
These settings produce the report shown in Figure 8-11. The total for Distrito Federal is enclosed in a box because its value is greater than $5,000. The other group totals are unchanged.

You can add graphical images to a report to further enhance its visual appeal. You can even add Flash animations. I cover Flash animations and the interactivity that is possible with them in Chapter 17. Here I stick to talking about static pictures.
To add a picture — bitmapped graphic images — to your report, follow these steps:
Make sure you have space where you want to place the image.
I'm putting a Mexican flag in the report header. Unfortunately, I didn't think of this earlier and filled the report header with the report title. This isn't a problem, though. I just change the title to a smaller font and then redraw the box around the title, freeing up space for the flag. (You can read how to change the box and reset the box size earlier in this chapter.)

From the dialog box that appears, select the appropriate image file.
On the report, a rectangle appears that you can move around with the mouse.
Position the rectangle where you want the image to be located, and then click.
The image appears on the report. Figure 8-12 shows the result of placing a Mexican flag in the report. The flag image was a little too tall to fit in the report header, but when I released the mouse button, the report header expanded just enough to hold the image.
Save the report as Customer Orders by State or District (Mexico).
You now have a report fit for the eyes of a Vice President of Sales!
Preprinted forms are designed to be filled out by hand or run through a sprocket-fed line printer. When using a laser or inkjet printer, it's devilishly hard to line up text with the lines and boxes on the form that are supposed to hold that text. Most people are more likely to have a laser or inkjet printer than a sprocket-fed printer these days, so alignment can be a problem.
Crystal Reports offers a clever solution to aligning text to preprinted forms. Because a report can have both text and graphical elements, and one can overlie the other, you can align text perfectly to a preprinted form by following a few simple steps involving a scanner:
Scan the preprinted form and save it as a bitmapped file.
Place the scanned form in the Page Header section of the report as a bitmap.
Select the Underlay Following Sections option on Section Expert's Common tab.
Add text fields in the appropriate places of the Details section to line up with the form.
Both the form and the data print in one operation.
Crystal Reports is primarily designed to take data from a database, process it, format it, and then display it to the user. However, it can also display blocks of text from document files. You can control the formatting of the text block by sizing the text object that you insert it into.
To insert a block of text into a report, follow these steps:
Insert a text object into the report at the location where you want the text to appear.
Right-click the object and choose Insert from File from the contextual menu that appears.
An Open dialog box appears, listing files in whatever directory was accessed last.
Find the directory that has the file you want to insert.
Click Open.
The text file is transferred to the text object.
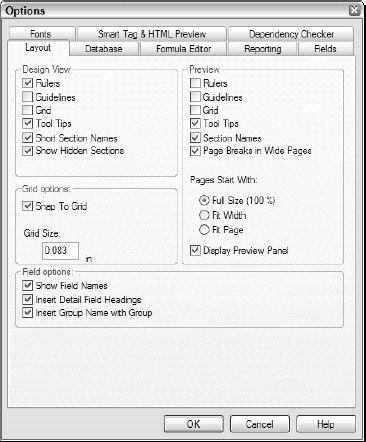
Report developers can customize the development environment from settings available on the Options dialog box (see Figure 8-13).
To open this dialog box, just choose File
Layout: Select what will be displayed on the work surface in both Design and Preview modes.
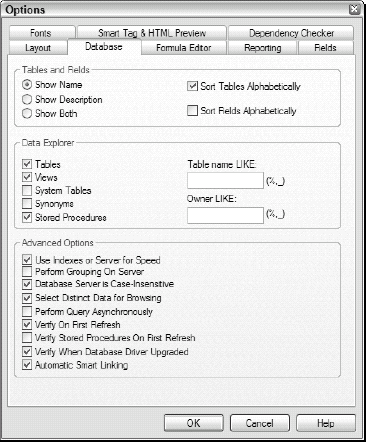
Database: View system tables and any synonyms or stored procedures that the database has. You can look for approximate matches in table names, and decide how tables and fields are listed. The default values of the Advanced Options, as shown in Figure 8-14, are better left as they are unless you have a compelling reason to change them.
Formula Editor: Customize the formatting options for the text you create with any of the editors, and specify some options for the Formula Editor.
Dependency Checker: Decide whether to check formulas, expressions, custom functions and other items for syntax errors and validity.
Reporting: Set a number of miscellaneous options.
Smart Tag & HTML Preview: Define the Web server and viewing page you want to use when selecting Office smart tags for Crystal report objects.
Fonts: Set default fonts for fields, charts, and text objects.
Fields: Customize the formats of the various field types.
As you can read to this point, the broad array of Crystal Reports' formatting options gives you a lot of creative latitude for how your reports present information. Those options make your job of communicating much easier. However, Crystal Reports offers other modes of communication that are just as effective. One of the most powerful is Crystal Reports' charting capability, which is the subject of Chapter 15.
Crystal Reports enables you to include report metadata within the report that the metadata is describing. Metadata is data about data, and report meta-data is descriptive data about a report. For many kinds of reports, you might want to include metadata items in the report itself. For example, readers might want to know the date when the data in the report was last refreshed. They might want to know the name of the author of the report. You can display such things in your reports as special fields, which are accessible from the Special Fields list in Field Explorer. Well over a dozen special fields are available there, each one holding pertinent information about the report. You can drag them onto your report and drop them wherever you like.
Sometimes the data in a report indicates a condition that requires urgent attention on the part of the report reader, but the urgency might not be readily apparent just from perusing the report. To make sure that the urgency gets across, Crystal Reports offers Report Alerts, which are custom messages that appear when certain conditions are met by data in the report. You can set a Report Alert to merely inform the reader of the condition, or specify a course of action to take.
Create a Report Alert by entering a formula, using the Formula Workshop. I discuss the Formula Workshop extensively in Chapter 10. In a Report Alert, the formula evaluates conditions that you specify. If the overall condition evaluates to TRUE, the alert is triggered, and its message is displayed. The message can be a text string, either by itself or combined with one or more report fields.
As an example, suppose that the Xtreme sales manager wants to be alerted whenever a customer in Mexico orders more than $5,000 of merchandise. A Report Alert added to the Customer Orders by State or District (Mexico) report will do the job. First, create the text of the alert. Then, set the condition that will trigger the alert.
Here's how to add the message itself:
With the target report active, choose Report

From the submenu that appears, click Create or Modify Alerts.
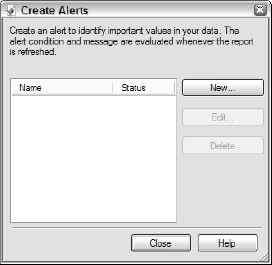
The Create Alerts dialog box appears, as shown in Figure 8-15. This dialog box lists alerts by name and tells whether they are enabled or disabled.
Click the New button to display the Create Alert dialog box.
Note: This is not the same as the Create Alerts dialog box in Step 2.
In the Name field of the Create Alert dialog box, enter BonusTime.

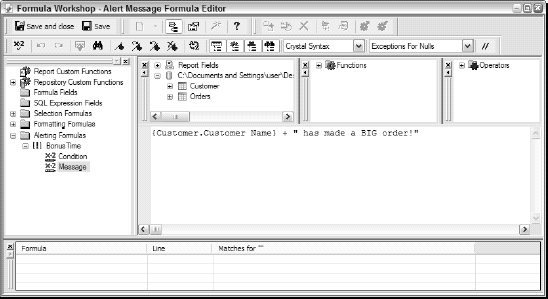
From the Report Fields pane, drag Customer.Customer Name, and drop it in the upper-left corner of the formula area that fills the lower half of the Workshop.
Type a space, a plus sign, and then another space to the right of the Customer.Customer Name field in the formula area.
To the right of the plus sign and space, type the text string, " has made a BIG order!"
Tip
Note the blank space between the opening quote and the first word.
Be sure to include the opening and closing double quotes in the string that you type. The formula should appear as shown in Figure 8-16.
Click the Save and Close button to return to the Create Alert dialog box.
In the Create Alert dialog box, click the Condition button.
The Alert Condition Formula Editor version of the Formula Workshop appears.
Now specify what condition must occur that will trigger the display of this Report Alert:
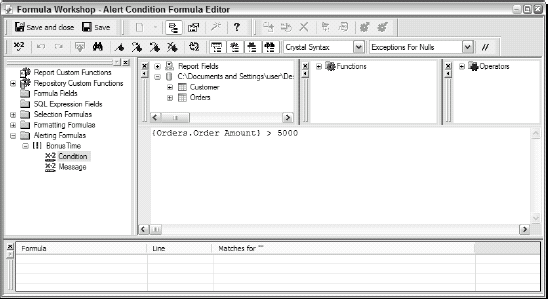
From the Report Fields pane, drag the Orders.Order Amount field into the formula area and drop it in the upper-left corner.
In the Operators pane, expand the Comparisons node and drag the Greater Than operator down. Drop it just to the right of the Orders.Order Amount field.
To the right of the Greater Than symbol, type 5000.
This produces the formula shown in Figure 8-17.
Click Save and Close to once again return to the Create Alert dialog box.
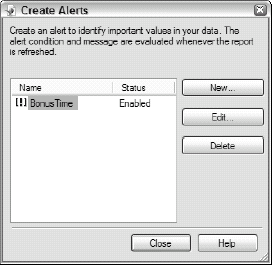
Ensure that the Enabled condition is selected (checked), and then click OK.
This puts your new Report Alert into the Create Alerts dialog box, as shown in Figure 8-18.
Click the Close button to return to your report.
To see the Report Alert in action, just click the Refresh icon on the Standard toolbar. The Refresh Report Data dialog box pops up, asking you whether you really want to refresh the report data. And you do, so click OK.
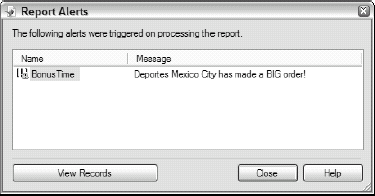
If any customers have orders that exceed $5,000, now a Report Alert pops up to let you know. Figure 8-19 shows what one looks like.
To see exactly how big the order total is, click the View Records button in the Report Alerts dialog box.
Crystal Reports does indeed make report creation easy, but it still takes considerable thought and work on your part to design reports that are well proportioned, presented with an attractive choice of fonts, drawing elements, colors, and layout.
Considering the time that you invest to create one report, it would be nice if you could recycle your work to use in a similar report down the road. You save time and effort, while creating a visual consistency from one report to the next that conveys professionalism.
You can achieve that consistency and save that time and effort by using a report template, which is an existing report, complete with formatting, that you can use as a starting point for a new report that you create. You don't have to create the new report from scratch; you have to change only the things that are different between the template report and the new report you are creating. And sometimes you don't have to change anything.
Apply the template as the last step in your report creation process and voilà! You're finished, creating a polished, professional report in a fraction of the time it would normally take to create one.
Here are the ways to apply a template to a report.
When creating a report: Select a template from the Template view in the Standard Report Creation Wizard.
After you create a report: Select a template, using the Template Expert.
Using an existing report: Use it as a template for your new report. Using a report as a template adds it to your mental list of available templates for possible use in the future.
Creating a report specifically as a template: It can serve as a pre-formatted skeleton for a variety of reports.
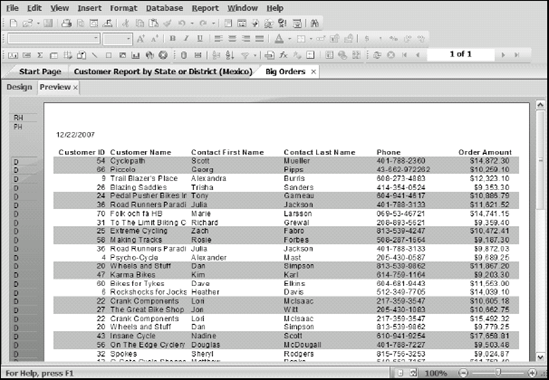
Applying a template to an already existing report is easy. To see just how easy, look again at the Big Orders report from Chapter 5; see Figure 5-17 (with a $5,000 lower limit) and again here in Figure 8-20 (with a $9,000 lower limit).
It looks pretty plain, but you can spruce it up with one of the Crystal Reports standard templates. Here's how:
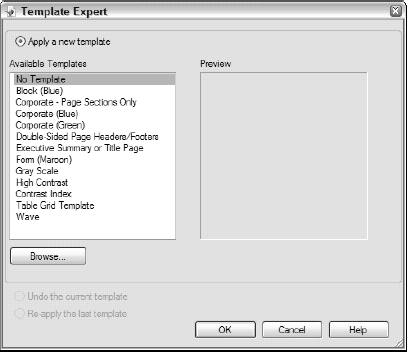
The Template Expert, as shown in Figure 8-21, opens.
From the Available Templates pane, select Block (Blue), then click OK.
The Template Expert disappears. After a few seconds, the Block formatting is applied to your report. In this example, the result looks like Figure 8-22.
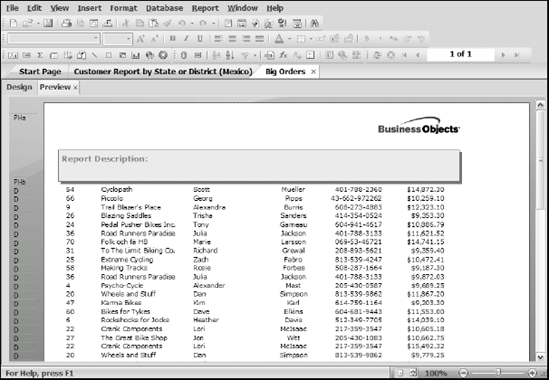
In this case, the template's headings override the original headings. (The detail rows are unchanged.) And if the formatting that the template gives you is close to what you want but not exactly perfect, change to Design view and make the changes you want. For starters, you probably want to replace the Business Objects logo in the page header with your own logo.
Note
Any template alterations you make are much less work than setting all your formatting from scratch.
When you're finished tweaking, save this report with the name Big Orders with Template.
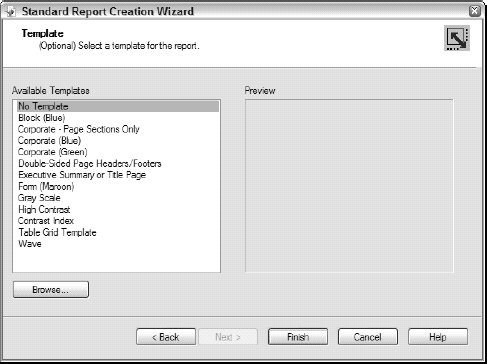
When you create a report with the Standard Report Creation Wizard, the wizard steps you through a series of views. We have already seen several of these. Below is a complete list, the last of which is Template view.
Data: Select tables to include in your report.
Links: If you're including more than one table, specify here how the tables are linked.
Fields: Specify which fields from the selected tables you're going to use.
Grouping: Separate records into groups in the report (for example, grouping customers by country).
Summaries: Specify any summaries that you want to include in the report, such as totals or averages of numerical data.
Group Sorting: Specify the order in which you want groups sorted.
Chart view: Specify what kind of chart you want to create to give a graphical representation of your data.
Record Selection: Filter out records that you don't want.
Template: Choose this from the Template view of the Standard Report Creation Wizard. This wizard, as shown in Figure 8-23, looks very similar to the Template Expert shown in Figure 8-21. They resemble each other because they serve similar purposes.
If some of the preceding listed views aren't relevant, they don't appear, depending on the choices you make as you progress through the wizard.