In This Chapter
Defining a cross-tab object
Creating a cross-tab report
Using a cross-tab report to summarize
Formatting a cross-tab object
For some people, a summarization of one sort or another is far more valuable than reams of detailed data. However, reports with summaries in a Group Footer or the Report Footer don't always display summaries in a form that is good for comprehension and decision making. In some of these cases, a cross-tab object can present the data in a form that's both easy to understand and capable of conveying the significance of the data.
The main advantage of using a cross-tab is that it can put multiple summaries together in a compact form. You can draw inferences from a single cross-tab on a single page, which displays separate summaries that are nonetheless related.
Suppose that the Sales Manager at Xtreme Mountain Bikes would like to see how the various product categories are contributing to total sales volume in Canada. A cross-tab report is ideal for presenting that information in a way that can be easily viewed and comprehended. Follow these steps.
From the Crystal Reports Start Page, select Cross-tab Report Wizard.
The Cross-Tab Report Creation Wizard appears, showing available data sources.
Select the Customer, Orders, Orders Detail, Product, and Product Type tables from the
xtreme.mdbdatabase.Move the tables to the Selected Tables pane.
Click Next to display Link view.
Link view shows the five tables connected to each other by the fields that they have in common.
Click Next to display the Cross-tab view of the Cross-Tab Report Creation Wizard, which is shown in Figure 14-1.
In the Available Fields pane, expand the Customer node and select Region. Then click the right-facing arrow to the left of the Rows pane.
Each row of the cross-tab now corresponds to a region (in this case, a province of Canada).
In the Available Fields pane, expand the Product_Type node, and drag Product Type Name to the Columns pane.
Each column of the cross-tab now corresponds to a product type.

To get the report to make the specific summaries you want, follow these steps:
In the Available Fields pane, expand the Orders node. Drag Order Amount to the Summary Fields pane.
The default value in the pull-down list below the Summary Fields pane displays Sum, which is the type of summary you want for this report.
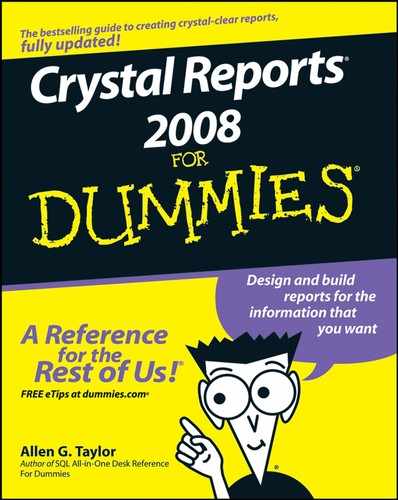
Click Next to display Chart view.
You can add a bar, line, or pie chart to the report, if you want.
Select Bar Chart to see what it will give you.
When you select a chart type, the wizard suggests a chart title that you can override if you want. It also asks that you verify several other assumptions it has made about what you want the chart to show.
Change the Chart Title to Sales by Province and Product Type, as shown in Figure 14-2.
Click Next to display Record Selection view.
For this report, you want to deal with records only from Canadian customers.
In the Available Fields pane, expand the Customer node and move Country to the Filter Fields pane. In the pull-down lists that appear below the Filter Fields pane, select is equal to and Canada.
Click Next to display Grid Style view, which is shown in Figure 14-3.
A good assortment of styles is available, some more appropriate than others for various kinds of reports.
Retain the Original style, and then click Finish.
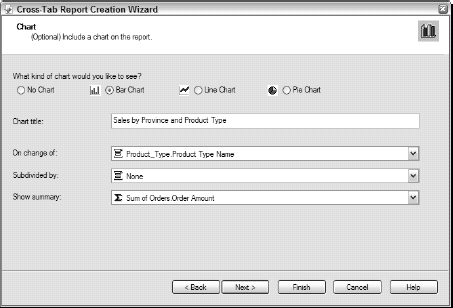
The report is displayed in Preview mode. The upper part of the report is shown in Figure 14-4.
Save the report.
For this example, save the report as
Sales by Province. You'll use this report later.


This chart should be of interest to the Sales Manager. It shows that competition bikes are outselling mountain bikes by a factor of almost three to one. It also shows that Xtreme is deriving almost as much revenue from the sale of helmets as it is from the sale of mountain bikes. This kind of information can be a great help to decision-makers.
Moving down the page to the actual cross-tab report shown in Figure 14-5, you can see that most sales are coming from British Columbia. This information might also be important to the Sales Manager.
The overall totals for each province are off the screen on the right edge of the report, with a grand total in the bottom-right corner. Also notice that the sales total for competition bikes for British Columbia and the overall total are so large that they don't fit in the space allotted, and are replaced by # signs. One solution to this is to reformat that column to make it wider. I cover formatting later in this chapter. At any rate, with this cross-tab object and its accompanying chart, the manager can quickly grasp the overall situation and make valid decisions.
As you can see in the preceding section, you can add cross-tabs to a Report Header or Report Footer. This section shows you how to add cross-tabs to a Group Header or Group Footer.
Note
You can't put a cross-tab in page headers, page footers, or the Details sections.
The section in which a cross-tab object is located in a report is related to the data it contains. For example, if the cross-tab should include all the data in the database for customers in Canada, as in the preceding section, the cross-tab must be located in either the Report Header or the Report Footer. This makes sense: The displayed data is a summary of data from all the Canadian provinces, so it must appear in a report section that encompasses data from all those provinces.
You can also create individual cross-tab objects for each group in a report. For example, you could create a report similar to the preceding one, but with summaries for each province rather than one overall summary for all of Canada. Follow these steps:
From the Crystal Reports Start Page, select Report Wizard.
Because there's more to this report than just a cross-tab, you use the Standard Report Creation Wizard (rather than the Cross-Tab Wizard) to create the report.
Place the Customer, Orders, Orders Detail, Product, and Product Type tables in the Selected Tables pane.
Click Next to display Link view.
The links between these tables are straightforward, so the wizard has assumed them correctly.
Click Next to display Fields view.
Your report won't include any fields other than those in the cross-tabs, so there's no need to select any fields here.
Click Next to display Template view.
You won't use a template, either.
Leave the default choice (No Template) intact; click Finish.
This creates a report with nothing in it but a date and a page number.
To continue building the report
Switch to Design mode.
Expand the Print Date field in the Page Header to make it big enough to display a date in a long format.
Add a text field in the Report Header to hold the report title.
Here's how:
On the Insert Tools toolbar, click the Insert Text Object icon and then place the text rectangle in the Report Header.
Expand the rectangle across the entire width of the page, and then type the report title.
To follow along with the example, type Sales of Product Types by Province.
On the Formatting toolbar, click the Align Center icon to center the text.
Enlarge the font and make it bold to make it more readable.

The Group Expert dialog box appears.
Expand the Customer node and then move Region over to the Group By pane. Click OK.
Group Header 1 (GH1) and Group Footer 1 (GF1) are created.
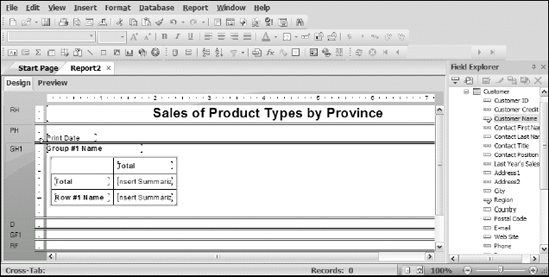
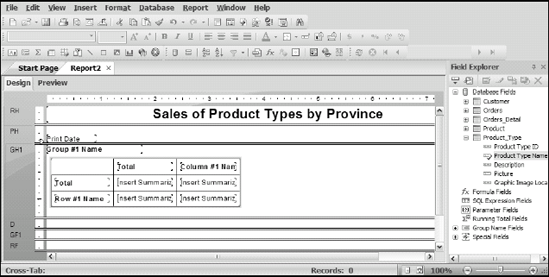
Drag the bottom boundary of the Group Header section down to make room for the cross-tab you will place there.

Drag the placement rectangle that appears into group header GH1 and release it with a mouse click.
If it's not already visible, display Field Explorer so that you can select database fields from it to place into your cross-tab.
Figure 14-6 shows the screen at this point.
Select Customer Name from Field Explorer and drag it onto the cross-tab object, and then place it at the lower left-hand corner.
This makes Customer Name the item displayed in the rows of the cross-tab. Figure 14-7 shows the cross-tab object after you do this step.
In Field Explorer, drag Product Type Name from the Product_Type table onto the cross-tab object, at the upper-right corner.
This establishes the columns of the cross-tab. Figure 14-8 shows the cross-tab object after this is accomplished.
Drag Order Amount from the Orders table in the Field Explorer into the Insert Summarized Field Here cells.
Your cross-tab object should look like Figure 14-9.
Switch to Preview mode.
The report looks like the one shown in Figure 14-10.


You have cross-tabs all right, but they're not the ones you want. The first is for the customer in Abu Dhabi, and the second is for customers in Alabama. There are more than 3,600 records. You want the report to show only customers in Canada. To do that, you have to work on the report just a little bit more:

The Choose Field dialog box appears.
Expand the Customer node, select Country, and then click OK.
The Select Expert dialog box appears, with the Customer.Country tab on top.
From the pull-down lists, select is equal to and Canada. Click OK.
Note
You want to select only Canadian customers.
When the dialog box asks whether you want to use saved data or refresh the data, click one of the options.
In this case, it doesn't matter which you choose because the database has not changed since the last time you ran the report.
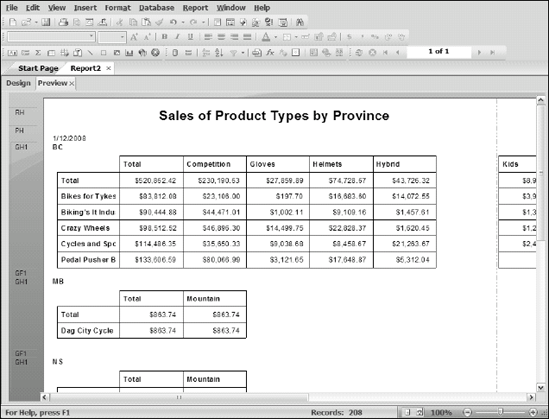
The report, which is shown in Figure 14-11, now contains only Canadian customers, but there's a formatting problem. Below the cross-tab for British Columbia, you can see a large number of detail lines indicated in the left margin — all empty. Get rid of them so the cross-tabs for all provinces are displayed one below another.
Right-click in the area to the left of the Details section and choose Suppress (No Drill Down) from the contextual menu that appears.
The report shown in Figure 14-12 appears. The data for Manitoba is right below that for British Columbia, and the data for Nova Scotia is right below Manitoba's. This is what you want.
Save this report as Sales of Product Types by Province.

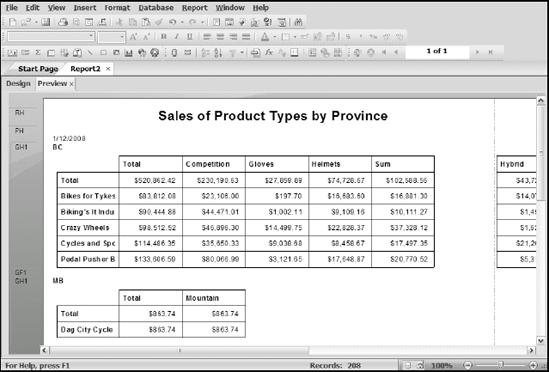
Suppose you want your report to show the result of a calculation based on the data in the report. You can do this by creating a Calculated Member. For this example, suppose you want to display the totals of gloves and helmets combined, for all the customers in your report. Follow these steps:
In the cross-tab, right-click the Gloves column header.
From the shortcut menu that pops up, choose Calculated Member.
From that submenu, choose Select "Gloves" as first value.
A dialog box appears and tells you that you have just selected the first value for a predefined calculation.
Click OK.
Right-click the Helmets column header.
From the shortcut menu, choose Calculated Member.
From that submenu, choose Sum of "Gloves" and "Helmets."
A dialog box appears telling you that you have just added a calculated row/column.
Click OK.
A new column appears in the cross-tab to the right of the Helmets column. It contains the sum of the values in the Gloves and the Helmets columns.
Figure 14-13 shows the report as it now looks.
You can do a number of things to enhance the appearance of a cross-tab report. This section experiments with achieving different effects in the reports I show you how to create earlier in this chapter.
The width and height of cross-tab cells are easy to change in Design mode. Merely select the cell you want to change and then drag its width or height handle in the direction you want. If you drag a width handle, all the cells in that column are changed along with the cell you're dragging. If you drag a height handle, all the cells in the same row are changed in the same way. This retains size consistency across columns and rows. It's not uncommon to need to enlarge cells to display all that they contain because the default size assigned by the Cross-Tab Wizard is often not adequate.
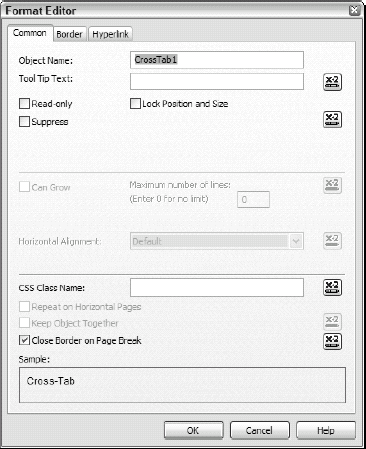
You can apply formatting to an entire cross-tab object by right-clicking the blank area at the top-left corner of the object and choosing Format Cross-Tab from the menu that pops up. The Format Editor dialog box appears, as shown in Figure 14-14.
You can specify various attributes such as Read-Only and Lock Position and Size. By switching to the Border tab, you can also specify refinements such as border lines, drop shadows, and foreground and background colors. From the Hyperlink tab, you can associate your cross-tab with a Web site, an e-mail address, or a disk file.
To format an individual field, right-click it and choose Format Field. This displays a version of the Format Editor tailored to the data type of the field you're formatting. For example, a currency field displays font options and currency format options in addition to the Common, Border, and Hyperlink options that appear when you're formatting an entire cross-tab.
You can give multiple cross-tab cells the same formatting by selecting them simultaneously by Shift+clicking, and then applying formatting in the same way you would for a single cell.
Sometimes the cross-tab objects you create might contain empty rows or columns because no data is available to fill them. For readability, you might want to suppress these empty rows and columns. To do so, right-click the blank area in the upper-left corner of the cross-tab object and choose Cross-Tab Expert. One of the tabs for this Expert is Customize Style. Click that to display the dialog box shown in Figure 14-15.
The lower-right portion of the dialog box shows that you can suppress not only empty rows and columns, but also row and column grand totals. A variety of other customizations are also available.
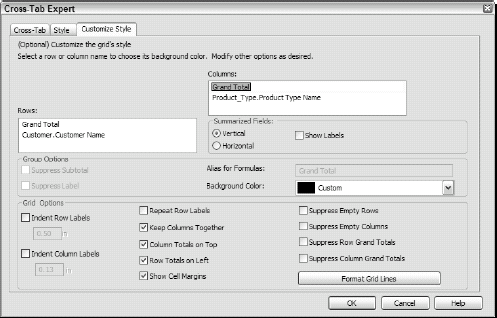
Commonly, a cross-tab object is wider or longer than the specified page size. Crystal Reports automatically formats the report on as many extra (extension) pages as needed. Column headings are repeated on all such extra pages. By default, row labels are not repeated. If you want row labels to be repeated on extension pages, select the Repeat Row Labels option on the Customize Style tab of Cross-Tab Expert (refer to Figure 14-15).