In This Chapter
Resizing sections
Controlling group placement
Creating summary and drill-down reports
Generating barcodes
Creating mailing labels
As I discuss in other chapters, Crystal Reports divides a report document into sections, including the Report Header, Page Header, Details, Report Footer, and Page Footer sections. These sections offer tremendous flexibility. A report can have multiple copies of each section, each one serving a different purpose.
You have a lot of leeway in how you format a section. You can vary the height, the background color, and even the number of columns in each section. By using Crystal Reports tools creatively, you can give your report the appearance you want.
In this chapter, you can read how to change section size, use different types of formatting, place groups, generate barcodes, and work a little postal magic.
The width of a section is the same as the width of the report that the section is in. You determine this value when you set your margins.
The height of a section begins at some default value. If that value gives you the appearance that you want, you can leave it the way it is. If you want a different height for a section, say to accommodate a larger font, it's easy to change, as described next.
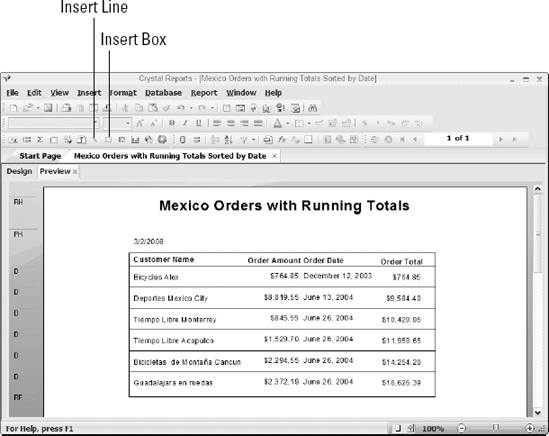
Consider the vertical spacing between the lines of a variant of the Mexico Orders, with Running Totals report that I show you how to create in Chapter 6. This version of the report has a box around the fields and horizontal lines between the rows. You can add this effect to your reports in Design mode by using the Insert Box and the Insert Line icons on the Insert Tools toolbar. Figure 7-1 shows the result.
In addition to adding a box around the text, I added a horizontal line above each line of text. To do this, in Design mode, expand the height of the Details section by dragging down its lower boundary line. Make this easy adjustment by following these steps:
Make sure you are in Design mode.
Move the cursor to the bottom of the Details section.
The cursor changes shape, as shown in Figure 7-2. When the cursor takes on the appearance of the sizing cursor, you can use it to drag the section boundary up or down to give you the vertical height you want for the section in question.
If necessary, you can adjust the height and width of a text box to give you the appearance you want. You can also adjust the positioning of the text boxes, both vertically and horizontally, leaving you with a report looking like Figure 7-1.
Make sure you don't drag a text box border line beyond the boundary line of a section. If you do, you get a weird result that you probably don't want.

To create a summary report in Chapter 6, I show you how to use the Hide (Drill-Down OK) function from the Section Formatting menu. Right-clicking in the area to the left of a report section displays a contextual menu. The options on the Section Formatting menu (as shown in Figure 7-3) provide you with a convenient way to make basic formatting changes to a section. Figure 7-3 shows the menu for the Details section, as seen in Preview mode.
The following list provides a brief description of each option in this menu:
Hide (Drill-Down OK): Doesn't display this section of the report but allows the user to drill down to view it.
Suppress (No Drill-Down): Doesn't display this section of the report and doesn't allow the user to view it by drilling down.
Section Expert: Displays Section Expert. You can read more about this tool shortly.
Show Long Section Names/Show Short Section Names: Toggles between showing either full or abbreviated section names.
Insert Line: Adds an additional horizontal guideline to the section. If there's not enough room for an additional line, the section is automatically expanded to accommodate the additional guideline.
Delete Last Line: Deletes the bottom guideline from the section and raises the bottom of the section up to just below the next higher guideline.
Arrange Lines: Arranges guidelines vertically so that they're evenly spaced. Adds more guidelines if there aren't enough.
Fit Section: Brings the bottom of the section up to the bottom of the lowest object, removing any guidelines that are lower.
Insert Section Below: Adds another section of the same type as the current section, just below it. We'll be covering this soon.
Select All Section Objects: Selects all objects in the section. This can be useful if, say, you want to move everything over to the right by a half inch. It beats moving each item individually and trying to maintain their relative positions.

Section Expert is the primary tool you use to change the formatting of a section. With it, you can set a number of options to determine what is displayed, how it's displayed, and what color the display is.
Figure 7-4 shows the default settings for the Report Header section of the Common tab. (Each section has different default settings.)
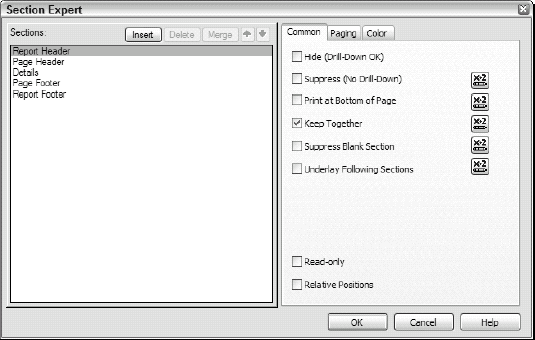
Here is a short description of the options on the Common tab:
Hide (Drill-Down OK) hides the section. However, drilling down displays the section's contents.
Suppress (No Drill-Down) hides the section, and drilling down does not override the suppression.
Print at Bottom of Page prints the section at the bottom of the page. This option doesn't make much sense for a Details section, but it's useful when applied to a Report Footer that otherwise could be printed near the top of the last page of a report.
Keep Together prevents a page break in the middle of a section. This option is useful if a section contains a small number of detail lines that should be viewed together, regardless of where they happen to fall on a page.
Suppress Blank Section closes the gap between the preceding and the following sections if a section is blank. If this option is not selected (checked), the empty space assigned to the section is on the report.
Underlay Following Sections prints the section and then prints all the following sections right on top of this one. The function is often used to apply a watermark to a page. It can also be used to overlay two types of content, such as text and a chart.
Figure 7-5 shows the Paging tab of Section Expert.
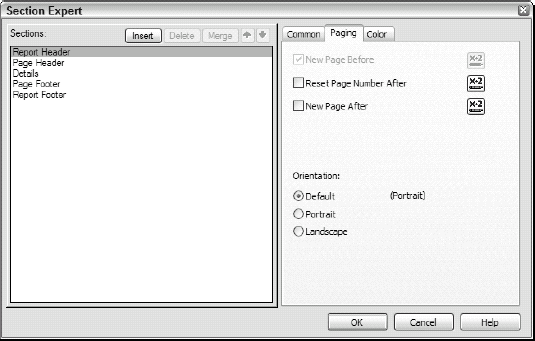
The Paging tab is a new feature of Crystal Reports 2008. The first option on this tab, New Page Before, is grayed out because the New Page Before option doesn't apply to the report header (which is what is selected in the figure). This makes sense because nothing comes before the report header. However, this option is active for the Details section and the Report Footer section.
The second option, Reset Page Number After, resets page numbering to the beginning of the sequence. For example, if you apply this setting to a Group Footer, the first page of the next group is numbered 1 rather than the number that would follow the last page number of the current group. You can read about groups in Chapter 6.
Gee. I guess I haven't really explained what a Group Footer is yet. Just as a Page Header is located at the top of every page and a Page Footer is located at the bottom of every page, a Group Header is located at the top of a group and a Group Footer is located at the bottom of a group. Group Footers are a great place to put totals or other summary information.
The third option, New Page After, prints the next section after the current one at the top of a new page.
The orientation options, portrait and landscape, are self explanatory.
From the Color tab, you can specify a background color for a report section. Each section can have a different background color. To do so, use the Format Formula Editor to write a formula that specifies which sections have a specific background color. I discuss formulas in detail in Chapter 10. Figure 7-6 shows the Section Expert Color tab.
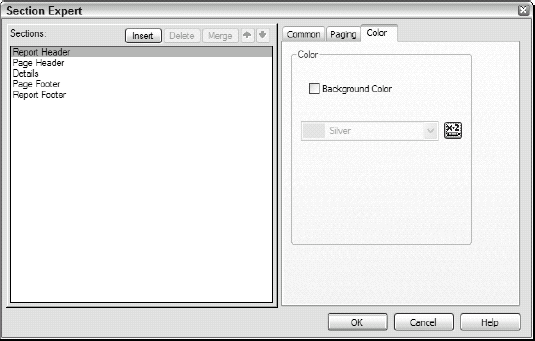
If you don't select the Background Color option, Crystal Reports doesn't give the background any color. Selecting the check box activates the drop-down list and basic color-choice palette, as shown in Figure 7-7.
Quite a few colors are available. If the standard choices don't meet your needs, click More to display a more-comprehensive Color palette. As shown in Figure 7-8, you can define thousands of colors from the Color palette.

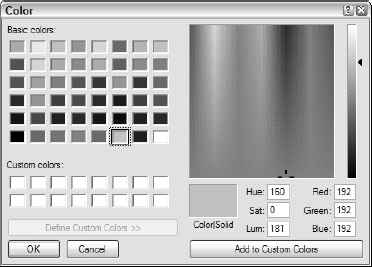
Figure 7-8. Select any hue, saturation, and luminance you want, as well as fractions of red, green, and blue.
Tip
Good design principles suggest that you select color schemes that are appropriate for the material you are presenting. Also make sure that there is sufficient contrast between the color of your text font and the background.
You can specify a background color for each section of your report. Depending on the effect you want to convey, you might leave all section backgrounds uncolored or maybe create a rainbow effect, with each section a different color. A more conservative approach is to use colored backgrounds sparingly but tastefully.
Note
Be aware of how your users will view your report. If you anticipate that your viewers will print the report on a black-and-white printer, don't go overboard with color. However, if users will view the report on computer screens or will print it on a color printer, take advantage of the expanded possibilities that color gives you.
You can simulate a classic banded look in your reports by using a conditional formula. To demonstrate this, follow these steps to add silver bands (or bands of any other color) in the background of the Big Orders report that I show you how to build and save in Chapter 5.
Open the Big Orders report and switch to the Design tab.
Right-click the Details tab and choose Section Expert.
In Section Expert, switch to the Color tab.
In the Sections area, select the Details section.
Select the Background Color check box.

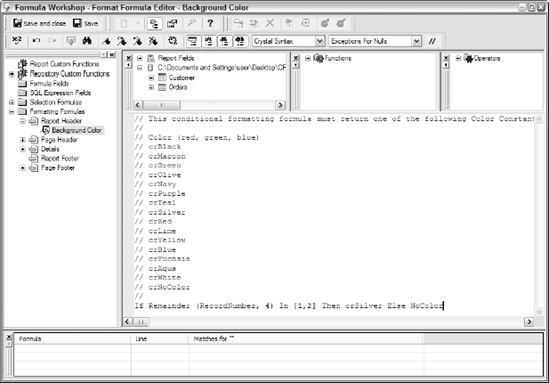
For this example, select Silver (or whatever color you prefer). Formula Workshop appears in Format Formula Editor: Background Color mode.
In the text area in the bottom half of the editor, enter the following formula, replacing color with the color you selected:
If Remainder (RecordNumber, 4) In [1,2] Then
colorElse NoColorIf you follow along with the example, the formula should be the same as the one shown in Figure 7-9. The comments show how to specify a color: in this case,
crSilver.Click the Save and Close button.
Click OK in Section Expert to dismiss it.
Switch to the Preview tab.
You can see the effect of this change on the single-month Orders report, as shown in Figure 7-10.
This report brings back memories of the good old days (which you can read about in the nearby sidebar) and also makes it easy to correlate the Order Amount on the right with the Customer Name on the left.

Depending on the type of report you're creating, you might want to depart from the default positioning of groups within the Details section or of an entire section. You can do so in several ways.
Suppose that you have a number of groups, and each group includes a large number of detail lines. Each group ends at some random place in the middle of a page, with the next group following immediately. For large groups, you might want to start each group at the top of a new page, which will provide a proper separation between groups.
Figure 7-11 shows the top of one page of Xtreme's Customer Report Grouped by State or District (USA). It has the last of many records for California, followed by the Colorado group.
For branch managers responsible for single states, it makes sense to have each state's records start on a new page. This makes it easier to distribute the appropriate information to the appropriate manager, while not revealing what is happening in other states.

To make each group start on a new page, follow these steps:
Right-click the GH1 (Group Header 1) area to the left of the first group header on the report and choose Section Expert from the contextual menu that appears.
Section Expert appears; refer to Figure 7-4.
On the Paging tab of Section Expert (refer to Figure 7-4), select the New Page Before option.
On a report such as this one, which has a report header, selecting this option causes a page feed after the report header is printed on the first page, and the first group will appear at the top of the second page. Here's how to avoid this problem:
When you select the New Page Before check box, also click its Formula Editor button to display the Format Formula Editor.
In the formula entry area, type Not OnFirstRecord.
This ensures that the first group always prints on the first page of the report.
Click the Save and Close button to close the Format Formula Editor and then click OK in Section Expert.
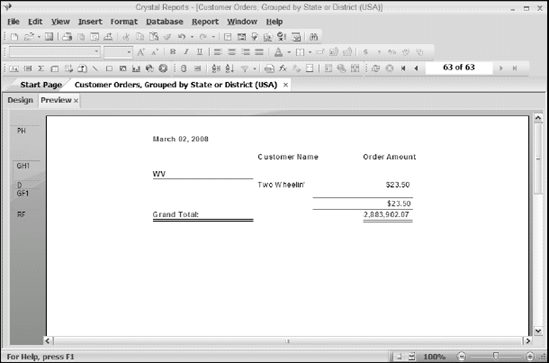
For a multipage report with subtotals for each group and a grand total at the end, you might want to print the grand total at the bottom of the last page. This is not the default format in Crystal Reports, which puts the grand total immediately after the subtotal for the last group, as shown in Figure 7-12.
Xtreme did not have many sales from West Virginia (WV), so the grand total prints near the top of the last page. Printing the total at the bottom of the page is another job for Section Expert:
Right-click in the area to the left of the Report Footer section and choose Section Expert from the contextual menu that appears.
On the Common tab (refer to Figure 7-4), select the Print at Bottom of Page check box.
This puts the grand total at the bottom of the page, where it's traditionally located.
If you're starting each group on a new page and the group extends for multiple pages, consider restarting the page numbering every time you start a new group. This causes less confusion for those folks who receive a distribution from their manager consisting of only their own group. Here's how to restart page numbering at the beginning of each new group:
Access Section Expert from the Group Footer.
Select the Reset Page Number After option on the Paging tab.
In Chapter 6, I give you a brief look at summary reports and how to drill down into them to see the hidden detail they contain. By making a simple selection from the Section Formatting menu, you can choose to either display or hide a report's detail information. You can print a detailed report for one client, and then print a summary that hides the detail but shows the summary information in the group footer for another client.
For example, say you give a full, detailed report to a branch manager responsible for a single state but give a drill-down-able summary report for a national sales manager. In addition, though, you can also produce a summary report for which drill-down is not possible. And — bonus — you can produce all three types of reports from the same basic report.
To create a drill-down-able report, use the Hide (Drill-Down OK) option from the Section Formatting menu. Conversely, to create a similar summary report for which drill-down is not enabled, use the Suppress (No Drill-Down) option instead. With one report, you can satisfy the needs of three classes of users. Sweet.
These days, just about anything you can buy comes with an identifying bar-code. Barcodes are fantastically useful. In inventory applications, reading a product barcode when a product leaves a warehouse automatically decrements the units-in-stock tally for that item. Barcodes also eliminate a lot of mistakes that easily happen when a human has to enter a long, meaningless number via keyboard. Crystal Reports 2008 gives you the ability to convert not only numeric fields, but also text fields and date/time fields, into barcodes.
You might ask, "Why would anyone want to put a barcode into a report?" Good question. You wouldn't want to put barcodes into a sales report or a customer list. But, as I mentioned, barcodes are fantastically useful, and you can use Crystal Reports to generate them. Just put label paper into your printer and print away! Crystal Reports enables you to put machine-readable identifiers on your products at minimal cost, because you already have Crystal Reports and the computer it runs on.
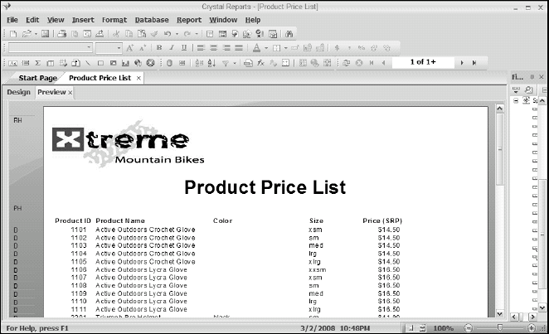
To demonstrate the barcode function, follow these steps to add barcodes to the Product Price List I show you how to create in Chapter 2.
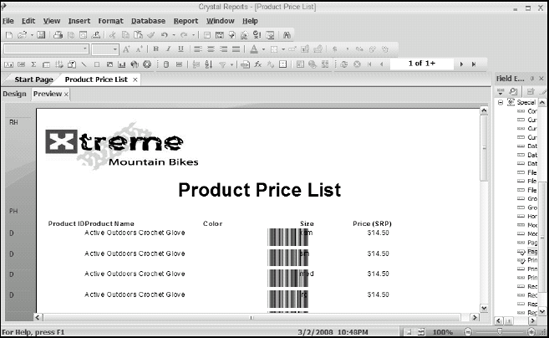
Open the Product Price List report, as shown in Figure 7-13.
In Design view, pull down the bottom boundary line of the Details section to provide room for a barcode on each line.
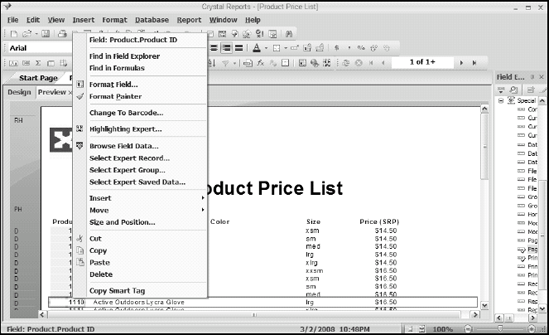
Right-click one of the entries in the Product ID column.
The menu, shown in Figure 7-14, appears.
Choose Change to Barcode.
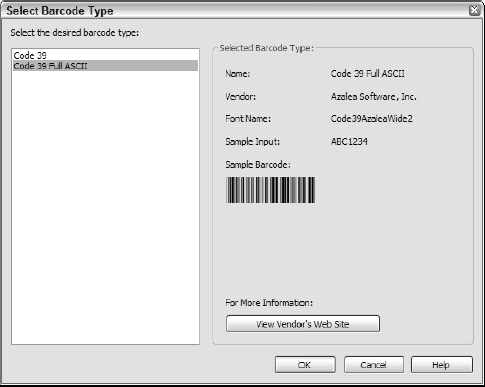
The Select Barcode Type dialog box displays, as shown in Figure 7-15.
Choose the Code 39 Full ASCII option and then click OK.
Switch to Preview mode.
A barcode corresponding to the Product ID is inserted on every detail line (see Figure 7-16).
Because this sample report wasn't initially designed to contain barcodes, the placement is rather arbitrary. Crystal Reports chooses to locate the barcode in the first blank area it could find beyond the Product ID field. If you plan at the beginning to include a barcode in a report, allocate space for it after the field from which it is derived.
You'll use multicolumn reports in a variety of situations. One example is a report for printing three or four columns of mailing labels on 8½ × 11" label stock. Crystal Reports recognizes that people frequently want to print mailing labels, so it provides the Mailing Label Report Wizard for this task.
To create a report that prints mailing labels in multiple columns, follow these steps:
From the Crystal Reports Start Page, select Mailing label report wizard and then click OK.
In the wizard, connect to the
xtreme.mdbdatabase and add the Customer table to the Selected Tables pane.For more information on this process, see Chapter 2.
Click Next to display Fields view.
Add the following fields from the Available Fields pane to the Fields to Display pane: Contact First Name, Contact Last Name, Customer Name, Address 1, Address 2, City, Region, and Postal Code.
Click Next to display Label view.
In Label view, you can select a standard label type or specify the dimensions and margins of nonstandard labels. You can also specify the direction in which they will be printed: across the page and then down, or down and then across.
Note
The standard label choice includes not only labels that you might put on envelopes, but also disk labels, audiocassette labels, videotape labels, and Rolodex cards.
Select a standard label type.
For this example, choose Avery 5160.
Click Next to display Record Selection view.
Specify which records you're printing labels for.
For this example, suppose you want to write to customers only in the United States. You can restrict the label printing to those customers by specifying that the Country field from the Customer table is equal to USA.
Click Finish.
You get the report shown in Figure 7-17.
Hmm. The three columns of labels aren't laid out in the most readable way. To correct that, follow these steps:
Switch to the Design tab to move things around a little; see Figure 7-18.
Concatenate the Contact First Name field and the Contact Last Name field on the first line, to make a full name with one space between the first and last.
Move the fields into the Page Header temporarily.
Click the Insert Text Object icon and place a text box into the Da section.
Expand the text box to the full width of the label.
Drag the Contact First Name into the text box.
Right-click the text box to display the context menu and select Edit text.
Locate the cursor immediately after the Contact First Name item and enter a space.
Drag the Contact Last Name item into the text box and drop it after the blank space.
Note
You have to right-click in the Da section and choose Edit Text from the contextual menu to insert the blank space.
Concatenate the Address1 and Address2 fields on the third line, putting a couple of spaces between them.
Move Address2 and City out of the way temporarily.
Click the Insert Text Object icon and drag a text box into the Dc section.
Drag the Address1 and the Address2 fields into the text box.
Insert the editing cursor between the two fields, and press the spacebar twice.
Move Region and Postal Code out of the Dd section, and then drag a text box down into that section. Move City into the text box in Dd.
Type a comma and a space after the City field, and then move the Region field after that. Follow Region with a space, and then drag Postal Code into the text box after the space.
The result should look similar to Figure 7-19.
Switch to the Preview tab.
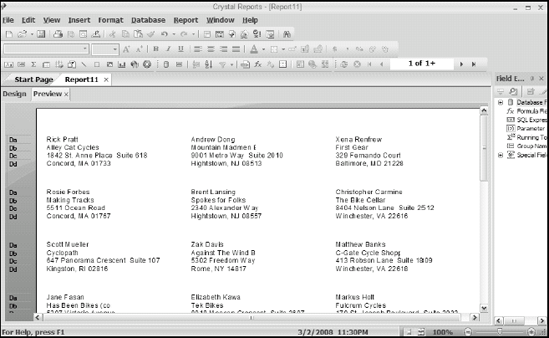
Your report should look similar to Figure 7-20. These labels look great and will fit nicely on the Avery 5160 label stock.
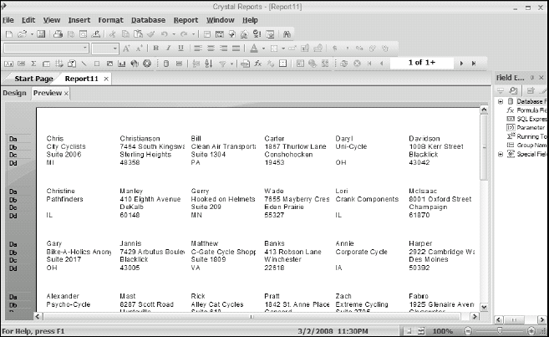


Figure 7-20 shows an example of how the addresses would print on label stock. The labels look great, but they're in the order in which they were entered into the database — which means no particular order at all. That matters because the United States Postal Service (USPS) offers a postage discount on mass mailings of first-class letters if the letters are sorted by ZIP code when you bring them to the post office.
Sure, you could create your labels, apply them, and then sort your mailing by ZIP (ugh), but let Crystal Reports help you by printing your labels in ZIP-sorted order in the first place. That way, your labels are in order while you apply them.
Start with the report shown in Figure 7-20 and then follow these steps:
- In Design mode, click the Record Sort Expert icon.

The Record Sort Order dialog box appears.
In the Record Sort Order dialog box that appears, add Customer.PostalCode to the Sort Fields pane.
Leave the sort direction as Ascending and then click OK.
Switch to Preview mode.
The report shown in Figure 7-21 appears. The labels are now sorted in ZIP code order, going down the page. Lovely!