In This Chapter
Performing What-If analyses with Crystal Xcelsius
Embedding an Adobe Flash animation within a report
Setting parameters with the Parameter panel
Crystal Reports 2008 makes a major leap forward in interactivity. To an extent never before possible, users can interact with Crystal Reports, using new dynamic capabilities. These new capabilities aren't provided by Crystal Reports alone, but rather are the result of Crystal Reports collaborating with other software programs. One of these programs, Crystal Xcelsius, is a Business Objects product, but others come from Adobe and Microsoft.
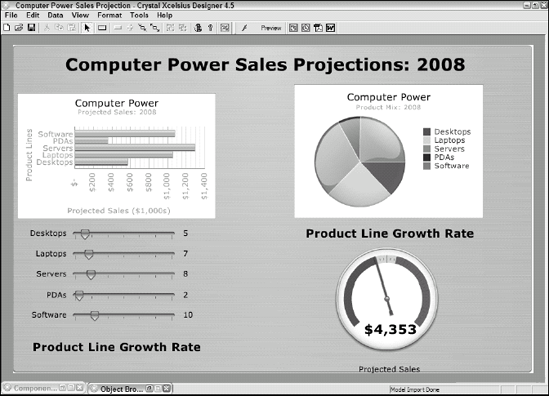
Crystal Xcelsius is a data-visualization design tool that serves as a decision support tool, providing users with a visually rich presentation, enabling them to interact with and more easily analyze their data. The result can be better business decisions, arrived at more quickly. Figure 17-1 shows an example of a Crystal Xcelsius visualization, which is also sometimes called a dashboard presentation.
What you see in Figure 17-1 is only part of the story because it's but a snapshot of a dynamic visualization. When you move the sliders at the lower left of the display, the bars on the bar chart change in length, the pie segments in the pie chart change in relative size, and the needle on the gauge changes position, as does the number displayed within the gauge. With these controls, a person can easily create What-If scenarios. Say, the growth rate of laptops were to double. By moving the Laptops slider, you can see what the overall result on product mix and revenue would be.
Crystal Xcelsius uses Microsoft Excel as a data source and data modeling tool, and Macromedia Flash Player as a rendering engine. Programmers using Crystal Xcelsius Designer can use the combination of products to compile dynamic visualizations that can then be added to a Crystal report.
Although Crystal Xcelsius is a separate product from Crystal Reports 2008, it can add impressive visualizations to a Crystal report. To use Crystal Xcelsius, data from a report's data source must be copied to an Excel spreadsheet file. Xcelsius takes data from the spreadsheet file and creates a Flash visualization of the data in the form of a Flash SWF file. You can either embed the Flash file in your report or link to it.
Placing an Xcelsius visualization in a Crystal Report is a multi-step process. The steps are
Copy the data you want to display from your data source to an Excel spreadsheet.
Of course, if your data source is an Excel spreadsheet, you can skip this step.
Use Crystal Xcelsius to create a visualization model and then save it to a Flash SWF file.
Set up the Crystal Xcelsius model to receive real-time data from Crystal Reports.
This enables the model to respond the operations on controls, such as slider controls, by the report user.
Embed the Crystal Xcelsius model within a Crystal report, or alternatively create a link to it.
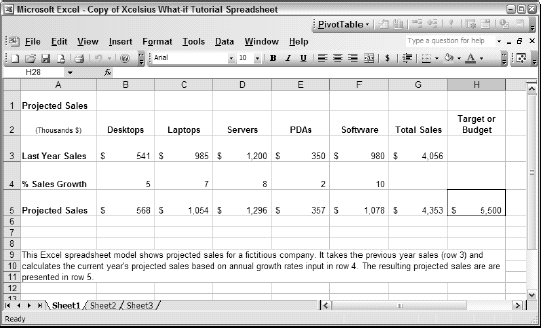
Assuming that you already performed Step 1 and that your data resides in an Excel XLS file, Figure 17-2 shows the spreadsheet that serves as the basis for the Xcelsius visualization shown in Figure 17-1.
The next step is to create a visualization model with Crystal Xcelsius. Crystal Xcelsius is a separate product from Crystal Reports, and I don't have space in this book to cover that process. For complete details, read through Crystal Xcelsius For Dummies, by Michael Alexander (Wiley). Figure 17-3 shows the user interface of Crystal Xcelsius Designer 4.5.
After your Crystal Xcelsius visualization exists as a Flash file, you must set it up to receive input from the Crystal report it's embedded within. This operation is also performed by Crystal Xcelsius. The steps are fairly straightforward and also necessary for Crystal Reports to deliver the interactivity that Xcelsius makes available.

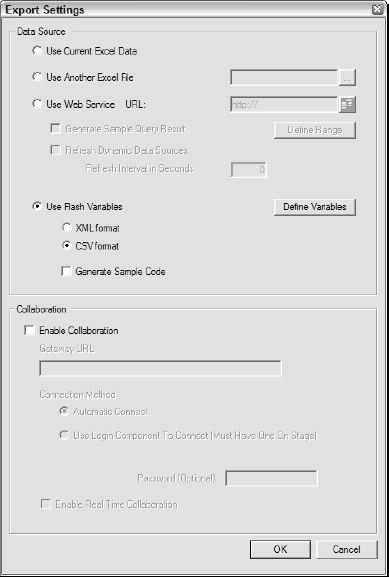
From the Crystal Xcelsius menu, choose File
Export Settings.
The Export Settings dialog box, shown in Figure 17-4, opens.
Select the Use Flash Variables radio button.
Select CSV format.
CSV stands for comma-separated values. CSV files are just about the simplest data files in existence. They consist of a string of values, separated by commas.
Click the Define Variables button.
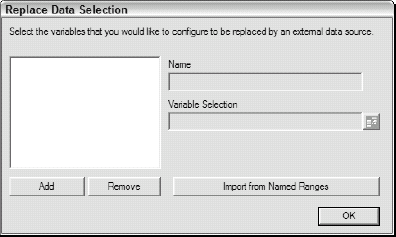
The Replace Data Selection dialog box, shown in Figure 17-5, opens.
Click Add.
In the Name text box, replace Range0 with Values.
Click the select range icon (to the right of the Variable Selection text box) to display the source data spreadsheet.
The Select a Range dialog box opens.
Select the range B5 to F5 in the Select a Range dialog box, as shown in Figure 17-6, and then click OK.
You return to the Replace Data Selection dialog box.
Click OK to return to the Export Settings dialog box.
Click OK in the Export Settings dialog box.
From the main menu, choose File
ExportMacromedia Flash (SWF).In the Export Macromedia Flash (SWF) dialog box that appears, specify a location and filename, and then click Save.

After you create an Xcelsius model, you can insert it into a Crystal report. Here's a step-by-step process for doing that:
Start Crystal Reports 2008; under Start a New Report, click Blank Report.
In Database Expert, connect to your spreadsheet model (if you're not already connected to it) and select the sheet that contains your data.
With Formula Workshop, click the New icon; from the menu that appears, choose Formula.
In the small Formula Name dialog box that pops up, enter BuildValuesString and then click OK.
Enter the following formula into Formula Editor:
global stringvar ValuesString;
**
   if
       (ValuesString = "") then
       ValuesString := Cstr({Sheet1_.Projected Sales})
   else
       ValuesString := ValuesString + "," +
           Cstr({Sheet1_.Projected Sales});
ValuesString;
Click Save and Close to exit Formula Workshop.
From the main menu, choose Insert
Flash.From the Insert Flash Object dialog box that appears, do the following:
Browse for and select the SWF object you exported from Crystal Xcelsius.
Make sure the Embed radio button is selected.
Click OK.
Locate the placement rectangle in the Report Footer and click the left mouse button to place it there.
Click the Flash object on the report to highlight it, right-click it, and choose Flash Data Expert from the menu that appears.
In the Flash Data Binding Expert section, click the button with the plus (+) sign.
Type Values for the variable name, and then click within the Value field to the right of it.
To pass the value into the Values Flash variable, click the drop-down button on the text box and select an existing field object to pass to the Flash variable.
In this case, select the BuildValuesString formula.
Click OK to exit the Flash Data Binding Expert.
You can now switch to Print Preview mode and move the slider controls. As you do, the bars on the bar chart move, the pie segments in the pie chart change proportions, and the needle in the gauge moves to reflect the changing values of the product line growth rates. Figure 17-7 shows the Flash object embedded in the report, after the slider controls have been moved.

Xcelsius Flash visualizations provide an interactive experience that is directly related to the data being conveyed by a Crystal report. This is probably the most powerful use of Flash in a report. In addition, you can include other Flash objects in your reports, regardless of their origin. Although not bound to the data in the report, they may nonetheless enhance the report's appearance. For example, you could include an animated logo in a report. You could even include an animated movie that illustrates a process or operation.
In order to view a Flash object in a Crystal Report, you must have a viewer that supports Flash functionality. Of course, Crystal Reports 2008 itself supports that functionality, as do .NET Winform, .NET Webform, and Java DHTML viewers.
Warning
The free, downloadable Crystal Reports Viewer XI does not support Flash. However, Crystal Reports Viewer 2008 might support Flash functionality by the time you read this book.
You can add a parameter to a report and issue a prompt to the user to enter a value for the parameter, via the Parameter panel. The following steps create a parameter that appears on the Parameter panel:
Open the Customer Orders by State or District (Mexico) with Map report.
From Field Explorer, select Parameter Fields, and then right-click it.
From the contextual menu that opens, choose New.
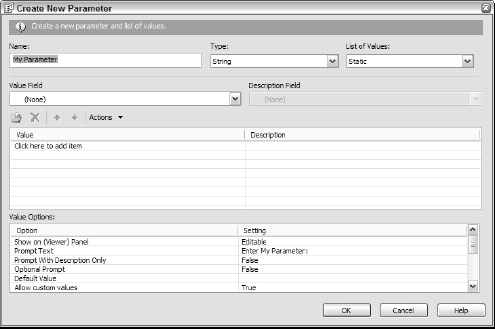
The Create New Parameter dialog box shown in Figure 17-8 is displayed.
Enter a name for your parameter in the Name field.
I use Order Lower Limit.
Choose the appropriate data type from the Type field.
I selected Currency from the drop-down list.
From the Value Field drop-down list, select a value.
I selected Order Amount.
From the Description Field drop-down list, select a value.
I selected Customer ID.
Click the Actions drop-down indicator and select Append All Database Values.
Warning
All the applicable values are moved to the Values area. This operation can take significant time for a large table.
In the Value Options area, make sure that the Show on (Viewer) Panel setting is set to Editable, that Allow multiple values is set to True, and that Min Value is set to 500.
These settings will establish a lower limit of $500 for Order Amount.
Click OK.
The Order Lower Limit parameter field now appears in Field Explorer.
Drag your parameter field onto the report.
I dragged mine into report footer RFc. If you don't want it to appear on the report, you could also drag it into a section that is suppressed.
Switch to Preview mode.
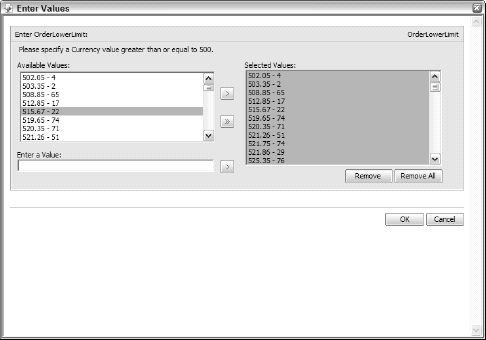
The Enter Values dialog box opens. The prompt says Please Specify a Currency Value Greater Than or Equal to 500.
Click the double right-arrow to place all qualifying values into the Selected Values pane, as shown in Figure 17-9.
This dialog box enables you to select specific values out of all the values that satisfy the condition of being equal to or greater than 500. I chose to select them all.
Click OK.
All the qualifying values appear in the Parameter panel at the left of the window, as shown in Figure 17-10.
