
In This Chapter
Starting Crystal Reports
Creating your first report
Printing your report
Troubleshooting your report
When you start Crystal Reports, you generally want to do one of three things:
Create a report.
3 Modify a report.
Run a report against the data in your database.
You use reports to take data from a database and then process, format, and finally output that data to a printer, computer screen, or Web site.
You probably chose Crystal Reports because you have a database that contains information that's important to you. In all likelihood, the data in that database changes with time, and you want to be able to keep up with its current status. Sure, you could retrieve the information you want by making SQL queries, but that would be too much like work. It's far better to create a report with Crystal Reports, and then run the report whenever you want the latest status of the information of interest. You need to create the report only once, and then you can run it many times, getting the latest results with each successive run. You don't have to learn SQL or any other method of pulling data from a database. Reports created with Crystal Reports are easy to build, easy to read, and easy to understand. What could be better?
Crystal Reports gives you tremendous freedom in how you can lay out your report. It also gives you great latitude in what you include in the report. In addition to text and columns of numbers, you can include graphical images, charts, graphs, and maps. You could even crank out a full-length science fiction novel with Crystal Reports if you wanted to (although other tools are better suited to that task).
In this chapter, I walk you through building your first report from scratch, using the Crystal Reports sample data as its basis. The sample's tables are filled with data that you can manipulate and display with Crystal Reports. You can use this sample data as the basis for your first report. And if you're not exactly sure what you need to choose from the sample database in this first-run report, don't worry: I take you through all your choices, including which tables and what data items to use, how to manipulate the data, formatting the report, and ways to output the report.
Crystal Reports has a sample database you can use for practice. It's a Microsoft Access database for a fictitious bike shop, named Xtreme Mountain Bikes, Inc. If you don't have a copy of xtreme.mdb on your computer, you can download a copy (a Zip file) from the Business Objects Web site at
http://support.businessobjects.com/downloads/samples.asp |
Tip
Unless you recently downloaded the sample database, you probably have an older version of xtreme.mdb. This older version works fine. With the 2008 release, Business Objects made a serious attempt to reduce the "installation footprint" of the product. To do that, Business Objects left out a number of files that had been included in earlier versions. Many of these (including xtreme.mdb) are available for download from the Business Objects Web address.
The xtreme.mdb database contains a number of database tables that are representative of the tables that a real-world bike wholesaler might maintain. As I mention earlier, these tables are filled with sample data that you can manipulate and display with Crystal Reports.
The first step when creating a report is to launch Crystal Reports from the Windows Start menu. When you do, the Crystal Reports Start Page appears, shown in Figure 2-1.
You can choose from among five different ways to start a new report. You can create a Crystal Reports document by using one of several wizards or by starting with a blank report. Alternatively (as I demonstrate in Chapter 1), you can open a report that already exists, either to change it or to run it.
Although using the wizard can be a time- and labor-saver, it does constrain the form of a report. The special-purpose report wizards, such as the Cross-tab Report Wizard, are great for creating certain specialized reports. This chapter takes you right to the point and shows you how to create a report your way, starting from a blank report instead of using a report wizard.

As I allude in the introduction of this chapter, here's what you need to decide upfront when creating a report:
Which tables in the database contain the data you want
Which data items you want from those tables
What manipulations of the data to perform to give you the information you want
How you want your report to be formatted
Whether the users of your report will retrieve it from a black-and-white printer, color printer, local computer screen, or Web site
For now, imagine you already know all those things.
To create a report from scratch, follow these steps:
Start Crystal Reports.
The Crystal Reports Start Page appears; refer to Figure 2-1.
Select the Blank Report option.
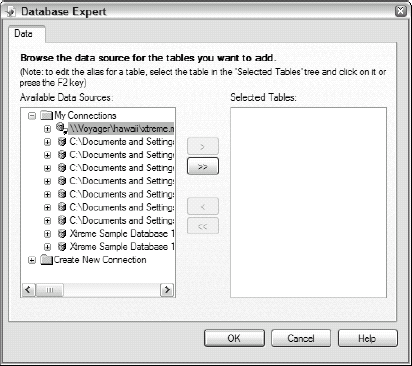
The Database Expert dialog box appears, as shown in Figure 2-2, which shows you possible places to find the source of your data.
In the Available Data Sources pane, click the plus sign to the left of the Create New Connection folder to expand it.
Note
This is the folder you choose when you create a report from scratch. Once you have connected to a database, Crystal Reports remembers where it is from then on.
Double-click the database type that matches your data source.
Crystal Reports recognizes a variety of different database types.
Warning
You must select the right type. If you don't know which type is correct, ask someone familiar with the data source.
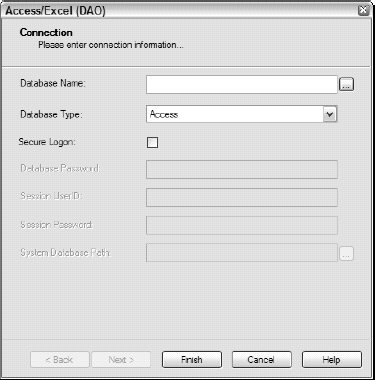
To follow along with this example, double-click Access/Excel (DAO). The Access/Excel (DAO) dialog box appears, as shown in Figure 2-3.
Click the ellipsis (...) button to the right of the Database Name field.
Locate the
xtreme.mdbon your computer and click the Open button to open the database file and dismiss the Open dialog box. Then, back in the Access/Excel (DAO) dialog box, click Finish.Database Expert reappears, as shown in Figure 2-4, with the
xtreme.mdbdatabase connected. You can tell the connection is successful if you see Add Command, Tables, Views, and Stored Procedures listed below the connection in the Available Data Sources pane.Expand the Tables node, and then double-click the table on which you want to base your report.
To follow along with the example, double-click Product.
The reference is moved to the Product table from the Available Data Sources pane to the Selected Tables pane as shown in Figure 2-5.
Click OK to close Database Expert.
A blank report fills the window, as shown in Figure 2-6.


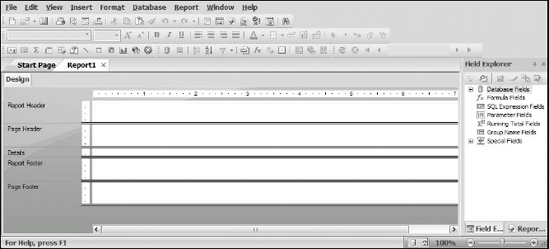
The Design tab (on the left edge) shows five sections of the report:
Report Header: Appears only at the top of the report; the first thing that a viewer sees
Page Header: Appears below the report header and at the top of all other pages in the report
Report Footer: Appears after the last detailed information in the report
Page Footer: Appears at the bottom of every page of the report
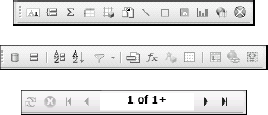
The toolbars at the top of the window give you immediate access to the major features of Crystal Reports. You are probably already pretty familiar with the first two toolbars, the Standard toolbar and the Formatting toolbar. They are similar to the corresponding toolbars on any Windows application, with a few additional items are specific to Crystal Reports. If you hover your cursor over any of these, a tooltip appears, telling you what each one is.
The third toolbar actually combines three separate toolbars: the Insert Tools toolbar, the Expert Tools toolbar, and the Navigation Tools toolbar. Figure 2-7 shows these toolbars.
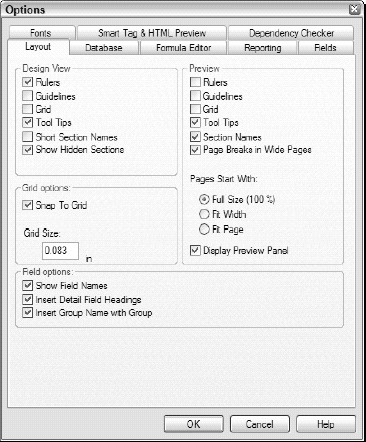
Depending on the resolution of your computer screen, the Crystal Reports window might not display the full width of your report. You can give yourself a little more width in your display by changing one of the display options. Follow these simple steps:
Choose File
Options.
The Layout tab of the Options dialog box appears, as shown in Figure 2-8. Think of this as Control Center for the appearance of your report.
In the Design View section, select the Short Section Names check box.
This reduces the section names on the left edge of the window to one-or two-letter abbreviations, freeing up a little horizontal real estate.
Click OK.
Drag the left edge of Field Explorer farther to the right.
You won't need Field Explorer right away. It's your primary tool for placing data into your report.
This allocates more horizontal space to the work area, which allows you to view more of the report without resorting to horizontal scrolling.
The Report Header area (at the top of the first page of the report) is the ideal place to tell the reader exactly what the report contains. However, this forces you, right here at the beginning, to decide what the report is to contain. No problem: Start by considering who your target audience is and what they want to know. (You can read more about making these decisions in Chapter 3.)
If you are Xtreme Mountain Bikes — and for this example, you are — the target audience for your Products report is potential customers. They surely will want to know what products you carry, including information on color and size, where appropriate. They probably want price information. They'll also need to know the stock number of an item so they can specify it properly when they decide to purchase a bike.
Placing your company logo in the report header also makes sense. Unfortunately, the Xtreme logo isn't available conveniently on the Crystal Reports distribution CD or on the Business Objects Web site. For the purposes of this demonstration, any logo-sized image file in one of the popular image file formats such as JPEG or GIF will do. BMP files are not supported, however. You can add one to the report header along with a title, such as Product Price List.
To add a logo to a report, do the following:
Dismiss Field Explorer, if necessary, by clicking the X in its upper-right corner.

You can find out the name of a toolbar icon (such as Insert Picture icon) by hovering your cursor over it. After a few seconds, a tooltip appears, telling you the name of the tool.
A dialog box appears, displaying the image files in the Databases folder. I had no image files in my database folder, so I looked around until I found a sample report with the logo on it. I copied it, saved it to JPEG format, and then inserted it into my report. Perhaps you'll find a suitable image. Anything that is approximately the right size and shape is fine. Your organization's own logo would do, as would a drawing your child made.
Click the picture's filename to select it, and then click the Open button. An outline of the logo appears on the report layout. Place it in the upper-left corner of the report header with the mouse, and then click to fix it in place.
Figure 2-9 shows the result.

Next, put a report title into the Report Header section. To do this, you use several tools from the Insert toolbar.
Pull down the dividing line between the Report Header section and the Page Header section so that you can place the report title below the level of the logo.
To pull down a dividing line, hover the cursor over it until the cursor changes shape, click and hold the left mouse button, drag the line to where you want it, and then release the mouse.

The cursor changes to a plus sign (+).
Move the cursor into the Report Header section, just below the logo. Click the mouse button to establish the upper-left corner of the text box and then drag across the page and release the button at the lower right of the Report Header section.
A text cursor starts to blink inside the rectangle you created.
At the blinking cursor's location, type the report title.
For the example, type Product Price List.
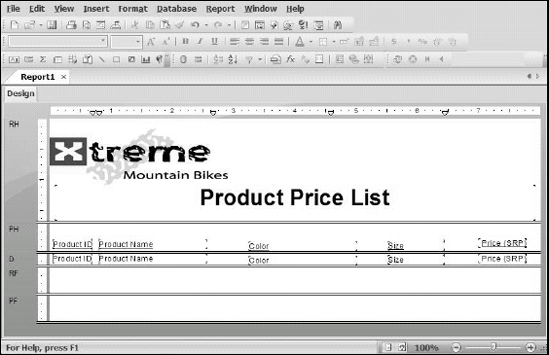
Select the title you just typed, and then increase its size by clicking the Increase Font Size icon on the Formatting toolbar.
Make the title bold by clicking the Bold icon on the Formatting toolbar.
Click the Align Center icon to locate the title in the center of the page.
Your report should look similar to Figure 2-10.

The next logical step is to place in the Details section the fields you want the report to display. Simply follow these steps:
In Field Explorer, click the plus sign to the left of Database Fields; click the plus sign to the left of Product to display its fields.
Tip
Because the Product table is the only available data source, it's the only one listed.
If Field Explorer isn't visible, choose View
Field Explorer displays the fields in the Product table, as shown in Figure 2-11.
Click the first field that you want to include in the report, and then drag it to the left edge of the Details section.
For this example, click the Product ID field. When you drag the field, a rectangle appears. The field name appears in the rectangle in the Details section and also above it in the Page Header section. Later, you might want to change the column titles in the Page Header section for cosmetic reasons. For now, just leave the default column titles.
Repeat Step 2 for any other fields that you want to include in the report.
For this example, place the Product Name, Color, Size, and Price (SRP) fields in order in the Details section, leaving just a little space between them.
Tip
Crystal Reports 2008 automatically adjusts the fields displayed to match the field sizes you chose, and also spaces them proportionally. You can manually adjust the field sizes by grasping the handles on the left and right edges of the fields and moving them. Resize the fields and move them back and forth until you arrive at a good balanced appearance.
At this point, your report layout should look similar to the one shown in Figure 2-12.

Everything in the Page Header section appears just below the Report Header on the first page of the report and at the top of all following pages. By default, the field names in the Page Header section are displayed in a normal font and underlined. I think they look better in a bold font and not underlined, so I select the Bold attribute for each of them and deselect the Underline attribute. I'll wait to see what the report looks like before deciding whether I want to change the font size as well. Figure 2-13 shows the layout with the enhanced column headings.

Note a few things about the report at this point.
Crystal Reports automatically inserts commas between groups of three digits in number fields, such as the Product ID field. This is not what you want.
The Product Name field isn't wide enough to display the full names of some products.
The Color attribute must not apply to gloves because no color information is shown for the glove products (that you can see). For all we know, some gloves listed farther down in the report than is currently visible could have a color attribute.

The fact that gloves have no color isn't a problem, but the comma in the middle of the Product ID is a problem, as is the short field width. You can correct these as follows.
To fix the comma issue
Click the Design tab to return to Design mode.
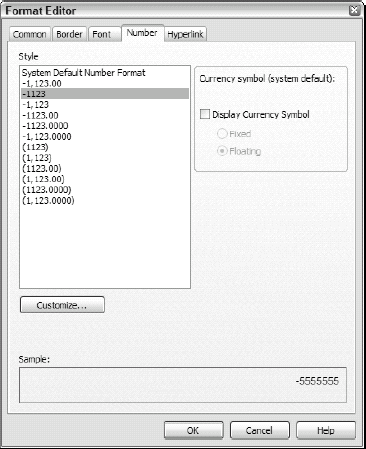
In the Details section, select the field whose number format you want to change.
For this example, right-click in the Product ID field.
From the contextual menu that appears, choose Format Field.
Format Editor appears.
From the Number tab, choose the numeric format that you want and then click OK.
For this example, you want the format with no commas, as shown in Figure 2-15. This changes the format of the Product ID field to eliminate the unwanted commas.
To fix the field width issue
Back in Design mode, click in the Product Name box in the Details area to select it, and then move the cursor over the right edge of the box.
The cursor changes to a two-headed arrow (<--->).
Drag the right edge of the box further to the right, to allow more room for long product names.
Verify your changes by returning to Preview mode. The commas are gone, and the product names are now fully visible. By moving the sliders at the right and bottom edges of the report window, you can verify that all columns and rows are as they should be.
The bottom of each page offers you a great opportunity to display useful information, such as page number. (Hint: If you've ever dropped a stack of reports off your desk, you know that page footers can be a valuable aid to putting them back in the proper order.)
When using the Product Price List, a report title and the date printed are valuable additions to the page footer. (Prices tend to change frequently in a fast-moving industry such as the mountain bike business, so the date of a price list is very important.)
In Design mode, follow these steps to create a page footer for your report that includes these three items (title, page number, and date printed).
Here's how to put useful information into a page footer:
For this example, all the items you want to place in the page footer are text items.
Place the text object rectangle in the Page Footer section and expand it to cover the full width of the page.
Click the Align Center icon.
You don't have any text yet, but you will.
At the blinking cursor in the text field rectangle, type the report title, followed by a comma and a space.
Type Product Price List, for this example. then a comma and a space.
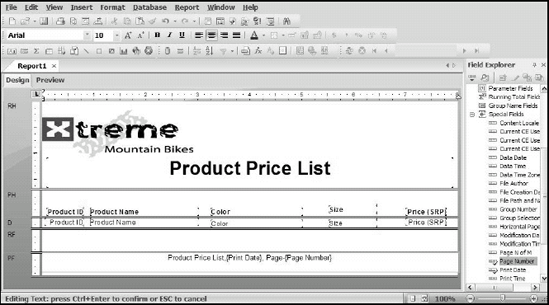
Next, place the current date and page number into the page footer:
In Field Explorer, scroll down to Special Fields and expand it.
Note
You expand a node by clicking the plus sign to its left.
Click the Print Date icon or the Print Date name next to it, and drag it to the Page Footer area, right after the comma.
After the Print Date field is in position, type a comma and space after it, and then type Page followed by a hyphen.
In Field Explorer, click the Page Number icon or the name next to it, and drag it to the right of the hyphen.
This gives you an arrangement that looks much like Figure 2-16.
Click the Preview tab at the top of the work area to switch to Preview mode.
The field names are replaced by actual values, as shown in Figure 2-17.

For some types of reports, you want a final item to close out the report, appearing after the last of the data on the final page. These are report footers, which are different than page footers. A report footer comes immediately after the last line of detail information but before the final page footer. This would be a good place, for example, to put a grand total for the entire report. If your report does not have a grand total, you can use this section in other ways.
To illustrate this feature of Crystal Reports, put a company slogan at the bottom of the Product Price List. Place the slogan Xtreme Mountain Bikes Take You to the Limit into the Report Footer section the same way that you put the report title into the Page Footer section. (See the preceding section for the details on how to do this.) The result, in Preview mode, looks like Figure 2-18.
If you've followed this chapter to this point, the Product Price List report is essentially complete. Now you might want to generate some descriptive information about the report that's associated with the report but not normally printed or displayed. Crystal Reports has a provision for this. To add some descriptive information, follow these steps:

Choose File
Summary Info.The Document Properties dialog box appears.
Fill in the text boxes with whatever information you want to associate with your report.
I added the information shown in Figure 2-19.
Click OK.
The document properties you entered are stored along with the report; they can be retrieved whenever anyone views the report with Crystal Reports.

Printing a report from Crystal Reports is really easy. Open the report in Crystal Reports and then click the Print icon or choose File
Sometimes the vision you have in your mind is not adequately reflected in the report you produce. Perhaps your vision isn't something that can be built in the real world. You can't do much about that. But you can do something about other reasons, such as not using Crystal Reports properly or not being aware of all its capabilities.
Note
As I mention at the beginning of this chapter, Crystal Reports gives you tremendous freedom in how you can lay out your report as well as what you can include. Maybe text works better than columns of numbers, or your report might benefit from using graphical images.
The bottom line is this: If you feel sure that a report ought to be able to include something, you can almost certainly do it with Crystal Reports. This book tells you about many of the most powerful and useful features of Crystal Reports. If I don't mention a feature or capability that you'd like to use, it may nonetheless be available. Check the online help for additional information on advanced features. Crystal Reports is a product of Business Objects, an SAP company. More information on Crystal Reports can be found at www.businessobjects.com.