In This Chapter
Using the report creation wizards
Getting your report data
You can start a report in any of several ways. Chapter 2, for example, shows how to create a report from scratch, starting with a blank report file. Another way is to use an existing report as a template; the new report has different content but is structurally similar to the existing report. Generally the quickest way is to use the Report Creation Wizard, which does much of the work for you but makes some assumptions that limit your options.
This chapter follows the speediest approach: I walk you step by step through building a report with the Report Creation Wizard. If you take this route, you do give up some freedom and flexibility (compared with the from-scratch approach), but you spend less time because the wizard does much of the work for you — fast.
Using the Report Creation Wizard is often the best way to create a report that's conceptually simple and doesn't require unusual formatting or a custom appearance. The wizard is easy to access and offers a few standard layouts.
Note
If you produce a report that's close to one of the templates used by Standard Report Creation Wizard, it's usually quicker and easier than designing a report from scratch.
When you first launch Crystal Reports, it displays the Start Page. Several wizards are listed. For example, select the plain-vanilla one named Report Wizard. The wizard goes into action and displays the Standard Report Creation Wizard dialog box, as shown in Figure 4-1.
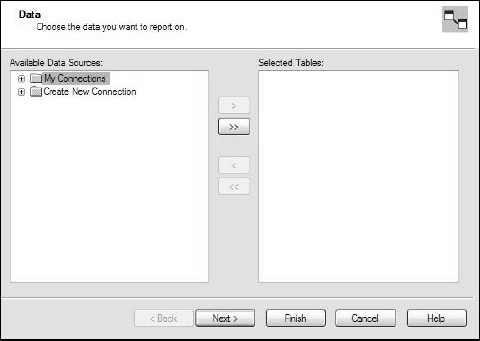
This looks very much like the Database Expert dialog box in Chapter 2; it acts in much the same way, too. Follow along to create a report with the wizard.
Start with a standard report, which is the one most people need most of the time. The example is from the fictitious Xtreme Mountain Bikes Inc., which is a business that sells mountain bikes and associated accessories. However, its information needs are much the same as the needs of any business that buys products from suppliers and sells them to customers. Thus, the kinds of standard reports that Xtreme needs are representative of the reports that many retail or wholesale businesses would find useful. All the data for Xtreme's reports is contained in the xtreme.mdb database file (see Chapter 2 for details about Xtreme).
Suppose that Xtreme's sales manager wants a report on all orders placed in December 2004. She wants the report to include the order date, order number, salesperson's name, and order amount. To build this report, data must be extracted from two different tables. Follow these steps to get it done:
Start Crystal Reports.
The Welcome to Crystal Reports dialog box appears.
Make sure that the Report Wizard option is selected, and then click OK.
The Standard Report Creation Wizard dialog box appears (refer to Figure 4-1).
Connect to the target database (
xtreme.mdb) if you are not already connected.See Chapter 2 if you don't know how to connect to your database.
Click the plus sign to the left of the database name, and then click the plus sign to the left of the Tables item.
A list of all the tables in the database displays.
To follow along with the example, click the plus sign to the left of the Xtreme sample database,
xtreme.mdb, and then click the plus sign to the left of the Tables icon. You see the names of the tables in the database, as shown in Figure 4-2.Select the tables that contain data that will be used by the report, moving them to the Selected Tables pane.
To follow along with the example, double-click the Orders table in the Available Data Sources pane to move it to the Selected Tables pane. Do the same for the Employee table.
Click Next.
Standard Report Creation Wizard displays Link view.

The main pane in Link view shows the tables, along with the link between them. Figure 4-3 shows what Link view looks like at this point.
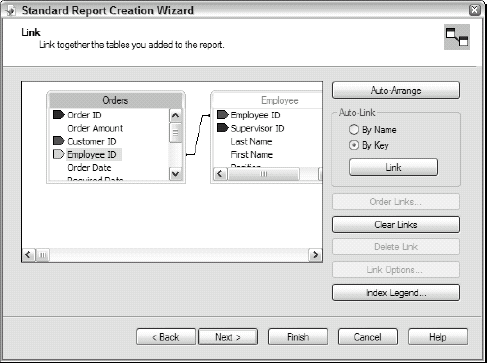
Figure 4-3. Link view of the Standard Report Creation Wizard dialog box shows the connection between the selected tables.
Tip
The Standard Report Creation Wizard has inferred that columns with the same name in different tables refer to the same objects — a valid assumption in this case, but this may not always be true. If any link that the wizard has assumed is incorrect, you can change it manually: Just click it to remove it, and then drag the pointer from the first table to the appropriate column in the second table add a new link.
After tables and links are arranged to your satisfaction, do the following to continue with the example:
Click Next in Link view of the Standard Report Creation Wizard.
Fields view appears.
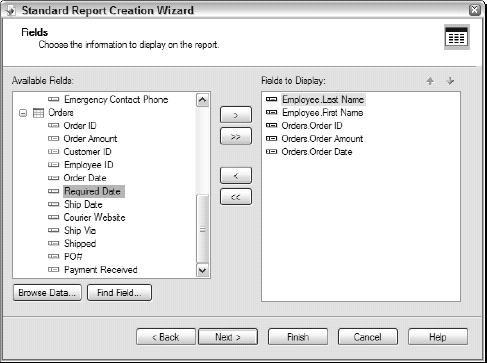
From the selected tables in the Available Fields pane, select the fields you want for the report and click the > button to move them to the Fields to Display pane.
To follow along with this running example, choose the following:
Employee table: Select Last Name and First Name.
Orders table: Select Order ID, Order Amount, and Order Date.
At this point, the Standard Report Creation Wizard looks like Figure 4-4.
Click Next.
Grouping view appears.
Because you don't want to do any grouping in this report, click Next.
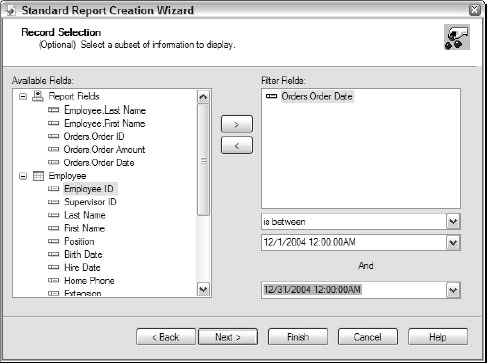
Record Selection view appears. (See upcoming Figure 4-5.)
Double-click the field in the Available Fields pane that you want to filter on to move it to the Filter Fields pane.
For this example, you want to filter out all orders that were not placed during December 2004 (or December of whatever year your copy of
xtreme.mdbcontains), so double-click the Orders.Order Date field.Pull down the list below the Filter Fields pane and select the method for filtering. Then make any secondary filtering selections, if necessary.
For the example, select is between. In the sublist, select the dates of the first and last orders that were placed during December 2004 (as in Figure 4-5). To illustrate the principle, you may select any month displayed in the
xtreme.mdbdatabase.Click Finish.
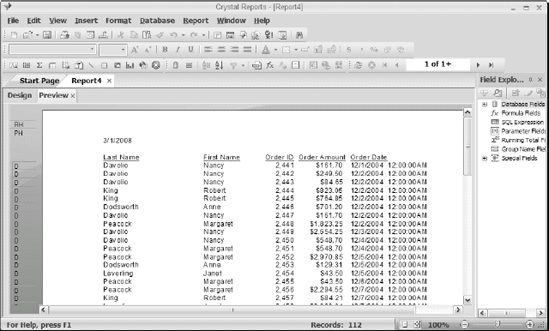
The finished report is displayed, using the Preview tab in Crystal Reports, as shown in Figure 4-6. If Field Explorer is still displayed, you can dismiss it to show more of the right side of the report. (Read more about Field Explorer in Chapter 2.) You can also drag the left boundary of the report area farther to the left if needed.
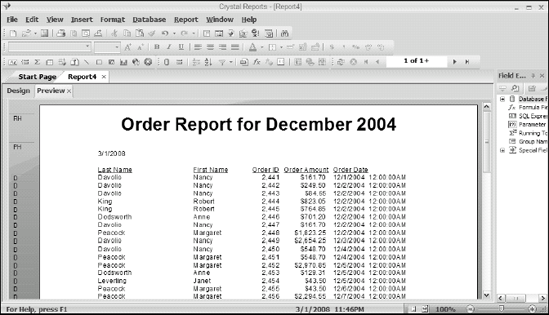
Not a bad start, but you probably want to make it clear what this report is about by adding a report header; see Figure 4-7. You can also change column headings in the Page Header band if you want to. In general, you can use Standard Report Creation Wizard to do the bulk of the layout for a fairly standard report, and then fine-tune the result using the tools available on the Design tab. (Turn to Chapter 2 to add a report header.)
When you're satisfied with your report, save it by choosing File
Using the Standard Report Creation Wizard gives you a good idea of how Report Creation wizards work. The other report-creation wizards, which are accessible from the Start Page, have a lot in common with the Standard Report Creation Wizard, as follows:
Cross-tab Report Creation Wizard builds a report that displays data as a cross-tab object. I cover cross-tab reports thoroughly in Chapter 16.
Mailing Labels Report Creation Wizard automates laying out sheets of mailing labels. It's already set up for standard commercial label formats, but you can also design a custom label format.
OLAP Cube Report Wizard displays OLAP (Online Analytical Processing) data as a grid. OLAP reports are similar to cross-tab reports but have different data sources and a distinctive data structure. (For more about OLAP and how to report on OLAP data, see Chapter 13.)
Using report wizards can save you considerable time and effort. In many cases, however, starting with a blank report is the best choice if what you want doesn't jibe with what one of the report wizards is designed to produce.
Tip
You aren't limited to choosing one path or the other, though. Sometimes it makes sense to use the Standard Report Creation Wizard to generate the basic structure of your report, and then switch to the Design tab to modify the report into the final product.
Chapter 2 leads you step-by-step through the development of a basic report from a blank report. If you go that route, look there for pointers. In the following chapters, you can design and build a variety of reports, each one starting from a blank report. Later chapters of this book build upon mastering basic from-scratch report design.
Crystal Reports uses several methods to accept data from a variety of data sources. The software's wide data compatibility makes it a versatile tool that has uses beyond the creation of reports from data in relational databases.
Among others, Crystal Reports can accept data from direct-access database files, XML and Web Services, ODBC data sources, JDBC data sources, Java Beans connectivity, OLE DB data sources, OLAP files, and Salesforce.com files. Each type of file is accessed in a different way; Crystal Reports makes the connections for you.
The fastest way to pull data from a database and include it in a report is through a direct-access interface. This makes sense because the fewer layers you have between the database and the report, the shorter the transit time as data goes from one to the other. Another advantage is the simple connection. As a report designer, you don't have to fuss with types of connections and middle-tier dynamic link libraries (DLLs). You just name the data source you want to tap for data, and tell Crystal Reports to go get that data.
However, as you know, There Ain't No Such Thing as a Free Lunch (TANSTAAFL). The price you pay for the speed and simplicity of a direct connection is the need for a different, highly customized driver for every different data source. This is usually not a problem because Crystal Reports offers a wide variety of such drivers — unless your report draws data from two or more different data sources. In such a case, you can't use direct access; you have to talk to each data source in its own "language," and Crystal Reports doesn't support using multiple languages in a single report.
Crystal Reports has direct access drivers popular in PC database formats, including Microsoft Access, and the dBase/FoxPro/Clipper triad known collectively as xBase. In addition, it supports Microsoft DAO/OLE, Btrieve, ACT!, COM, Microsoft Exchange, and Microsoft Outlook. Crystal Reports has direct access drivers for the following client-server SQL databases: Microsoft SQL Server via Microsoft .NET, Sybase, and Informix. Other data sources too numerous to mention are also supported. If it holds data, is fairly widely used, and runs on a Windows box, Crystal Reports probably had a direct-access interface for it.
Connecting to ODBC data sources
In addition to using a direct access driver, you can connect to a database several other ways. One is ODBC (Open Database Connectivity).
ODBC is a standard method of connecting to a wide variety of data sources. It places a layer in the networking model between applications such as Crystal Reports and the databases they use; that layer is where ODBC-standard requests from the application are translated into the specific form required for each different data source. Practically all data sources in use today offer an ODBC interface, through which the ODBC driver connects to the database. All the application has to know is that it's communicating with an ODBC-compliant data source.
An ODBC database connection might not perform quite as well as a direct-access connection because the data has to pass through an extra layer of processing. This might or might not be a problem, depending on the implementation and the needs of the application. On the plus side, an application that communicates to its data sources through ODBC can pull data from multiple different data sources. It puts out its request in the same ODBC format, regardless of which data source it's talking to. Each such source has its own ODBC driver that translates the common ODBC commands into data source-specific commands that the data source can understand and obey.
Data sources for which Crystal Reports has a direct-access connection are also reachable through ODBC. For example, you can connect to Microsoft Access either through the direct connection or through ODBC. Direct connection might give you better performance but only if your report requires data only from Access. However, if you want to include data from both Access and a second data source, you must use ODBC for both Access and that second data source. Performance might be slower, but it beats not being able to connect at all.
You can use Crystal Reports to create SQL queries of ODBC data sources. The query runs on a server and returns a result set to your computer. Offloading some query processing frees your computer to concentrate on other tasks, possibly improving overall performance. A second advantage is that you can use the full power of SQL to retrieve exactly the data you want.
Note
SQL is the international standard language for communicating with databases. It differs from most common computer languages in that it's nonprocedural: That is, it deals with data one set at a time rather than one record at a time. Database developers use SQL. If you're a database user (rather than a developer), Crystal Reports might provide you with everything you need to get what you want from your databases.
Again, though, TANSTAAFL. You must be fluent in SQL to use the SQL Expression Editor in the Formula Workshop. I cover the use of Formula Workshop in Chapter 10. Gaining fluency in SQL requires some effort, but might be well worth the time. Start by reading SQL For Dummies, 6th Edition, or SQL All-in-One Desk Reference For Dummies (by yours truly, both published by Wiley). The first book gives you a painless introduction to SQL and a thorough description of all major features of the language. The second book covers more topics and goes into greater depth.
Warning
When you run a Crystal SQL query, it returns a snapshot of the data at the time the query was run. If the data in the database is updated later, you have to rerun the query to capture the changes.
OLE DB is a connectivity methodology similar to ODBC. (No surprise here, seeing as how Microsoft developed both.) OLE DB adds some flexibility in the types of data sources that it can communicate with, such as multidimensional OLAP sources and Web servers. ODBC communicates with relational databases that use SQL; OLE DB covers the rest, addressing data sources that don't use SQL (although it works well with relational databases, too). Crystal Reports supports OLE DB data sources, which are OLE DB providers.
Deciding which interface to use depends on you and your needs. (You knew I was going to say that, didn't you?) You can draw a few conclusions from the information in this chapter; here are some guidelines for openers:
If your report draws data from only one source and there's a direct-access driver for that source, using that driver is probably your best bet for good performance.
If your report draws data from two or more different sources, direct access is not an option.
If you're drawing data from multiple relational databases, ODBC is designed to give you what you need.
If one (or more) of your multiple data sources is not compatible with ODBC but all your data sources support an OLE DB interface, OLE DB should be your connectivity choice.
Here are two other more-specific pieces of advice:
SQL programmers can use Crystal Reports when they want to do a complex retrieval, and the connection between client and server has only limited bandwidth.
The result set returned by an SQL query is a snapshot — it shows the state of the data sources at the instant the query was run. It does not necessarily reflect the current state of the data.
IT managers can keep their users out of trouble, protect sensitive data, and make the data sources easier to understand by building dictionaries that give users what they need in an understandable form but don't expose parts of the data sources that aren't relevant to the users' jobs. Such dictionaries are transparent to report developers such as you. They are primarily to protect sensitive data. If your organization uses such dictionaries, you probably won't even know it.
Now that you know how to get Crystal Repots started, and how to connect to a data source, it's time for the main event, actually retrieving from the data source the information that you want. Chapter 5 tells you how.