
In This Chapter
Defining and applying OLAP
Retrieving OLAP data with Crystal Reports
Computer geeks have a maddening tendency to refer to things by inscrutable acronyms, sometimes even pseudo-acronyms, such as SQL — which, believe it or not, does not stand for Structured Query Language. (Read the sidebar on SQL to see why.) The letters in BASIC, FORTRAN, and COBOL once stood for something, as did the letters in the late, lamented SNOBOL. OLAP is a new entry in the list of obscure computer acronyms, but at least it's real. OLAP stands for On-Line Analytical Processing. In this case, the name does bear some resemblance to what the technology is actually about.
OLAP is a form of data mining that enables non-programmers to extract the information they need from an OLAP database. OLAP databases are structured differently from the way ordinary relational databases are structured, in order to make possible the retrieval of desired information using OLAP grids. With Crystal Reports, you can build OLAP grids that operate on OLAP databases, in effect pulling needles out of digital haystacks, without the aid of a formal query language such as SQL.
OLAP is called On-Line because it happens in real time, with the user sitting in front of the screen while there's a direct connection to a database. The results of user actions are immediate (more or less). The operation itself is called Analytical Processing because its main function is to quickly analyze huge quantities of data and deliver meaningful information to the user. The information arrives in a form that the user can readily comprehend and act on.
Huge amounts of data are stored in relational databases belonging to organizations of all sizes and types. You can retrieve information from these databases using queries written in SQL, or by using a graphical approach such as Query By Example (QBE), which gets translated into SQL and then executed. Either way is great — if you're an SQL guru or someone equally skilled in QBE usage.
OLAP is for people who don't even know what a nested SELECT is, let alone a LEFT OUTER JOIN. OLAP is a tool designed for managers who must make decisions based on a needle of information buried in a haystack of data. OLAP gives people who are not database specialists the capability to find that needle quickly.
A spreadsheet gives you a two-dimensional view of the data you're displaying, as do most reports you create with Crystal Reports. It's the classic row-and-column approach: for example, a company's line items for income and expense arranged in rows, while months or quarters go in columns. Another example is an instructor's course records: say, student names in rows, and assignment grades and exam scores in columns. Many common situations can be represented very well with these two dimensions. Others, however, require three (or even more) dimensions to convey what the data means.
OLAP is designed to work with these more challenging data sets. A multidimensional OLAP representation of complex data is an OLAP cube. Even though the word cube implies three dimensions, an OLAP cube can have more than three dimensions. (This does not mean that parts of some OLAP cubes reside in hyperspace. These extra dimensions are conceptual, not spatial.)
What kinds of reporting tasks might require more than two dimensions? Suppose that a company displaying income and expense data by month wants to expand the report to show the data for the past ten years. Income and expense could be one dimension; January through December could be a second dimension; and the years could be a third dimension.
Here's another example. Suppose that an instructor is teaching a distance-learning course with clusters of students meeting in 15 different cities. An OLAP cube could have student names in one dimension, assignment grades and examination scores in a second dimension, and student location in a third dimension. Any application that lends importance to more than two aspects of the data is a candidate for storage in an OLAP cube and presentation in an OLAP report.
Multidimensional OLAP data is different from ordinary relational data in a relational database. Consequently, you access it differently than you access relational data. Here are the two ways to access OLAP data:
Directly: For a direct connection to function, you need an installed OLAP client and some specialized DLLs (dynamic link libraries).
An Open OLAP gateway: An Open OLAP connection doesn't require either an OLAP client or any special DLLs. However, it does require a Name Server host that communicates with both Crystal Reports and your OLAP data source.
Crystal Reports doesn't create OLAP cubes — the database management system (DBMS) that Crystal Reports is working with does that. Crystal Reports currently creates OLAP reports based on three types of data source.
Hyperion Essbase (7.0, 7.1)
IBM DB2 OLAP (8.2) Enhanced
Microsoft OLE DB Provider for OLAP Services 8.0
Note
The IBM product is actually Essbase in disguise. IBM acquired Hyperion and integrated Hyperion's products into the IBM product line.
A report containing OLAP data consists of one or more OLAP grid objects, which are two-dimensional slices through a three-dimensional cube. Multiple slices give the report a third dimension.
Depending on how you want to look at the data, you might slice a cube in different directions. This process, called slicing and dicing, allows you to play with the data until you display it in the most informative way. You can also add dimensions to either the horizontal or vertical axis to analyze three or more dimensions in a single OLAP grid. Alternatively, you can create multiple OLAP grids within a report.
Tip
If you have a choice between building a wide report with many columns across the page and little or no depth, or a report with fewer columns across the page coupled with more depth into the third dimension, take option two. Crystal Reports processes narrow and deep grids faster than it processes wide and shallow ones.
To demonstrate how to create an OLAP report, here's a chance to slice and dice some data from a cube based on the Xtreme database and see what it can tell you. The Business Objects Web site has a sample OLAP cube that you can download named Sales Reports.cub. It records the sales, budget, and cost records for a fictitious grocery store chain. You can find it at
http://support.businessobjects.com/communityCS/FilesAndUpdates/cr_xi_xtreme_report_samples_en.zip.asp |
This is the same place where you can download the xtreme.mdb database. Download the ZIP file if you haven't already done so, and unzip it. In the en folder, select Samples, and then select Databases.
The following sections take you through a step-by-step procedure for creating an OLAP report based on the Sales Reports.cub cube. You start by specifying a data source. Then you define the grid structure, set sliced dimensions and add pages, apply a predefined style, and finally generate a report.
The first step in the process is to tell Crystal Reports where to find the data that the report will be based upon.
From the Crystal Reports Start Page, select the OLAP Cube Report Wizard.
The OLAP Data dialog box appears.
Click the Select Cube button.
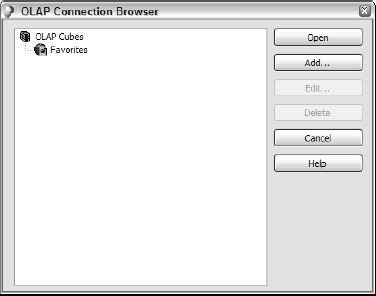
The OLAP Connection Browser appears, showing connected OLAP servers, as shown in Figure 13-1.
If the source of your cube is listed on the OLAP Cube tree, select it and then click Open. If not, click the Add button.
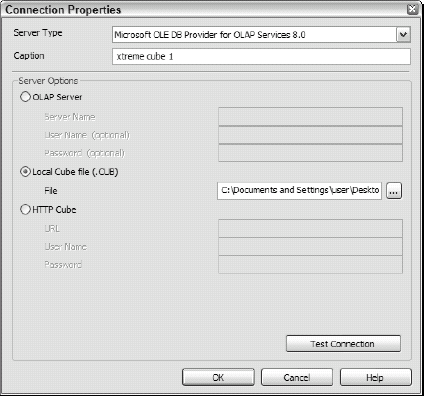
When you click Add, the Connection Properties dialog box appears.
In the Connection Properties dialog box (see upcoming Figure 13-2), specify the location of your cube (whether on a remote server, as a local CUB file, or as an HTTP cube on the World Wide Web).
To follow along with the example, for Server Type, select Microsoft OLE DB Provider for OLAP Services 8.0.
For Caption, fill in some appropriate identifier for this connection.
For this example, type xtreme cube 1.
Under Server Options, specify Local Cube file (.CUB) and click the ellipsis button (with three dots) to the right of the File text box.
In the Open dialog box that appears, find the
Sales Reports.cubfile. It's located wherever you placed it when you downloaded it.Select
Sales Reports.cuband then click the Test Connection button.If all is well, a small OLAP dialog box appear with the cheerful connected successfully message.
Click OK. Back in the Connection Properties dialog box, click OK.
At this point, the Connection Properties dialog box should look something like Figure 13-2.
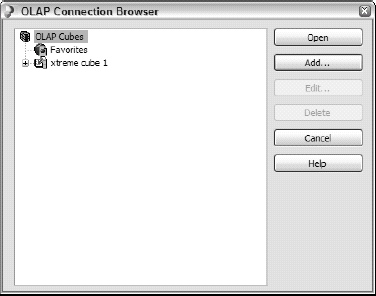
You return to the OLAP Connection Browser, which now displays your cube in the tree (showing that the Xtreme cube is connected), as shown in Figure 13-3.
Click the plus sign to the left of the icon for xtreme cube 1.
This drops down to a level named Sales Report.
Click the plus sign to the left of the folder icon for Sales Report.
This displays the cube itself, named Sales Report.
Select your cube and then click Open.
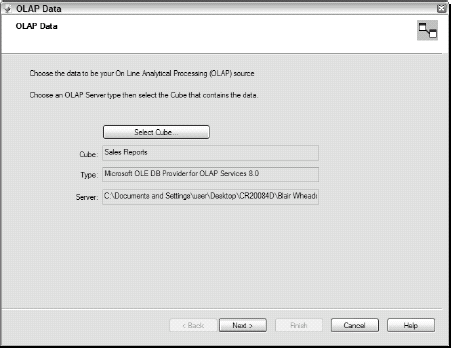
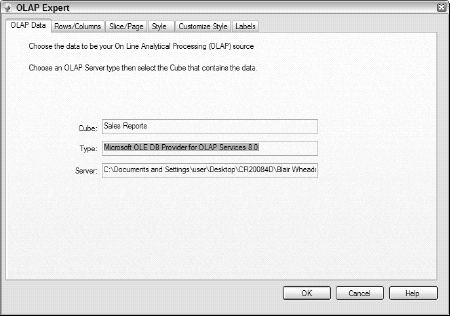
The OLAP Data dialog box displays, as shown in Figure 13-4.
The identifying information about your cube is already filled in. Verify that it is correct and then click Next.
The Rows/Columns dialog box appears, as shown in Figure 13-5.
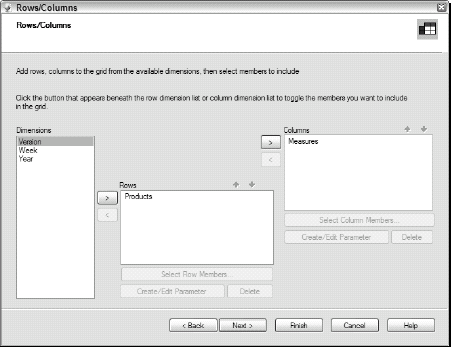
Now structure the OLAP grid the way you want it.
This cube has three dimensions: Products, Sales, and Dates. The wizard suggests that Sales entries (which are things that can be measured) be shown in columns and that Products entries be shown in rows. You want to take a slice through the cube that shows the data for the first week of last year. To do so, leave alone the structure that Crystal Reports has assumed in the Rows/ Columns dialog box, and click Next. The Slice/Page dialog box appears, as shown in Figure 13-6.
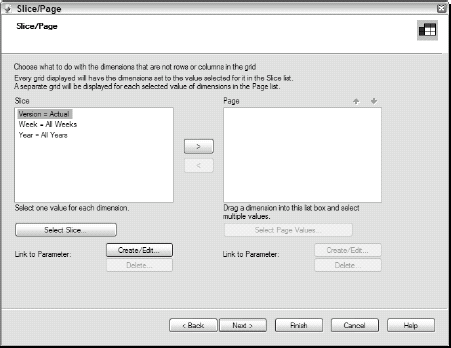
The task here is to specify the timeframe you want the report to cover.
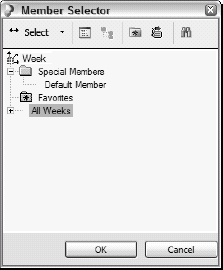
Select Week = All Weeks and then click the Select Slice button.
The Member Selector dialog box shown in Figure 13-7 is displayed.
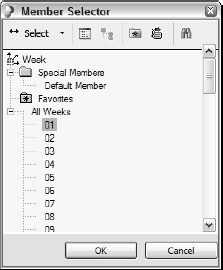
Click the + sign to the left of All Weeks to expand the tree.
The tree expands as shown in Figure 13-8.
Select 01 and then click OK.
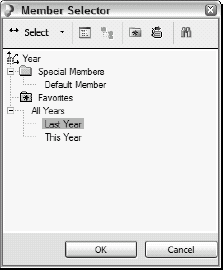
Upon returning to the Slice/Page dialog box, select Year = All Years. and then click the Select Slice button.
The Member Selector dialog box appears, this time showing All Years.
Click the + sign to the left of All Years to expand the tree.
Select Last Year, as shown in Figure 13-9, and click OK.
Upon returning to the Slice/Page dialog box, click Next.
The Style dialog box opens, as shown in Figure 13-10.
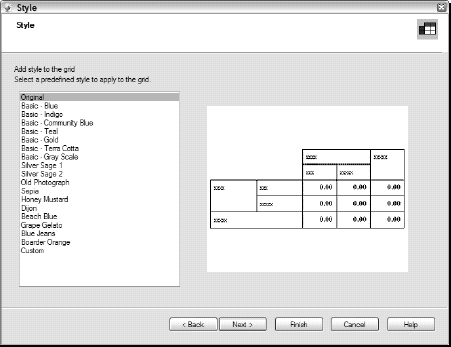
Select a style from the Style dialog box, and then click Next. For this example, I'm going with the simple and classic Original style.
If you want to include a chart in your report, select a chart type from the Chart dialog box. Fill in the appropriate entries for Chart Type, On Change Of, and Subdivided By. I chose not to include a chart for this example.
When you have your report set up, click Finish in the Chart dialog box.
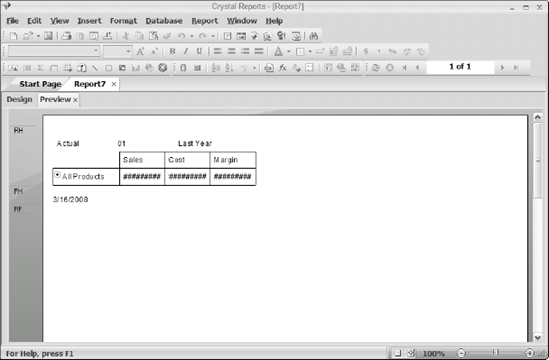
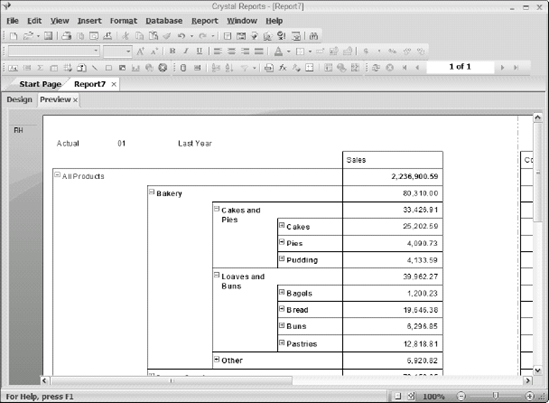
A completed report with no associated chart appears, as shown in Figure 13-11. Depending on the complexity of your report and the speed of your computer, this could take some time. Some tweaking is in order; the numbers in the Sales, Cost, and Margin columns are too large to fit in the boxes provided. These are easy to expand, however, by switching to Design view and dragging the right-side handles of the Value fields horizontally to the right.
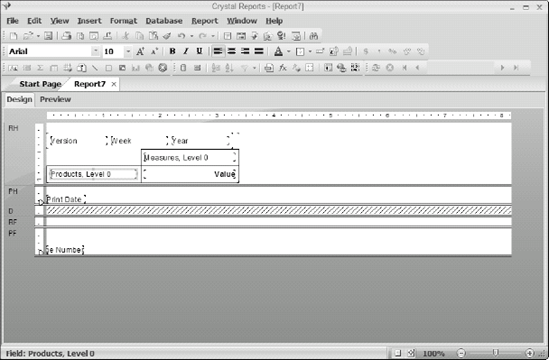
To adjust the widths of the columns, switch to Design view, which looks something like Figure 13-12.
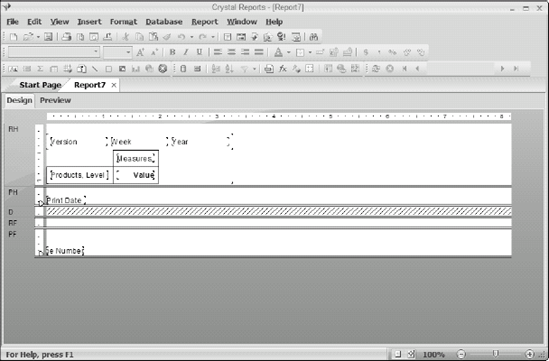
Select the Value text object and expand it to the right by dragging its right drag handle.
Repeat Step 1 for the Products.Level text object.
Your report, in Design view, now looks like Figure 13-13.
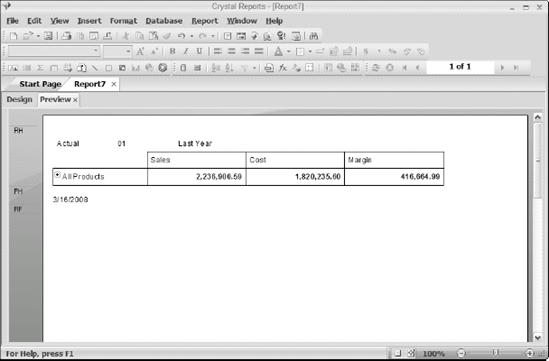
In Preview view, the report now looks like Figure 13-14.
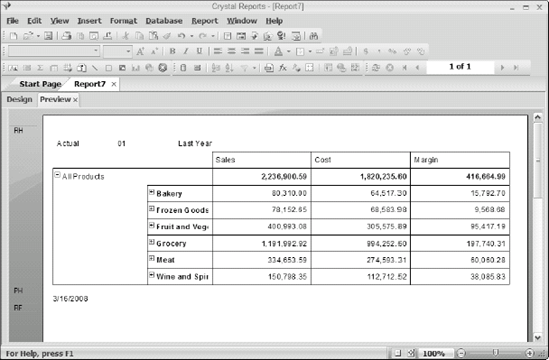
Click the + sign to the left of All Products. The All Products category expands to show the breakdown between major product categories. The total Sales, Cost, and Margin figures remain at the top, but now there are individual totals for Bakery, Frozen Goods, Fruits and Vegetables, Grocery, Meat, and Wine and Spirits, as shown in Figure 13-15.
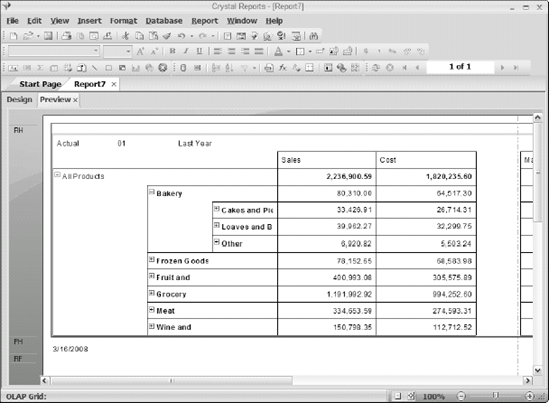
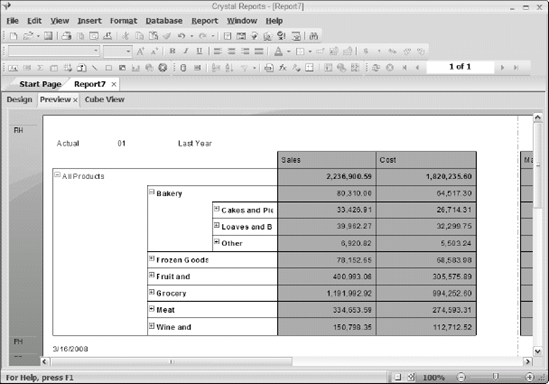
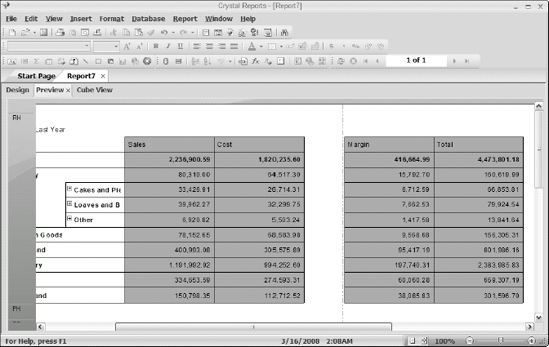
Now the major product categories also have a + sign to the left. By clicking the + sign at each level of detail, you can delve down to a deeper level. Figure 13-16 shows the result of expanding the Bakery category, and Figure 13-17 goes one level deeper.
An OLAP report can be a powerful tool for analyzing multidimensional data, enabling decision makers to make better decisions, based on a better understanding of the facts.
Because an OLAP report is based on an OLAP cube created by a database management system, any change in the underlying cube could cause errors in the production of the report. The report might even come out blank if, for example, the location of the OLAP cube has changed, and Crystal Reports can no longer find it. Other problems occur if a dimension has been removed from the cube or a field used by the report is removed.
To reconnect a report to a cube whose location has changed, perform the following steps:
In the report, select the grid by right-clicking within the border.
From the menu that pops up, choose Set OLAP Cube Location.
A dialog box appears, reading, "Warning: It is not possible to undo this command. Would you like to perform the command anyway?"
If you're sure that your OLAP cube location has changed and that your report is no longer valid, click Yes.
The Set OLAP Cube Location dialog box appears, displaying what Crystal Reports currently thinks the cube location is.
Specify the new OLAP Server location by clicking Select and then use the Crystal OLAP Connection Browser that appears to locate the cube.
The Connection Properties dialog box displays.
Select the new cube location and click Open.
In the Set OLAP Cube Location dialog box that appears, click OK.
Your OLAP cube is now reconnected to its source database at its new location.
You can do a number of things to enhance the appearance of an OLAP grid. Often such enhancements make it easier to convey the important facts contained in the grid. As I mentioned earlier, you can easily change the width and height of the grid cells by moving to Design view, selecting them, and then dragging the cell handles to give the cell the desired dimensions.
You can do lots of other things:
Highlighting Expert: You can use Highlighting Expert to apply conditional formatting to the grid fields. Access Highlighting Expert by right-clicking the field you want to format, and then choosing Highlighting Expert from the contextual menu that pops up. See Chapter 8 for more about Highlighting Expert.
Format Editor: You can use Format Editor to apply absolute formatting to fields in the grid. For this function, right-click the field you want to format, and choose Format Field from the contextual menu. Chapter 8 covers Format Editor.
Formula Workshop: You can use Formula Workshop to create your own custom formula for conditional formatting. This can be as elaborate and obscure as you like. Formula Workshop is the most powerful tool for controlling formatting of an OLAP grid. I cover Formula Workshop in depth in Chapter 10.
OLAP Expert: You can use OLAP Expert to reformat the entire OLAP grid. It can do everything that the OLAP Report Creation Wizard can do, plus a couple of additional functions. One of the many things you can do with the OLAP Expert is to change a dimension's background color.
Here's how to change the background color of one of the dimensions of the OLAP grid that I show you how to create earlier, as shown in Figure 13-8.
Invoke OLAP Expert by right-clicking in the upper-left corner of the grid and choosing OLAP Grid Expert from the contextual menu that appears.
OLAP Expert appears. At this point, all the identifying text fields should be filled in, as shown in Figure 13-18.
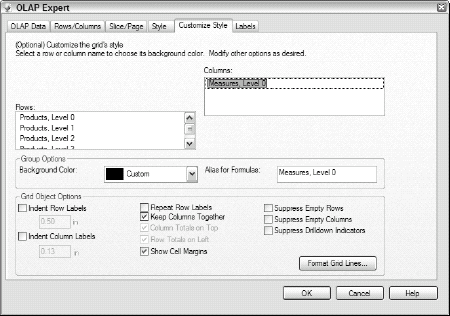
Click the Customize Style tab.
Figure 13-19 shows what this looks like. Note that the background color for the Product Name, Level 0 group option is set to Custom.
Pull down the Background Color menu and choose the color you want for the background of the Product Name columns.
For this example, I chose aqua.
Click OK.
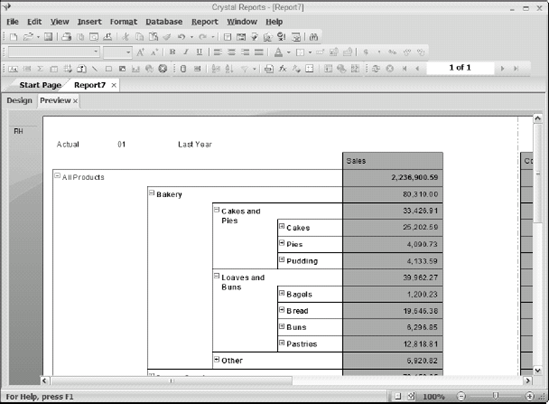
Figure 13-20 shows the result. The Level 0 product column now has a background color of aqua. The Level 1 background column is unaffected, as are the other areas of the grid. Of course in this book, you cannot tell that the background color has changed to aqua. However, you can tell that it has changed to something other than white. Take my word for it. I am looking at it on a color screen. The Level 0 background color has changed to aqua.
Dimension names come from their source cube, so they're not under your control. These dimension names could be extremely long, making them tedious to include in formulas. To remedy this, you can substitute an alias for a dimension name.
On the Customize Style tab of OLAP Expert (refer to Figure 13-19), select the dimension for which you want to create an alias.
With the dimension selected, in either the Rows or Columns boxes, enter the alias name in the Alias for Formulas field.
Click OK.
You can now use your shorter alias in any formulas involving that dimension.
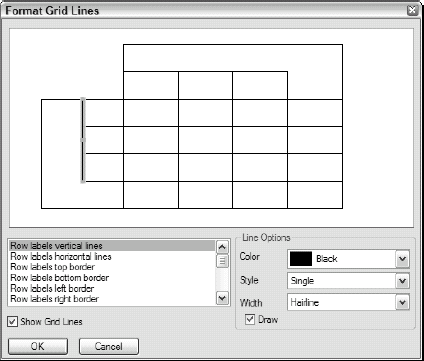
The default grid lines that define the rows and columns of the grid are fine for most applications. However, you have the flexibility of either displaying the grid lines or not, as well as selecting their color, style, and width.
On the Customize Style tab of the OLAP Expert (refer to Figure 13-19), click the Format Grid Lines button.
The Format Grid Lines dialog box appears, with a layout of a sample grid, as shown in Figure 13-21.
In the list on the left, specify the row label attributes, column label attributes, or cell attributes that you want to change. Alternatively, you can select the line you want to change by just clicking it.
From the pull-down menus on the right, specify the color, style, and line width that you want for the specified attributes.
When the grid image in the top part of the dialog box matches what you want, click OK.
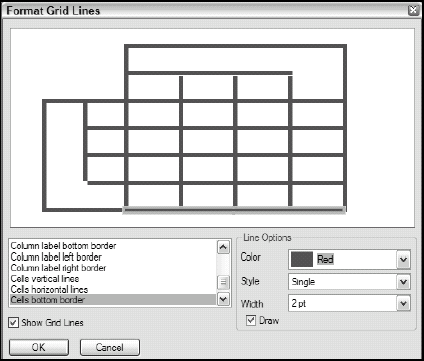
I chose solid red lines, with a line width of 2 points, giving me the appearance shown in Figure 13-22. Actually, you probably can't tell that the lines are red. You might be able to discern that they are not as dark as black lines would be. You should certainly be able to tell that they are thicker than the standard hairline grid lines.
You can control which dimensions are labeled and which remain unlabeled. Use the Labels tab of OLAP Expert to display labels. Figure 13-23 shows the Labels tab.
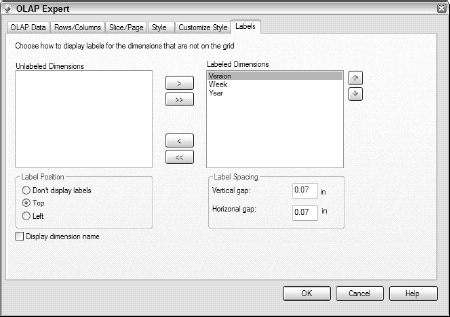
As you can see, you can choose which dimensions are labeled and which are not. You can also choose where to position a label as well as the vertical and horizontal spacing between labels.
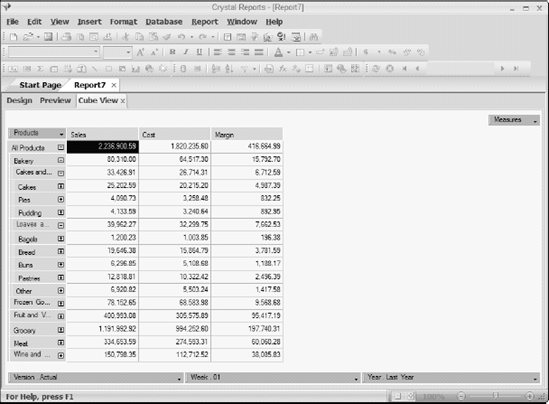
You can change quite a few things in Preview mode. Some of these are discussed in the previous section. Others are discussed in this section. You can also make changes in Cube view. To take a look at Cube view, right-click in the upper-left corner of the grid to display the shortcut menu. From the menu, choose View Cube. The cube from which your grid is derived displays. It most likely looks something like the cube I have been using in the examples so far, as shown in Figure 13-24.
In this section, I stick to describing the changes you can make in Preview mode. You may never have to exercise the advanced capabilities available in Cube View mode.
Suppose you want to hide a dimension to reduce potentially confusing clutter in the grid.
Right-click the dimension of the members you want to hide.
In this example, I right-click Bakery.
From the shortcut menu, choose Collapse Member.
The details disappear, as shown in Figure 13-25.
You can expand a dimension in a similar manner.
Right-click the dimension of the members you want to show.
I right-click the Bakery cell.
From the shortcut menu, choose Expand Member.
The details now show, as shown in Figure 13-26.
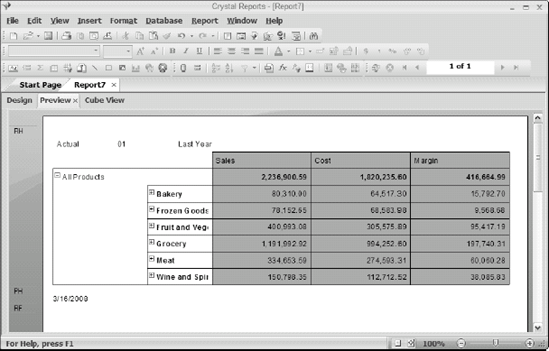
Figure 13-25. A dimension has been hidden.
You can add totals to a grid with the following steps:
Right-click the dimension that you want to total.
For this example, I right-click in the Sales cell.
From the shortcut menu, choose Automatic Totals.
From the submenu that appears, choose Rows (Across).
The amounts in the rows are now totaled, and the totals are displayed in the grid, as shown in Figure 13-27.
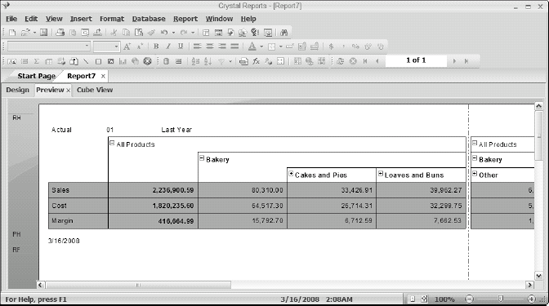
To exchange the roles of rows and columns, you can pivot the OLAP grid. Right-click the border of the grid to display a shortcut menu. From the menu, choose Pivot OLAP Grid. This flips the grid, as shown in Figure 13-28.
You can change the order of the members in the grid, either rows or columns. Here's how:
Expand the row or column that you want to reorder. (Refer to Figure 13-26.)
I picked the Frozen Goods cell.
Right-click the dimension you want to reorder to display its shortcut menu.
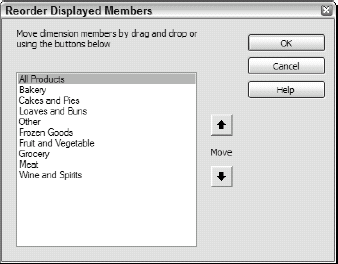
From the menu, select Reorder Displayed Members.
The Reorder Displayed Members dialog box appears, as shown in Figure 13-29.
The customers are displayed in the order they hold in the cube.
Select an individual member, such as Frozen Goods, and then move it up or down in the list, using the up and down arrows to the right of the list of members.
When you have the members arranged the way you want, click OK.
In addition to rearranging individual rows and columns in a grid, you can also sort rows and columns based on the values they contain. You can easily add multiple sorts to a grid, and just as easily edit or delete them.
To add a sort to a grid, right-click the desired row or column member.
From the shortcut menu that appears, choose Add First Sort.
A submenu appears with options:
Ascending
Descending
Ascending, Break Hierarchies
Descending, Break Hierarchies
Choose one of the submenu options.
The arrangement of items changes.
You can change the direction of a sort or remove a sort from the shortcut menu. You can also pile one sort upon another, sorting first on one member and then on others. You can either retain the Level 0/Level 1 hierarchy to keep related members together, or break that hierarchy to sort things without regard to group membership.
You can filter data to exclude data from the grid that is not important for your purposes. For example, you could filter out the top or bottom N members, or the top or bottom N percent of members.
Right-click the field that you want to filter.
From the shortcut menu that appears, choose Add Filter.
The Define Filter dialog box appears, giving you three choices in the Filter Type area: Actual Values, Top / Bottom N, and Top / Bottom N%.
Select a filter type.
In the Filter Definition area, select either Show Rows or Hide Rows and specify a condition, such as Cell value is less than 1000.
Click OK.