The albersUsa projection is one of many D3.js supplied projection objects. You can see the full list of these projections at https://github.com/mbostock/d3/wiki/Geo-Projections.
We don't have space to demonstrate all of these in this book, but a few are worth the effort to demonstrate a couple of TopoJSON concepts. Specifically, we will demonstrate the rendering of a map of the countries of the world, sourced from TopoJSON, and projected onto both flat and spherical surfaces.
For data in these examples, will use the world-110m.json data file provided with the TopoJSON data library source code available at https://gist.githubusercontent.com/d3byex/65a128a9a499f7f0b37d/raw/176771c2f08dbd3431009ae27bef9b2f2fb56e36/world-110m.json.
This data represents country data with features, specified at a 110-meter resolution.
Now let's examine loading and rendering of TopoJSON. The following example demonstrates the process:
Note
bl.ock (12.6): http://goo.gl/aLhKKe
The code does not vary much from the previous example. The change comes after the data is loaded:
var path = d3.geo.path();
var countries = topojson.feature(world,
                           world.objects.countries).features;
svg.selectAll('path')
    .data(countries)
    .enter()
    .append('path')
    .attr('d', path)
    .style({
        fill: 'black',
        stroke: 'white'
    });
The example still uses a d3.geo.path() object, but this object cannot directly be given the TopoJSON. What needs to be done is to first extract the portion of this data that represents the countries, which is done by calling the topojson.feature() function.
The topojson variable is globally declared in the topojson.js file. Its .feature() function, when given a TopoJSON object (in this case, world), and a GeometryCollection (in this case, world.objects.countries), returns a GeoJSON feature that can be used by a path.
The selection to render the map then binds to this result, giving us the following map:
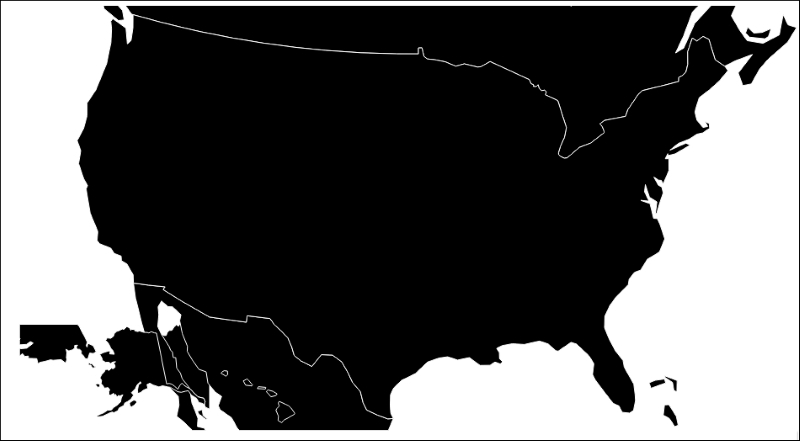
Whoops! That's not what we expected (but as we will see, it is exactly what we coded). Why is everything globed together? It is because we are still using the default projection, a d3.geo.albersUsa() projection.
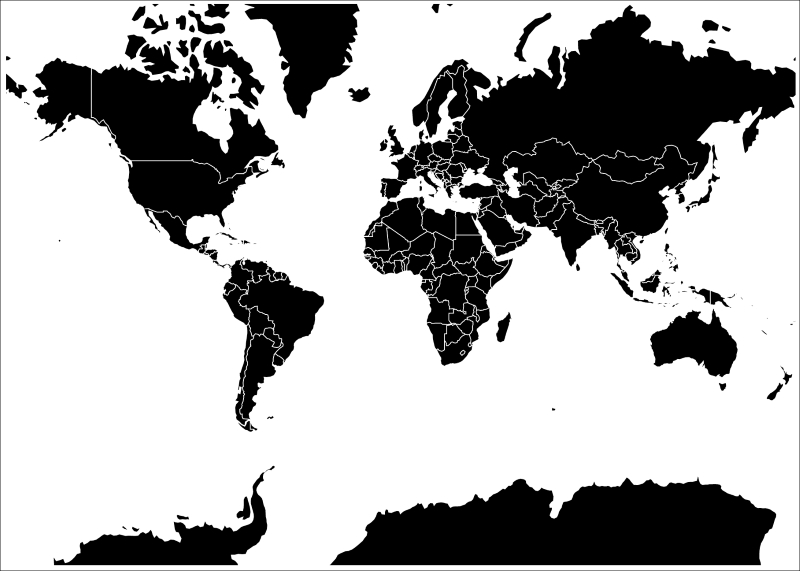
To fix this, we simply need to create a Mercator projection object, and apply it to the path. This is a well known projection that renders the map of the globe in a rectangular area.
The process is demosntrated in the following example:
Note
bl.ock (12.7): http://goo.gl/IWQPte
The only difference in this code is the setup of the path to use a Mercator projection object:
    var projection = d3.geo.mercator()
        .scale((width + 1) / 2 / Math.PI)
        .translate([width / 2, height / 2]);
    var path = d3.geo.path().projection(projection);
We need to give the projection object a little information about the width and height of our rendering, and the resulting map is now the following, which looks a lot more like the familiar world map:
Now let's change our projection to an orthographic projection. This projection maps data on to a simulated sphere. This is demonstrated by the following example:
Note
bl.ock (12.8): http://goo.gl/M464W8
This example simply changes the previous one by using a d3.geo.orthographic() projection object:
var projection = d3.geo.orthographic();
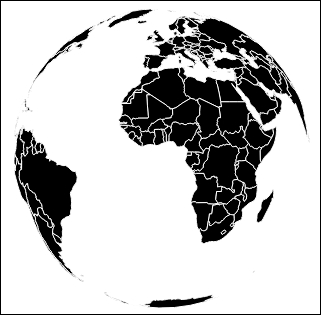
var path = d3.geo.path().projection(projection);The preceding example code gives us this beautiful rendering of the planet:
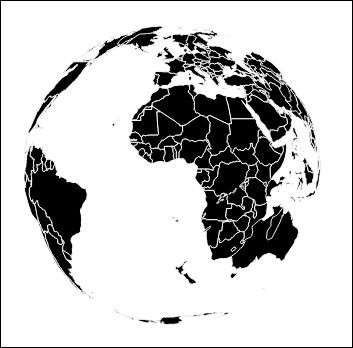
If you examine this closely, you will notice that it is not quite perfect. Notice that Australia seems to be colliding with Africa and Madagascar, and New Zealand is seen in the South Atlantic ocean.
This is because this projection renders through all 360 degrees of the globe, and we are essentially seeing through a clear globe to the backside of the land masses on the far side.
To fix this, we can use the .clipAngle() function of the Mercator projection. The parameter is the number of degrees around the center point to which the landmasses should be rendered.
The following example demonstrates this in action:
Note
bl.ock (12.9): http://goo.gl/G28ir0
This changes one line of code:
var projection = d3.geo.orthographic()
   .clipAngle(90);
And gives us the following result:
It may not be apparent in the image provided in the book, but this image of the globe on the web page is fairly small. We can change the scaling of the rendering using the .scale() function of the projection. The default value for scale is 150, and the corresponding values will make the rendering larger or smaller.
The following example makes the globe twice as large along with setting the center of the globe to not be clipped by the SVG container:
Note
bl.ock (12.10): http://goo.gl/EVsHgU
var projection = d3.geo.orthographic()
    .scale(300)
    .clipAngle(90)
    .translate([width / 2, height / 2]);
This orthographic projection, by default, centers the view on the globe at latitude and longitude (0,0). If we want to center on another location, we need to .rotate() the projection by a number of degrees of latitude and longitude.
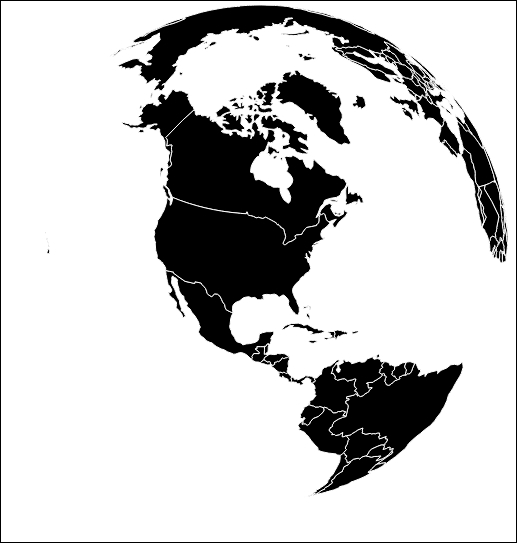
The following example rotates the globe to show the United States prominently:
Note
bl.ock (12.11): http://goo.gl/1acSjF
The one change to the projection is the following:
var projection = d3.geo.orthographic()
    .scale(300)
    .clipAngle(90)
    .translate([width / 2, height / 2])
    .rotate([90, -40]);
This change in the projection gives us the following result: