The first example will create a reusable bar chart component to demonstrate creating an AngularJS directive with an underlying controller. This is implemented within an HTML file, 01_just_bars.html, which consists of the following components:
- The AngularJS application object: This functions as an entry point for AngularJS code in the page (that is, in
app.js) - An AngularJS controller (in
controllers/basic_dashboard.js): This creates the data and sends it to the directive that renders the HTML code for the graph - The directive: This renders the D3.js bar chart in
directives/bars.js.
The AngularJS application is presented to the user via a web page, which begins by loading the AngularJS and D3.js libraries (this is common in all the examples in this chapter). Take a look at the following code:
<script src="https://ajax.googleapis.com/ajax/libs/angularjs/1.2.10/angular.min.js"></script>
<script src="http://d3js.org/d3.v3.min.js" charset="utf-8"></script>
The page then loads the implementations of the AngularJS application object, directive, and controller. Now, execute the following code:
<script src="app.js"></script>
<script src="directives/bars.js"></script>
<script src="controllers/basic_dashboard.js"></script>
The details of these will be examined in a moment. Before we look at these, the remainder of the HTML code in this file creates the AngularJS application and the controller for our directive using a <div> tag with the ng-app and ng-controller properties. Add the following code:
<div ng-app="dashboardApp" ng-controller="dashboardController">
    <bars-view width="500" height="105"></bars-view>
</div>
The use of the ng-app attribute tells AngularJS where to find the implementation, which is a module (that is, a piece of AngularJS JavaScript referable) named dashboardApp.
In this example, this module is declared in app.js (this is the same for each example):
angular.module('dashboardApp', []);This example does not actually declare any code for the application module and is simply a place for the HTML markup to reach into AngularJS and start locating various objects. In a more elaborate application, this would be a good place to inject other dependent modules and do some application-level initialization.
The tag within this <div> tag defines a construct known as an AngularJS directive. This renders the data represented in the controller. Before we get to the implementation of the directive, let's take a look at the controller that provides the data to the directive.
The ng-controller attribute on the <div> tag specifies a name of a controller that is used to provide data to the AngularJS directives that are specified as the child elements of this <div> tag. AngularJS searches for a controller with the specified name within one of the modules specified by ng-app. In this example, this controller is declared in controllers/basic_dashboard.js, as follows:
angular.module('dashboardApp')
    .controller('dashboardController',
        ['$scope', function ($scope) {
            $scope.items = [
                { Name: 'Mike', Value: 49 },
                { Name: 'Marcia', Value: 52 },
                { Name: 'Mikael', Value: 18 }
        ];
    }]);
This creates an AngularJS controller using .controller() with the name dashboardController, which is a part of the application's dashboardApp module. Take a look at the following script:
angular.module('dashboardApp')
       .controller('dashboardController',
                   ['$scope', function ($scope) {
The second parameter of .controller() is an array that specifies the variables to be injected into the method implementing the controller and then the function that implements the controller.
Now, this informs AngularJS that we would like the AngularJS variable $scope, which represents the data of the controller and will be injected into the directives of the control to be passed into this function that is to be initialized.
The last statement in the following command declares the data that is to be provided to the view by adding an item's property to the scope:
$scope.items = [
    { Name: 'Mike', Value: 49 },
    { Name: 'Marcia', Value: 52 },
    { Name: 'Mikael', Value: 18 }
]; An angular directive is a custom HTML tag that instructs AngularJS on how to create HTML based on the data provided by the controller. In the HTML code of the example is a tag declared that is named <bars-view>. When loading the page, AngularJS examines all the tags in HTML, and if a tag is not recognized as a standard HTML tag, AngularJS searches for a directive that you declared as part of the application to provide an implementation for this tag.
In this case, it converts the hyphenated name of the tag, <bars-view>, to a camel case version, barsView, and looks for a directive within a module that was declared with this name. If found, AngularJS executes the code that is provided for the directive to generate the HTML code.
In this example, AngularJS finds the <bars-view> tag implemented in the directives/bars.js file. This file starts by informing AngularJS that we want to declare a directive named barsView in the dashboardApp module:
angular.module('dashboardApp')
    .directive('barsView', function () {
        return {
            restrict: 'E',
            scope: { data: '=' },
            link: renderView
        };
The second parameter to .directive() is a function that informs AngularJS how to apply and construct the view. In this example, there are three instructions specified:
restrict: 'E': This informs AngularJS that this directive applies to HTML elements only and not to their attributes or CSS class names.scope: { data: "="}: This tells AngularJS that we want to have two-way binding between the data in the scope and the elements in the view. If data changes in the controller, AngularJS will update the view and vice versa.link: renderView: This property informs AngularJS which function will be called when the view is created. This function will then generate DOM constructs to represent the view. This is where we will put our D3.js code.
The renderView function is declared as follows:
function renderView($scope, $elements, $attrs) {When AngularJS calls this function to render a tag for a directive, it passes the scope object represented by the related controller as the $scope parameter. The second parameter, $elements, is passed an AngularJS object that can be used to identify the top-level DOM element where the directive should append new elements. The last parameter, $attrs, is passed any custom attribute defined in the root DOM element in the prior parameter.
The code to implement the bar graph is not significantly different from our earlier bar graph examples. The first thing it does that is different because of AngularJS gets the data from the scope that was passed into the function, as follows:
var data = $scope.$parent.items;
The <bars-view> directive is assigned a scope object by AngularJS. The data from the controller is actually a property of the parent scope property of this object. This object has the items property that we defined in the controller and its associated data as the items property.
The width and height of the element, as specified in the HTML code, can be retrieved using the width and height attributes of the $attrs parameter. Take a look at the following command:
var width = $attrs.width, height = $attrs.height;
After obtaining the width and height, we can create the main SVG element of the graph. This will be appended to $element[0], which represents the root DOM element for this directive (The $element object is actually an AngularJS one wrapping the root element, which is access using the [0] indexer), as follows:
var svg = d3.select($element[0])
    .append("svg");
The remainder of the code is similar to the examples covered in previous chapters to create a bar graph with overlaid text. It begins by setting the size of the SVG element and setting up various variables required to calculate the size and positions of the bars, as shown in the following code:
svg.attr({
    width: width,
    height: height
});

var max = d3.max(data, function(d) {
    return d.Value;
});

var colors = d3.scale.category20();

var barHeight = 30;
var leftMargin = 15;
var barTextOffsetY = 22;
The bars are then created and set to animate to their maximum respective sizes. Take a look at the following:
svg.selectAll('rect')
    .data(data)
    .enter()
    .append('rect')
    .attr({
        height: barHeight,
        width: 0,
        x: 0,
        y: function(d, i) {
            return i * barHeight;
        },
        stroke: 'white'
    })
    .style('fill', function(d, i) {
        return colors(i);
    })
    .transition()
    .duration(1000)
    .attr('width', function(d) {
        return d.Value / (max / width);
    });
Now, all the existing D3.js elements are selected in an update scenario, which transitions the size of any existing bar to the new size. Take a look at this code:
svg.selectAll("rect")
    .data(data)
    .transition()
    .duration(1000)
    .attr("width", function(d, i) {
        return d.Value / (max / width);
    });
Then, the cases to create both the entering labels on the bars and change the text on the bars if the data values change are implemented, as follows:
svg.selectAll('text')
.data(data)
.enter()
.append('text')
.attr({
fill: '#fff',
x: leftMargin,
y: function(d, i) {
return i * barHeight + barTextOffsetY;
}
})
.text(function(d) {
return d.Name + ' (' + d.Value + ')';
});
svg.selectAll('text')
.data(data)
.attr({
fill: '#fff',
x: leftMargin,
y: function(d, i) {
return i * barHeight + barTextOffsetY;
}
})
.text(function(d) {
return d.Name + ' (' + d.Value + ')';
});
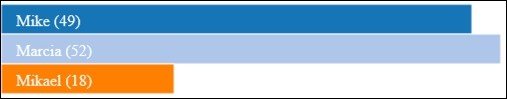
}When opening this page in the browser, the following graph is presented: