
The final topic in this book will demonstrate using multiple D3.js visuals on a single web page. These examples will also demonstrate constructing D3.js visuals in a modular manner, which allows their reuse through simple HTML tags, and at the same time abstracting the data from the code that renders the visual. This will enable the creation of more generic D3.js visuals, which can be placed on a page using a single HTML tag and are also loosely coupled with the source of the data.
To implement these features, we will utilize AngularJS, a JavaScript framework used to create dynamic and modular web applications. The examples will demonstrate how to integrate both AngularJS (v1.4) and D3.js to make reusable and interoperable visualizations. An introductory knowledge of AngularJS is expected for this chapter, but the focus will be on how to use the features of AngularJS to create reusable and extensible D3.js controls; therefore, even someone new to AngularJS will be able to follow along.
In this chapter, we will accomplish this by going through the following topics:
- An overview of composite visualization
- Creating a bar chart using an AngularJS application, controller, and directive
- Adding a second directive to add a donut graph to the page
- Adding a detail view and interactivity between the visuals
- Updating the graphs upon modification of details in the data
Before jumping into the examples, let's start by examining the end result to help conceptualize several of the goals that we will attempt to accomplish using AngularJS combined with D3.js. The following figure represents a static image of the resulting interactive and composite graphs:
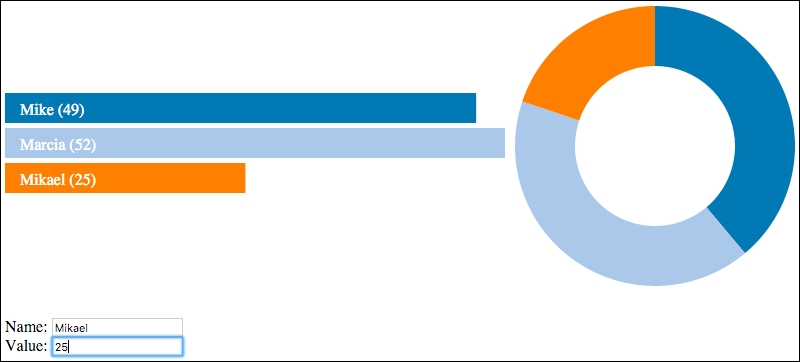
Each component of the page—the bar graph, the donut graph, and the input form—will initially be built independently and will be able to function on its own. To do this, the examples will use features from AngularJS to facilitate the following features:
- Each visual should be expressed in HTML as a simple HTML tag instead of copying the code for each onto the page. This is performed using AngularJS directives.
- Instead of loading the data once within the code for each visual, we will leverage a common application-level data model shared across each element. In AngularJS, this is done by creating a JavaScript data model and injecting it into the controllers for each directive.
- The bar graph will provide a means of exposing notifications of updates to a currently selected item, upon which the detail model can update its data. This will be implemented through a
selectedItemproperty in the model that the details directive can monitor for updates using AngularJS template bindings. - Also, when the application model is updated in the details directive, the bar and donut graphs will be notified by AngularJS to be updated to represent the modifications.
Note
A note of difference in this chapter from the previous is that the code is not available online on bl.ock.org or JSBIN.COM and must be retrieved from the Packt website. This is because the examples utilize AngularJS, which doesn't play as well with bl.ock.org and JSBIN.COM. The code must therefore be run locally from a web server. You can simply unzip the code and place it in the root of a web server or start a web server of your choice in the root folder of the content. Each example is implemented as a different HTML file in the root of the folder, and each of these refers to multiple other files in various subdirectories.