
Chapter 3
Defect Structure in Bulk Nanomaterials Processed by Severe Plastic Deformation
Abstract
Contamination- and porosity-free bulk nanostructured materials can be processed from coarse-grained workpieces by severe plastic deformation (SPD). During SPD procedures the grain refinement is usually associated with the formation of large amount of lattice defect, such as grain boundaries, dislocations, and vacancies. In this chapter, the evolution of defect structure during SPD processing is reviewed. At high imposed strain in SPD processing, the grain and crystallite sizes reach their minimum values and the dislocation density gets saturated. Although there is no strict correlation between the grain or crystallite size and the dislocation density, the higher dislocation density is usually associated with smaller grain and crystallite sizes. The saturation values of the dislocation density and the grain size are strongly influenced by (1) the homologous temperature, the pressure, and the strain rate applied in SPD, (2) the solid solution alloying, (3) the second phase particles, and (4) the degree of dislocation dissociation [i.e., the stacking fault energy (SFE)]. The vacancy concentration in metals processed by SPD at room temperature is as high as the equilibrium value at the melting point (10−4 to 10−3) and the majority of vacancies are clustered. The high pressure applied during SPD has a strong influence on the defect structure but this effect depends on the SFE of the processed material. The lattice defects formed during SPD (e.g., dislocations) facilitate precipitation, thereby influencing the phase composition of the as-processed ultrafine-grained alloys. In addition, due to the Gibbs–Thomson effect the volume fraction of secondary phase nanoparticles is influenced by the energy of interfaces and the size of particles.
Keywords
Dislocation density; Excess vacancies; Gibbs–Thomson effect; Grain refinement; Interface energy; Precipitation; Severe plastic deformation
3.1. Evolution of Dislocation Structure and Grain Size During Severe Plastic Deformation Processing
Severe plastic deformation (SPD) techniques are effective methods for producing bulk, porosity- and contamination-free ultrafine-grained (UFG), or nanostructured materials [1,2]. The high pressure applied during these procedures promotes the evolution of a high dislocation density in two ways (1) by impeding the vacancy migration that hinders the annihilation of dislocations and (2) by suppressing the cracking thereby keeping the integrity of the workpiece even at high strains. The most frequently used SPD procedure is equal channel angular pressing (ECAP) that enables the elaboration of bulk UFG or nanomaterials with dimensions of several centimeters in all directions that is favorable in practical applications [1]. One pass of ECAP corresponds to an equivalent strain value of about 1. The imposed strain increases proportionally by the increase of the number of passes. The evolution of the dislocation density and the crystallite size determined by X-ray line profile analysis as a function of number of ECAP passes is illustrated in Fig. 3.1 for 99.98% purity Cu [3,4], but the tendencies are similar for other metals. The dislocation density increases while the crystallite size decreases with increasing strain in ECAP up to three passes in Fig. 3.1. The values obtained after three passes can be regarded as the saturation values achievable by ECAP in pure Cu at room temperature (RT). The saturation of the dislocation density is a consequence of the dynamic equilibrium of the formation and annihilation of dislocations. The maximum dislocation density is reached usually after two to four passes of ECAP for the majority of metallic materials [4–11].

Figure 3.1 The dislocation density and the crystallite size as a function of the number of equal channel angular pressing (ECAP) passes for 99.98% purity Cu. Reprinted from J. Gubicza, N.Q. Chinh, J.L. Lábár, S. Dobatkin, Z. Hegedűs, T.G. Langdon, Correlation between microstructure and mechanical properties of severely deformed metals, Journal of Alloys and Compounds 483 (2009) 271–274 with permission from Elsevier.
The grain size determined by transmission electron microscopy (TEM) has similar evolution as for the crystallite size. The minimum grain size in pure Cu processed by ECAP at RT is about 200 nm [7,12]. It is noted that the crystallite size measured by X-ray line profile analysis is usually smaller than the grain size obtained by TEM. This phenomenon can be attributed to the fact that the crystallites are the domains in the microstructure which scatter X-rays coherently. As the coherency of X-rays breaks even if they are scattered from volumes having quite small misorientations (1°–2°), the crystallite size corresponds rather to the subgrain size in the severely deformed microstructures [13]. The reduction in the subgrain and grain sizes with increasing imposed strain is attributed to the increase of dislocation density as the grain refinement during SPD usually starts by the arrangement of dislocations into low-energy configurations such as low-angle grain boundaries (the misorientation is smaller than 3° per definition). The clustering of dislocations minimizes the energy stored in the dislocation structure as the strain field of dislocations is screened by other dislocations. The clustering of dislocations was observed directly in TEM images [14,15] and also detected by X-ray line profile analysis [16]. As an example Fig. 3.2 shows a subgrain with a size of about 250 nm in a 99.99% purity Cu sample processed by 14 cycles of repetitive corrugation and straightening (RCS) [14]. The black arrowhead at the left side of the subgrain in Fig. 3.2a points to a boundary segment whose Fourier-filtered high-resolution transmission electron microscopy (HRTEM) image is presented in Fig. 3.2b. The inset in Fig. 3.2a is an HRTEM image from the subgrain showing that the subgrain boundaries are almost parallel to two sets of {111} planes. The average distance between dislocations in the boundary is about 2 nm as estimated from Fig. 3.2b that yields a local dislocation density of about 3 × 10¹⁷ m−2 (the average distance between dislocations can be approximated as the inverse square root of dislocation density). This local dislocation density value is about two orders of magnitude higher than the average dislocation density in the whole sample. In addition to dislocations, other lattice defects such as interstitial and vacancy loops are also observed in the boundary (see Fig. 3.2b).

Figure 3.2 (a) A transmission electron microscopy micrograph of a subgrain in 99.99% purity Cu processed by repetitive corrugation and straightening. The inset in (a) is a high-resolution transmission electron microscopy (HRTEM) image showing that the subgrain boundaries are almost parallel to two sets of {111} planes. (b) A Fourier-filtered HRTEM image from the boundary as pointed out by a black arrowhead in (a). The white arrow in (b) points out the grain boundary (GB) orientation. The black and white circles mark interstitial and vacancy loops, respectively. Reprinted from J.Y. Huang, Y.T. Zhu, H. Jiang, T.C. Lowe, Microstructures and dislocation configurations in nanostructured Cu processed by repetitive corrugation and straightening, Acta Materialia 49 (2001) 1497–1505 with permission from Elsevier.
X-ray line profile analysis also enables the investigation of dislocation clustering as this method gives a dimensionless dislocation arrangement parameter, M, that is defined as the product of the outer cutoff radius of dislocations and the square root of the dislocation density. Practically, in this quantity the outer cutoff radius of dislocations is normalized by the average dislocation distance that can be expressed as the inverse of the square root of total dislocation density. The value of M usually decreases with increasing number of ECAP passes [16], which indicates a stronger screening of the strain field of dislocations due to their arrangement into low-energy configurations such as dipolar walls or low-angle grain boundaries.
The lattice misorientation across a grain boundary is accommodated by geometrically necessary dislocations. SPD processing results in nonequilibrium grain boundaries that contain high density of extrinsic dislocations in addition to geometrically necessary dislocations. As an example, Fig. 3.3a shows a boundary in a 99.99% purity Cu sample processed by 14 cycles of RCS [14]. The grain boundary plane is curved and changes from the (5 5 12) plane to the (002) plane. The misorientation between the adjacent grains is about 9° as it is revealed by the corresponding electron diffraction pattern in Fig. 3.3b. HRTEM images from the upper-left and lower-right part of the boundary (see the framed areas in Fig. 3.3a) are shown in Fig. 3.3c and d, respectively. Fig. 3.3d is a structural model of the boundary segment in Fig. 3.3c. From this model, it can be seen that two types of dislocations marked by black and white symbols are needed to accommodate the geometrical misorientation. These six dislocations are referred to as geometrically necessary or intrinsic dislocations. However, there are three other dislocations in Fig. 3.3c which are extrinsic (or nongeometrically necessary) dislocations. Therefore, this segment of grain boundary is in nonequilibrium state. At the same time, the segment in Fig. 3.3e contains only geometrically necessary dislocations therefore that is an equilibrium grain boundary. Large density of extrinsic dislocations in grain boundaries was also observed for hexagonal metals processed by SPD [15].

Figure 3.3 (a) A boundary in a 99.99% purity Cu sample processed by 14 cycles of repetitive corrugation and straightening. The grain boundary plane is curved and changes from the (5 5 12) plane to the (002) plane. (b) The corresponding electron diffraction pattern. (c) and (e) high-resolution transmission electron microscopy images from the upper-left and lower-right part of the boundary in (a) (see the framed areas). (d) A structural model of the boundary segment in (c). The two types of dislocations in the boundary are marked by black and white symbols. Reprinted from J.Y. Huang, Y.T. Zhu, H. Jiang, T.C. Lowe, Microstructures and dislocation configurations in nanostructured Cu processed by repetitive corrugation and straightening, Acta Materialia 49 (2001) 1497–1505 with permission from Elsevier.
With increasing strain in SPD processing, the dislocation density in the newly formed subgrain or grain boundaries increases, thereby enhancing the angle of misorientation that can be approximated as the ratio of the magnitude of Burgers vector and the spacing between geometrically necessary dislocations in low-angle grain boundaries. Electron backscatter diffraction experiments revealed that the fraction of high-angle grain boundaries (the misorientation is larger than 15° per definition) monotonously increased with increasing number of ECAP passes even after the achievement of the minimum grain size (about 200 nm for pure Cu) [12]. At very large equivalent strain values (ε ≈ 10–30) of SPD processing, the fraction of high-angle grain boundaries in various metals (e.g., Cu, Al, Ni, steel) increased up to 70%–90% [12,17–19]. According to the model of grain refinement, nonequilibrium grain boundaries evolve from dislocation cell boundaries and/or low-angle grain boundaries by absorbing dislocations gliding in the lattice during SPD processing. The grain boundary misorientation increases with increasing dislocation density in grain boundary, similar to the Read–Shockley model of low-angle grain boundaries. At the same time, contrary to low-angle grain boundaries, dislocations in high-angle grain boundaries are stored in nonperiodic, disordered arrays, and the nonequilibrium nature of the boundary can be characterized by the excess free volume and/or energy. The values of these parameters increase with increasing the density of extrinsic dislocations.
Fig. 3.1 shows that between the 3rd and 10th passes of ECAP, the dislocation density and the crystallite size for Cu remains unchanged within the experimental error. At the same time, during ECAP processing between the 10th and 15th passes the dislocation density decreases and after 25 passes even the crystallite size increases. These changes can be attributed to the structural relaxation of grain/subgrain boundaries. The equilibrium state can be approached by the annihilation of extrinsic dislocations. The decrease of the dislocation density after 15 passes can be explained by this annihilation of extrinsic dislocations. This structural recovery at large strain is accompanied by a decrease in the grain boundary thickness corresponding to an evolution from nonequilibrium boundaries to a more equilibrated structure and by an increase in the misorientation between neighboring grains. This is illustrated in Fig. 3.4 where the TEM images taken on the microstructures processed by the 5th and 25th passes are presented [3,12]. It is noted that the decrease of the dislocation density in SPD processing can be also observed for other materials (e.g., in Al [6] or Ag [10]) if the imposed strain is high enough and the applied hydrostatic component of the stress field does not suppress recovery processes.
The grain refinement in metallic materials processed by SPD at high homologous temperatures (0.3–0.4 × Tm or above where Tm is the absolute melting point) may occur by continuous dynamic recrystallization (CDRX) [20]. In CDRX process, new fine grains with HAGBs nucleate homogeneously during SPD as a consequence of the large stored energy. This primary recrystallization may contribute to grain refinement in Mg and Al even at RT due to their low melting points [21]. A secondary recrystallization process should be avoided to maintain the fine grain structure.

Figure 3.4 Transmission electron microscopy images of the microstructure of Cu processed by equal channel angular pressing for the 5th (a) and 25th (b) passes. Reprinted from S.V. Dobatkin, J.A. Szpunar, A.P. Zhilyaev, J-Y. Cho, A.A. Kuznetsov, Effect of the route and strain of equal-channel angular pressing on structure and properties of oxygen-free copper, Materials Science and Engineering A 462 (2007) 132–138 with permission from Elsevier.
Beside the density and the arrangement of dislocations, X-ray diffraction line profile analysis also enables the determination of the type of the prevailing dislocations in nanomaterials [22]. In the case of cubic crystal systems, the edge/screw character of dislocations can be determined. It was found that for face-centered cubic (fcc) metals having high stacking fault energies (SFEs), e.g., for Al and its alloys, the character of dislocation structure is rather edge type after RT SPD processing [23]. Due to the high SFE, the dissociation of screw dislocations is marginal that gives a relatively easy annihilation by cross-slip compared to climb of edge dislocation segments. With decreasing SFE, the splitting distance between partials in dissociated dislocations increases that retards both cross-slip and climb [24,25]. As cross-slip is more sensitive to the degree of dislocation dissociation than climb [10], the decrease of SFE leads to a gradual enhancement of the screw character of dislocation structure. In the case of body-centered cubic (bcc) metals, e.g., interstitial-free (IF) steel processed by ECAP at RT, the character of dislocations is more screw [11], which can be explained by the reduced mobility of screw dislocations compared to edge dislocations in bcc structures. This difficulty in motion of screw dislocations is due to the fact that the ground state dislocation core is dissociated into a nonplanar configuration [26]. As a consequence, during ECAP processing the edge dislocation segments can annihilate more easily than the screw ones thereby the remaining dislocations have more screw character.
In the case of hexagonal close-packed (hcp) materials, X-ray line profile analysis provides the relative fractions of dislocations having  ,
,  , and
, and  Burgers vectors [27,28]. Generally, SPD processing of hexagonal materials is carried out at high homologous temperatures (at about 0.4 × Tm) due to their rigidity. However, high-pressure torsion (HPT) processing can be carried out on hcp materials even at RT without an early failure of the samples, as the high pressure applied in HPT suppresses crack propagation. There is an abundance of -type dislocations (usually with 60%–70%) in all hexagonal UFG or nanomaterials (e.g., sintered WC [29,30], SPD-processed Ti [15,31], and Mg alloys [32]) that can be explained by their smallest Burgers vector compared to other types of dislocations. The amount of -type dislocations is usually negligible; however, a significant fraction (30%–40%) of dislocations is detected. The relatively high fraction of dislocations in these materials can be attributed to the elevated temperature of SPD processing and/or the high stresses developed at grain boundaries which facilitates the activation of dislocations [33]. At RT, the critical resolved shear stress of pyramidal dislocations is about five times larger than that for basal slip [34], but this value decreases with increasing temperature.
The evaluation of X-ray diffraction profiles also enables the determination of the population of the individual slip systems (e.g., basal, prismatic, or pyramidal systems) in UFG or nanocrystalline hcp materials [28]. As an example, Fig. 3.5 describes the evolution of the dislocation structure as a function of HPT revolutions in the center of an AZ31 alloy (Mg–3% Al–1% Zn) disk [35]. The HPT processing was carried on a well-annealed material at RT under the pressure of 2.5 GPa and the zero turn corresponds to a compression in the HPT device without torsional deformation. The parameters of the dislocation structure saturate even after ¼ HPT turn, and significant changes were not observed with increasing deformation up to 15 revolutions. The maximum dislocation density is about 7 × 10¹⁴ m−2. The analysis of the population of the different slip systems shows that the majority of dislocations have -type Burgers vector (60%–80%) for the compressed sample (zero turn) and also in the HPT-processed specimens. Fig. 3.5b shows that among -type edge slip systems the fraction of nonbasal dislocations (the sum of the prismatic and pyramidal edge dislocations) decreases from about 55% to 30%, while the population of basal edge dislocations slightly increases from 15% to 20%. A similar evolution of the dislocation fractions occurred in the periphery of the disks. This change in the dislocation population can be explained by the fact that in Mg, which has larger c/a lattice parameter ratio than 1.6, the slip occurs most easily in basal plane at low temperatures [36]. Fig. 3.5c reveals that the relative fraction of screw dislocations increases from ∼10% (only compressed state) to 30%–40% owing to HPT straining. It should be noted that the fraction of screw dislocations saturates already at ¼ turn and significant difference between the values in the center and the periphery was not observed, in accordance with the evolution of other parameters of the dislocation structure. It is noted that the fraction of screw dislocations during ECAP processing was even larger (50%–70%) than in the case of HPT, since the high pressure in the latter procedure hinders the lattice diffusion, thereby impeding the annihilation of edge dislocations [37].

Figure 3.5 The variation of (a) dislocation density, (b) fractions of -type basal and nonbasal edge dislocations, and (c) screw dislocations in the center of an AZ31 disk as a function of high-pressure torsion (HPT) revolutions [35].
The grain refinement in hcp metals during SPD processing has different features than in fcc materials. For instance, there is an evidence in different Mg alloys (e.g., AZ31 and ZK60) that above a critical initial coarse grain size, the grain refinement starts with the development of an inhomogeneous grain structure [38–40]. The new grains form along the boundaries of the initial coarse grains in a necklace-like arrangement as depicted in Fig. 3.6. As a consequence, if the initial grain size is large enough, the fine grains at the grain boundaries and the internal volumes of the initial coarse grains give a bimodal grain structure in the beginning of SPD processing. With increasing strain, the grain refinement spreads into the initial grain interiors, thereby leading to a more homogeneous fine grain structure. In hcp metals and alloys, dislocation mechanism of grain refinement requires the activation of both nonbasal and basal slips [41]. As dislocations on the basal plane have the smallest -type Burgers vector, their activation is easy by the external stresses. The glide on nonbasal slip systems is more difficult, and the activation of these dislocations is facilitated by the high stresses and/or the elevated temperature. Therefore, the stress concentrations at the boundaries of the initial grains yield the activation of both basal and nonbasal slip processes leading to the formation of fine grains at the preexisting grain boundaries [42]. If the grain size is smaller than a critical value, the formation of fine grains at the initial grain boundaries does not cause a bimodal grain structure. This critical grain size is between 3 and 9 μm for AZ31 alloy processed by ECAP at RT [40]. In this alloy, the bimodal grain size distribution developed during the first pass disappears after six passes. However, the critical grain size depends not only on the selected alloy but also on the SPD conditions. For instance, the critical grain size becomes larger, when the temperature of ECAP increases as the higher temperature facilitates the activity of nonbasal slip systems.

3.2. Comparison of Defect Structures Formed by Different Routes of Bulk Severe Plastic Deformation
The effect of SPD processing method on grain size and the dislocation structure is illustrated on 99.98% purity Cu [43]. The TEM images of the microstructures of Cu samples produced by 20 cycles of multidirectional forging (MDF), 15 passes of twist extrusion (TE), 25 passes of ECAP, and 25 revolutions of HPT (at the half radius) are shown in Fig. 3.7. In the TEM images the majority of grains are equiaxed, only a few slightly elongated grains can be observed. The average grain size determined by TEM is 220 ± 5 nm for all Cu samples except the HPT-processed material that has a smaller grain size of 160 nm. According to the literature data, these values are around the minimum grain size that can be achieved in bulk pure Cu by SPD at RT. The crystallite size, the dislocation density, and the twin boundary frequency were determined by X-ray line profile analysis. The dislocation density increases in the order of MDF (7 × 10¹⁴ m−2), TE (10 × 1014 m−2), ECAP (15 × 1014 m−2), and HPT (37 × 1014 m−2) [43]. The higher the dislocation density, the smaller the crystallite size for the four studied samples: 142, 107, 101, and 75 nm for MDF-, TE-, ECAP-, and HPT-processed samples, respectively [43]. The twin boundary frequency for all samples was relatively low (0.1 ± 0.1%), close to the detection limit of this quantity for the applied experimental setup of X-ray line profile analysis. The extremely high dislocation density after HPT is in good agreement with the values obtained by other authors [44].
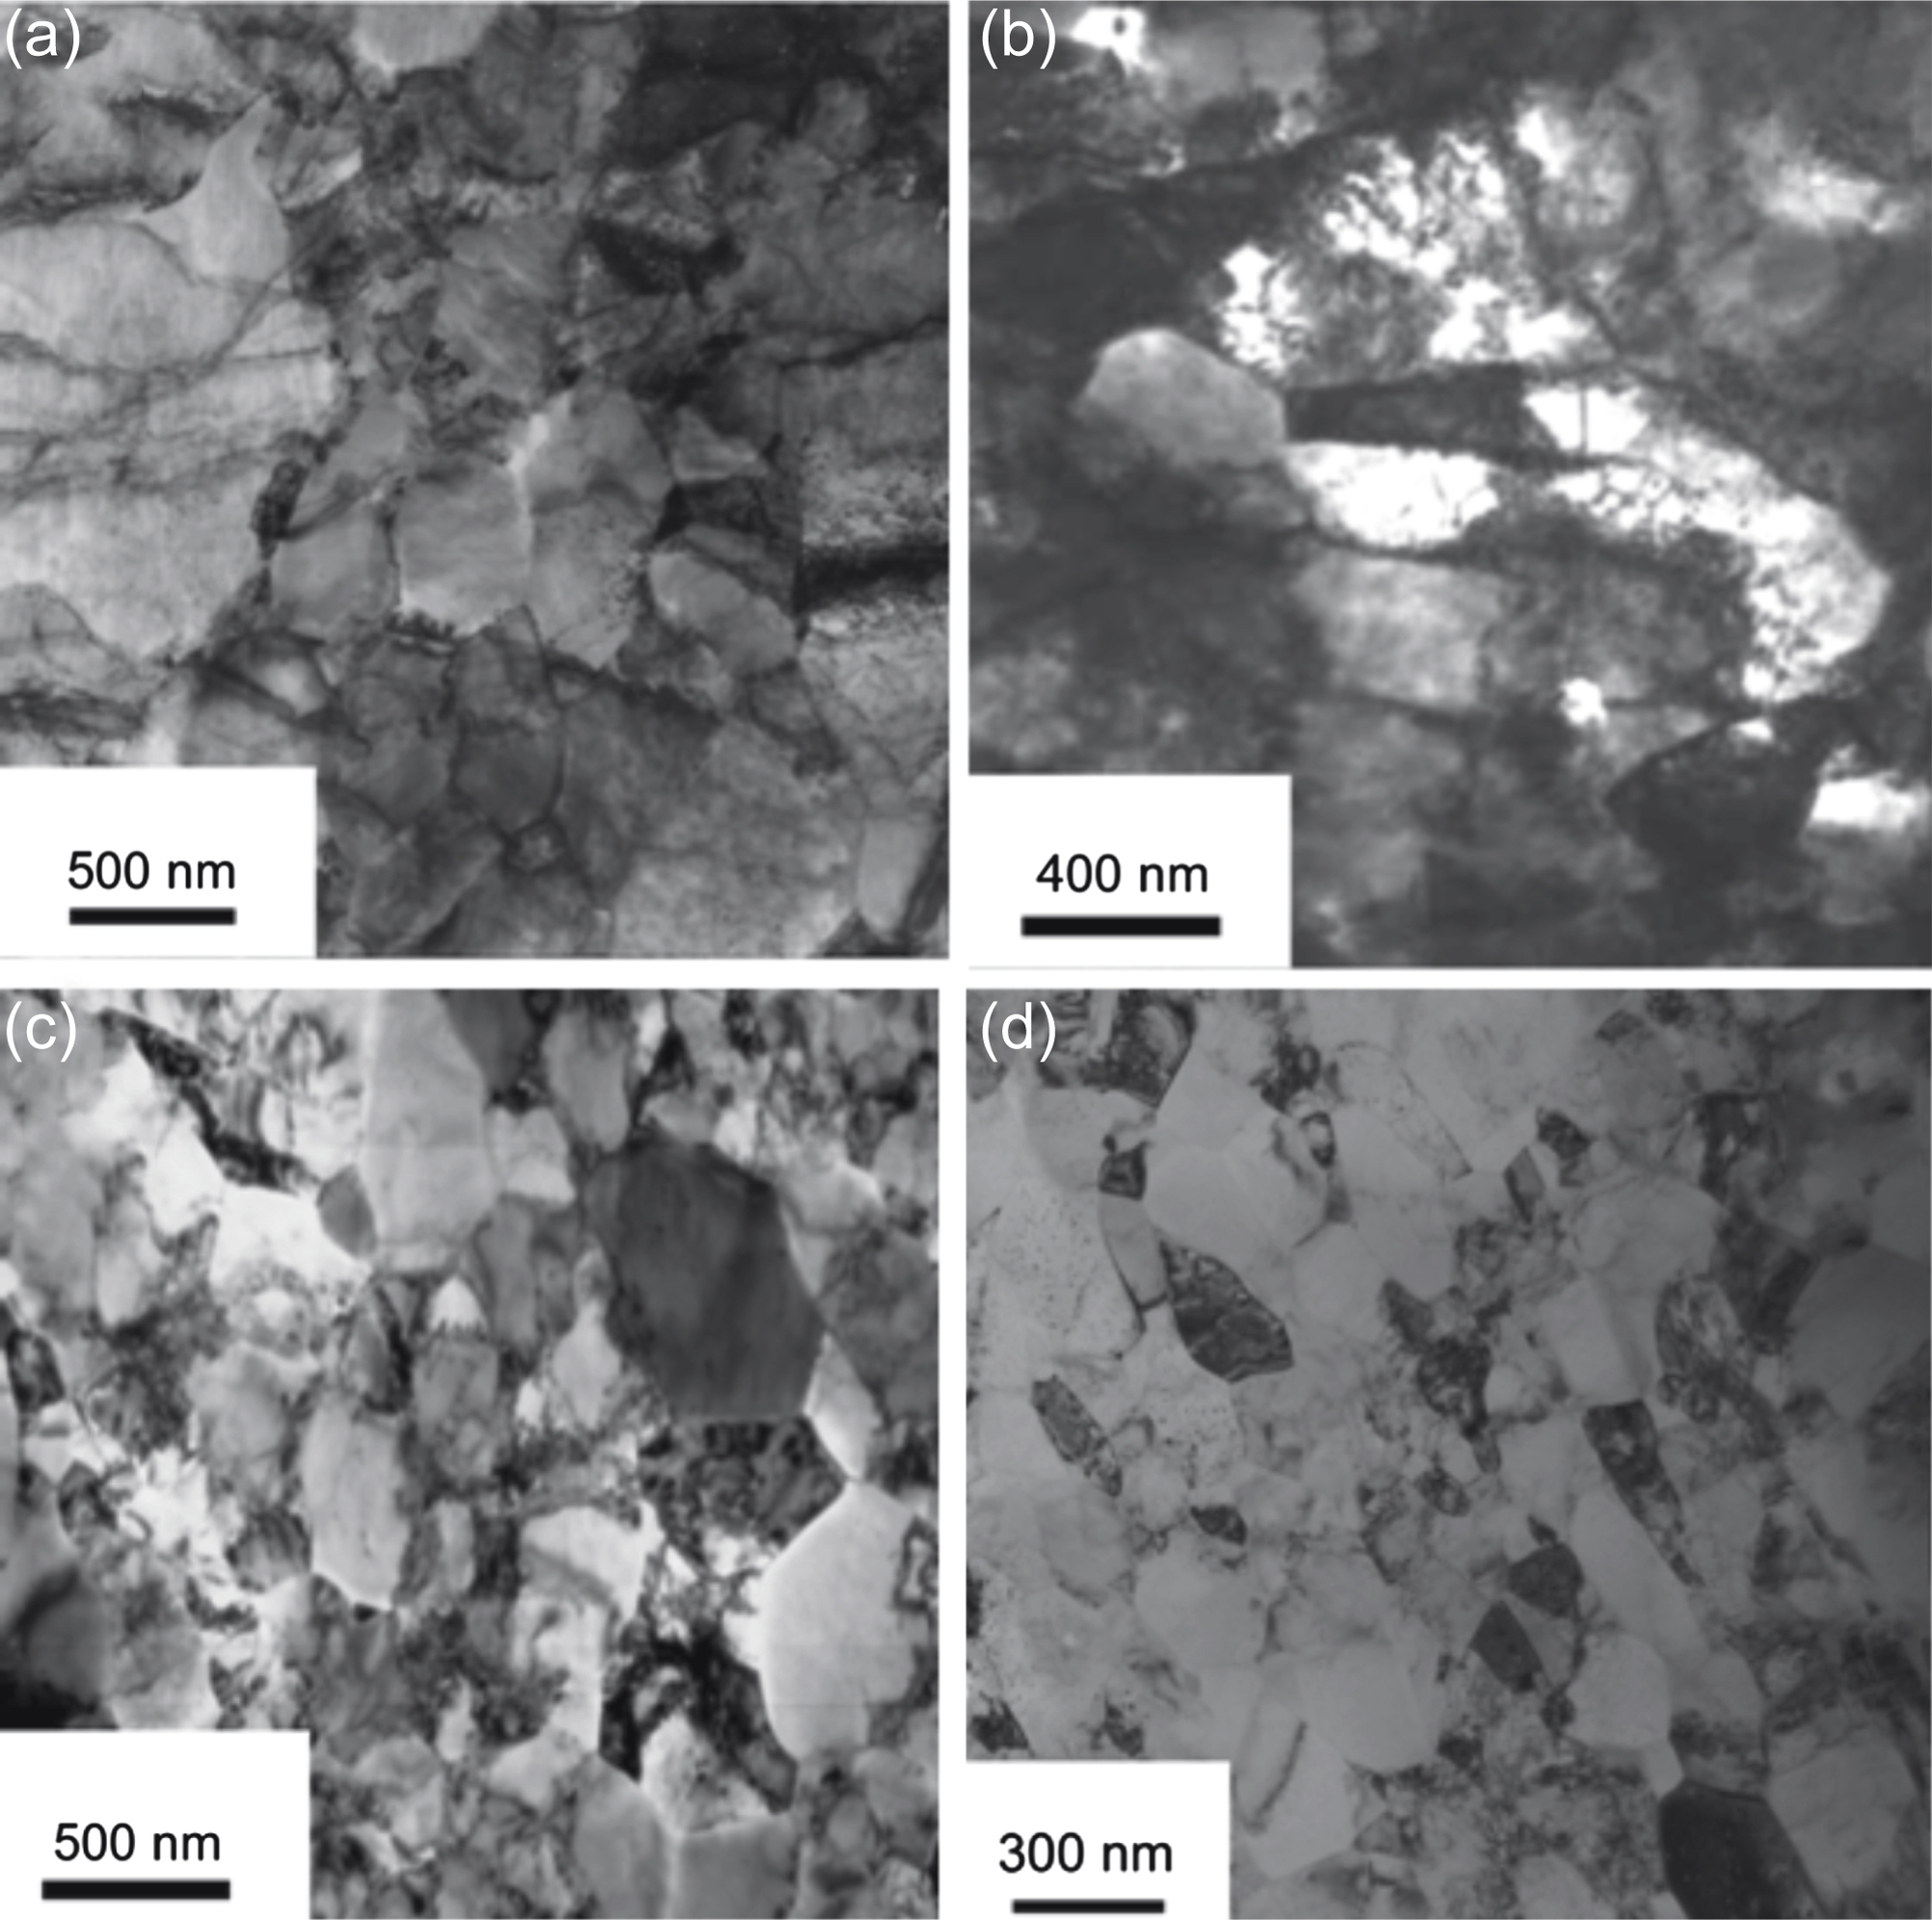
Figure 3.7 Transmission electron microscopy images showing the microstructure of Cu specimens immediately after 20 cycles of multidirectional forging (a), 15 passes of twist extrusion (b), 25 passes of equal channel angular pressing (c) and 25 revolutions of high-pressure torsion (d). Reprinted from J. Gubicza, S.V. Dobatkin, E. Khosravi, A.A. Kuznetsov, J.L. Lábár, Microstructural stability of Cu processed by different routes of severe plastic deformation, Materials Science and Engineering A 528 (2011) 1828–1832 with permission from Elsevier.
The very high dislocation density after HPT can be attributed to the high pressure (p = 4 GPa) applied during HPT as it hinders annihilation of dislocations by retarding climb and cross-slip in the following ways:
1. The climb velocity is proportional to the diffusion coefficient [25] that depends on the concentration and the migration enthalpy of vacancies. Previous experiments have shown that in SPD-processed metals a large amount of vacancies are formed due to forced plasticity, therefore their concentration is much higher than the equilibrium value [8,45–50]. When a high pressure is applied in SPD processing, larger work (by pVVF where VVF is the vacancy formation volume) is needed for vacancy formation but this does not reduce the vacancy concentration as the necessary extra work is supplied by the external forces. Rather an increased vacancy concentration was observed in previous studies [45–48] with increasing the pressure of HPT that can be explained by the suppressed vacancy annihilation at dislocations due to the slower migration of vacancies. The reduction in vacancy migration rate at high pressure is caused by the increase of the migration enthalpy by pVVM, where VVM is the vacancy migration volume. The increased difficulty of vacancy migration due to the high pressure applied during HPT hinders effectively the annihilation of dislocations by climb compared to other SPD processing.
2. In fcc metals the larger the splitting distance between partials in dissociated dislocations, the more difficult the climb or cross-slip of edge or screw segments of dislocations, respectively [24,25]. The values of equilibrium splitting distance between partials for edge and screw dislocations in Cu are 2.3 and 0.9 nm, respectively [10]. The very large loading on the anvils during HPT most probably results not only in a high hydrostatic pressure but also in high shear stresses since the idealized constrained conditions are usually not achieved. The shear stresses acting on the slip plane of a dislocation perpendicular to the Burgers vector can decrease or increase the splitting distance by pushing the partials toward each other or pulling the partials in opposite directions, respectively, depending on the stress orientation (see Fig. 4.2 in Chapter 4). Therefore, the higher shear stresses during HPT may result in much larger or smaller splitting distance depending on their directions. As the splitting distance without stresses is not very large in Cu due to the medium value of SFE (data between 45 and 78 mJ/m2 are reported in the literature [51,52]), the stresses pushing the partials toward each other do not accelerate climb and cross-slip very much. At the same time, the high stresses resulting in much larger splitting distance slow down climb and cross-slip effectively. As a result of the effects (1) and (2), both climb and cross-slip of dislocations are retarded due to the high load applied during HPT that explains the extremely large dislocation density measured immediately after HPT processing. This argumentation is also supported by the increase of dislocation density with increasing pressure applied during HPT (e.g., Refs. [45,50]).
Fig. 3.8a and b compare the maximum dislocation density and the minimum grain size, respectively, achievable by ECAP and HPT at RT for 2N5 purity Al, Al–1% Mg alloy, IF steel, oxygen-free (99.98% purity) Cu, and 4N purity Ag. The data are taken from Refs. [6,10,11,43,53,54]. For Cu and Ag, the maximum dislocation density after HPT is much larger than after ECAP, while for the other three materials the saturation dislocation densities after ECAP and HPT are practically the same. Most probably, in the latter materials the dislocation density was also higher under the large pressure applied during HPT than in ECAP processing; however, when the pressure was released a large fraction of dislocations annihilated due to the accelerated diffusion, as shown in Ref. [44]. In the case of Cu and Ag, the relatively low SFE (compared to other materials in Fig. 3.8) retarded this annihilation process, as discussed in the previous paragraphs, hereby resulting in a higher dislocation density after HPT than that obtained in ECAP processing. The low SFE also hindered the arrangement of excess dislocations into grain boundaries in Cu and Ag during HPT, therefore the minimum grain size values are similar after processing by the two different SPD methods. At the same time, in Al, Al–Mg alloy, and IF steel the increased dislocation density during HPT processing yielded a smaller grain size as a part of excess dislocations were arranged into grain boundaries.
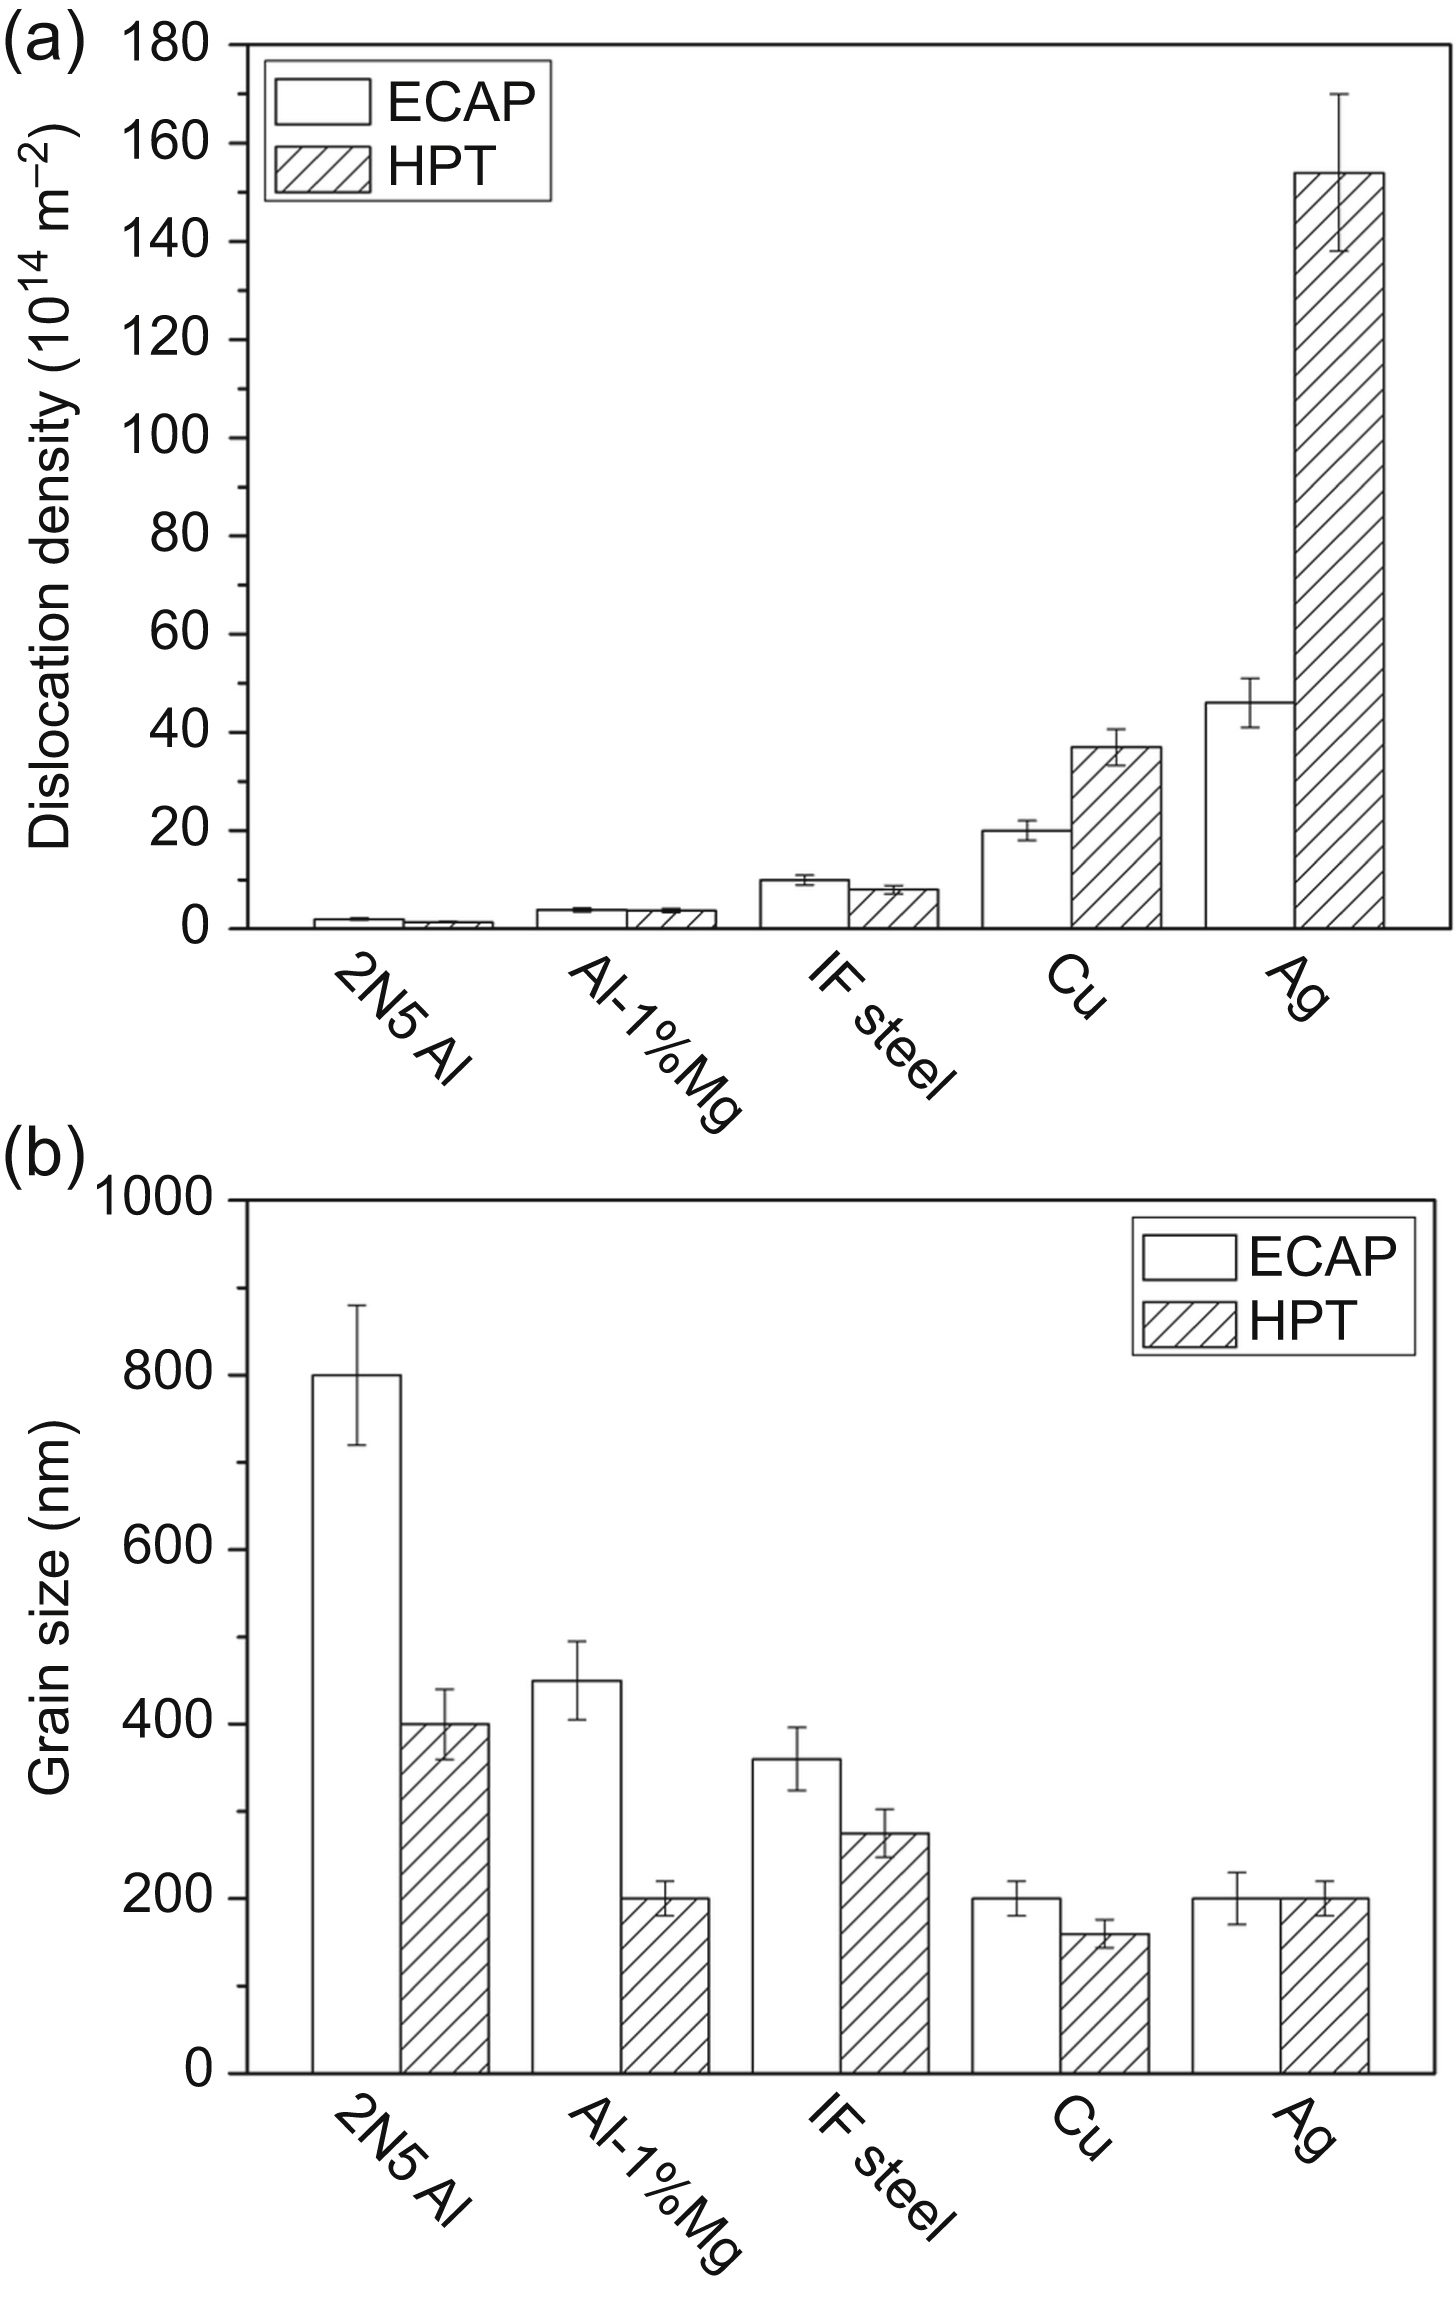
Figure 3.8 Comparison of dislocation densities (a) and grain sizes (b) in different materials processed by equal channel angular pressing (ECAP) or high-pressure torsion (HPT) [55]. IF, interstitial free.
The grain boundary character depends on both the imposed strain and the route of SPD processing. The evolution of a reasonably equiaxed UFG microstructure with large fraction of high-angle grain boundaries is usually most rapid for route BC among the different routes of ECAP [56,57]; however, the difference in the grain boundary misorientation distribution produced by the various ECAP routes decreases with increasing number of passes [12]. At very high imposed strains (ε ≈ 10–40), the high-angle grain boundary fraction is the largest in the materials processed by ECAP and HPT compared to other SPD methods [12,17].
3.3. Maximum Dislocation Density and Minimum Grain Size Achievable by Severe Plastic Deformation of Bulk Metallic Materials
At high imposed strain in SPD processing, the grain size and the crystallite size (subgrain size) reach their minimum values and the dislocation density gets saturated. The saturation dislocation density, crystallite, and grain sizes for different SPD-processed metals are listed in Table 3.1. In the case of HPT-processed materials, the data measured at the half radius of the disks are selected as characteristic values. For Cu–10% Zn and Cu–30% Zn alloys [58], the grain size values at the half radius are not available, therefore the mean of the data measured in the center and the periphery is presented in Table 3.1. The minimum grain and crystallite size values as a function of the maximum dislocation density are plotted in Fig. 3.9. It can be concluded that, although there is no strict correlation between the grain or crystallite size and the dislocation density of the UFG metals processed by SPD procedures, the higher dislocation density is associated with smaller grain and crystallite sizes. This is a consequence of the fact that the basic mechanism of grain refinement in SPD materials is the arrangement of dislocations into grain and subgrain boundaries. Table 3.1 also shows that the grain size determined by TEM is usually two to six times larger than the crystallite size obtained by X-ray line profile analysis. This is a consequence of the fact that the coherently scattering domains (crystallites) in SPD-processed materials correspond to the subgrains and/or the dislocation cells inside the grains bounded by high-angle grain boundaries.
Table 3.1
The maximum dislocation density and the minimum crystallite size determined by X-ray line profile analysis, and the minimum grain size obtained by transmission electron microscopy for metallic materials processed by severe plastic deformation
| Material | Processing method | Grain size (nm) | Crystallite size (nm) | Dislocation density (1014 m−2) | References |
| Pure metals | |||||
| Al | ECAP at RT | 1200 | 272 | 1.8 | [6] |
| Al | HPT at RT | 800 | – | – | [59] |
| Al | Cryogenic rolling at 77 K, reduction = 0.75 | 200 | – | – | [60] |
| Cu | ECAP at RT | 200 | 70 | 21 | [4,7] |
| Cu | HPT at RT | 160 | 75 | 37 | [43,48] |
| Au | ECAP at RT | 460 | 72 | 17 | [61] |
| Ni | 8 ECAP + 5 HPT at RT | 140 | 48 | 25 | [62] |
| Ni | HPT at RT | – | – | 34 | [48] |
| Ag | ECAP at RT | 200 | 60 | 46 | [10] |
| Ag | HPT at RT | 200 | 50 | 154 | [53] |
| Ti | ECAP at 700 K | 265 | 40 | 30 | [15] |
| Solid solution alloys | |||||
| Al–1% Mg | ECAP at RT | 450 | 88 | 3.9 | [9] |
| Al–1% Mg | HPT at RT | 200 | 114 | 3.8 | [63] |
| Al–3% Mg | ECAP at RT | 300 | 65 | 23 | [9] |
| Table Continued | |||||

| Material | Processing method | Grain size (nm) | Crystallite size (nm) | Dislocation density (1014 m−2) | References |
| Al-7075, solid solution | HPT at RT | 26 | – | 320 | [64] |
| Cu–10% Zn | HPT at RT | 145 | 60 | 34 | [58] |
| Cu–30% Zn | HPT at RT | 85 | 34 | 81 | [58] |
| Cu–5% Al | ECAP at RT | 107 | – | – | [65] |
| Cu–8% Al | ECAP at RT | 82 | – | – | [65] |
| IF steel | ECAP at RT | 360 | 66 | 10 | [11] |
| IF steel | HPT at RT | 275 | 80 | 8 | [54] |
| 316L steel (Fe-Cr-Ni-Mo-Mn) | HPT at RT | 45 | 21 | 133 | [66] |
| Dispersion-strengthened alloys | |||||
| Al-6082 | ECAP at RT | 300 | 76 | 5.4 | [9] |
| Al–4.8% Zn–1.2% Mg–0.14% Zr | ECAP at 473 K | 500 | 165 | 3.2 | [67] |
| Al–5.7% Zn–1.9% Mg–0.35% Cu | ECAP at 473 K | 300 | 119 | 3.4 | [67] |
| Al–5.9% Mg–0.3% Sc–0.18% Zr | HPT at RT | 50 | 37 | 24 | [13] |
| Al–30% Zn | HPT at RT | 190 | 170 | 4.2 | [68,69] |
| Mg–9% Al–1% Zn-0.25Mn (AZ91) | ECAP at 543 K | 1200 | 97 | 2 | [32] |
| Mg–4% Al–1% Ca (AX41) | Extrusion at 623 K+ ECAP at 523 K | 1500 | 219 | 0.9 | [70] |
| Mg–4% Al–1% Ca (AX41) | Extrusion at 623 K+ ECAP at 493 K | 800 | 217 | 0.7 | [71] |
| Mg–3% Al–1% Zn (AZ31) | HPT at RT | 200 | 70 | 7 | [35] |
| Mg–3% Al–1% Zn (AZ31) | Extrusion at 623 K+ ECAP at 453 K | 500 | 120 | 1.7 | [37] |
| Cu–0.18% Zr | HPT at RT | 280 | 100 | 20 | [72] |
| Cu–0.18% Zr | ECAP at RT | 250 | 73 | 39 | [73] |
| Cu–0.7% Cr | HPT at RT | 209 | 58 | 38 | [74] |
| Cu–9.85% Cr | HPT at RT | 143 | 52 | 75 | [74] |
| Cu–27% Cr | HPT at RT | 40 | 36 | 163 | [74] |
| Cu–0.9% Hf | HPT at RT | 155 | 50 | 64 | [75] |
| Cu–0.7% Cr–0.9% Hf | HPT at RT | 108 | 47 | 68 | [75] |
| Cu-3% Ag | Cryorolling at 77 K | 150 | 30 | 48 | [76] |
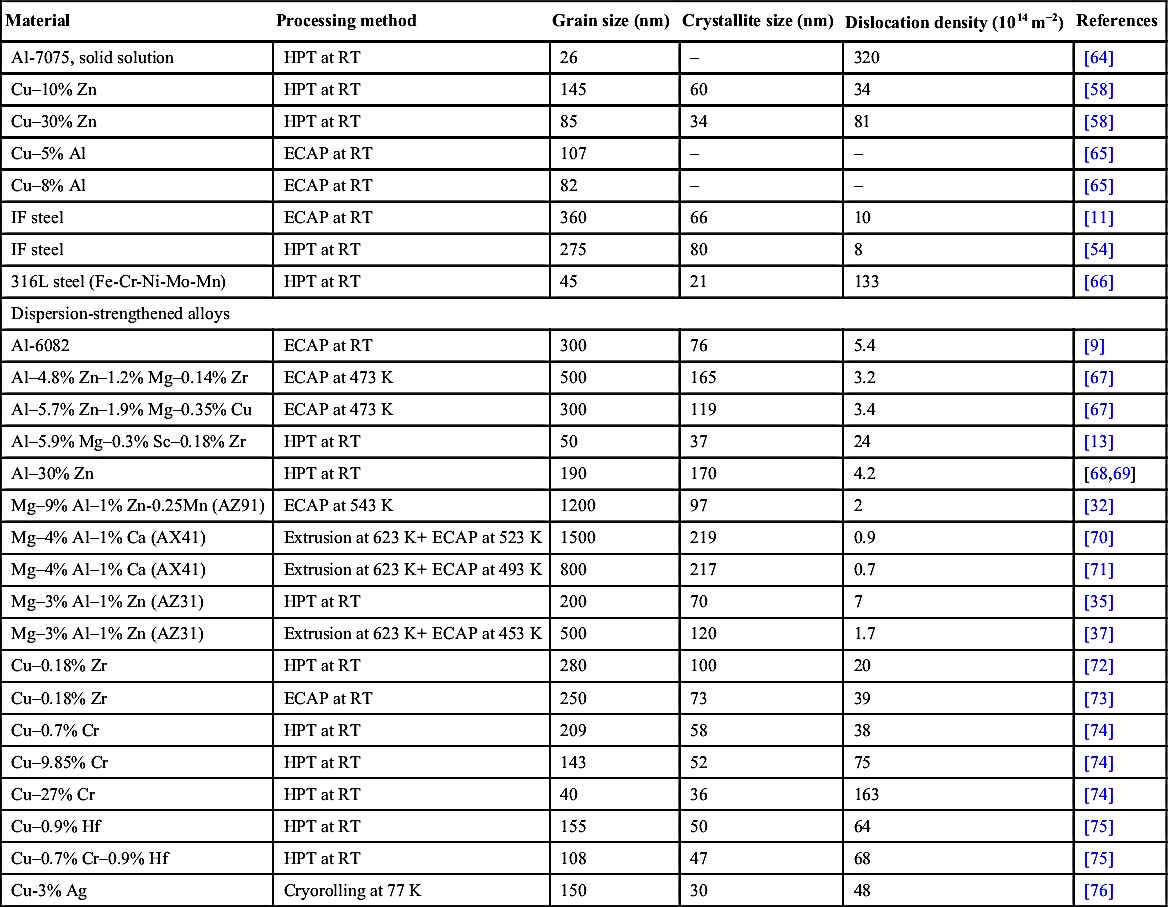

Figure 3.9 The saturation grain and crystallite size values determined by transmission electron microscopy and X-ray line profile analysis, respectively, for severe plastic deformation-processed ultrafine-grained materials as a function of the saturation dislocation density. The data are taken from Table 3.1 and plotted in double logarithmic scales as the values span about two orders of magnitude. The experimental error corresponds to the size of symbols.
The saturation dislocation density is determined by the dynamic equilibrium between the formation and annihilation of dislocations. The more difficult the dislocation annihilation during SPD processing, the higher the maximum dislocation density. The annihilation processes are hindered by (1) the low homologous temperature of SPD, (2) the solid solution alloying, (3) the second phase particles, and (4) the high degree of dislocation dissociation due to the low SFE. The homologous temperature of SPD can be kept at low values either by processing at low temperatures (e.g., cryogenic rolling at liquid nitrogen temperature, 77 K [60]) or by applying SPD on metals having high melting points. Fig. 3.10 illustrates that the higher the melting point (Tm) in pure fcc metals having medium or high SFE (Al, Ni, Cu, and Au), the larger the maximum dislocation density achievable by ECAP at RT. As the grain refinement occurs by arranging of dislocations into subgrain and grain boundaries, the higher saturation dislocation density is accompanied by smaller crystallite and grain sizes as shown in Fig. 3.10. The effect of the melting point on the saturation dislocation density can be explained by the thermally activated processes (cross-slip and climb) of dislocation annihilation. For instance, in fcc metals having medium or high SFE, the degree of dislocation dissociation is not very large, therefore cross-slip of screw dislocations occurs more easily than climb of edge segments during SPD processing. As a consequence, the maximum dislocation density at high strains is determined by the diffusion-controlled climb process. The diffusion coefficient is given by
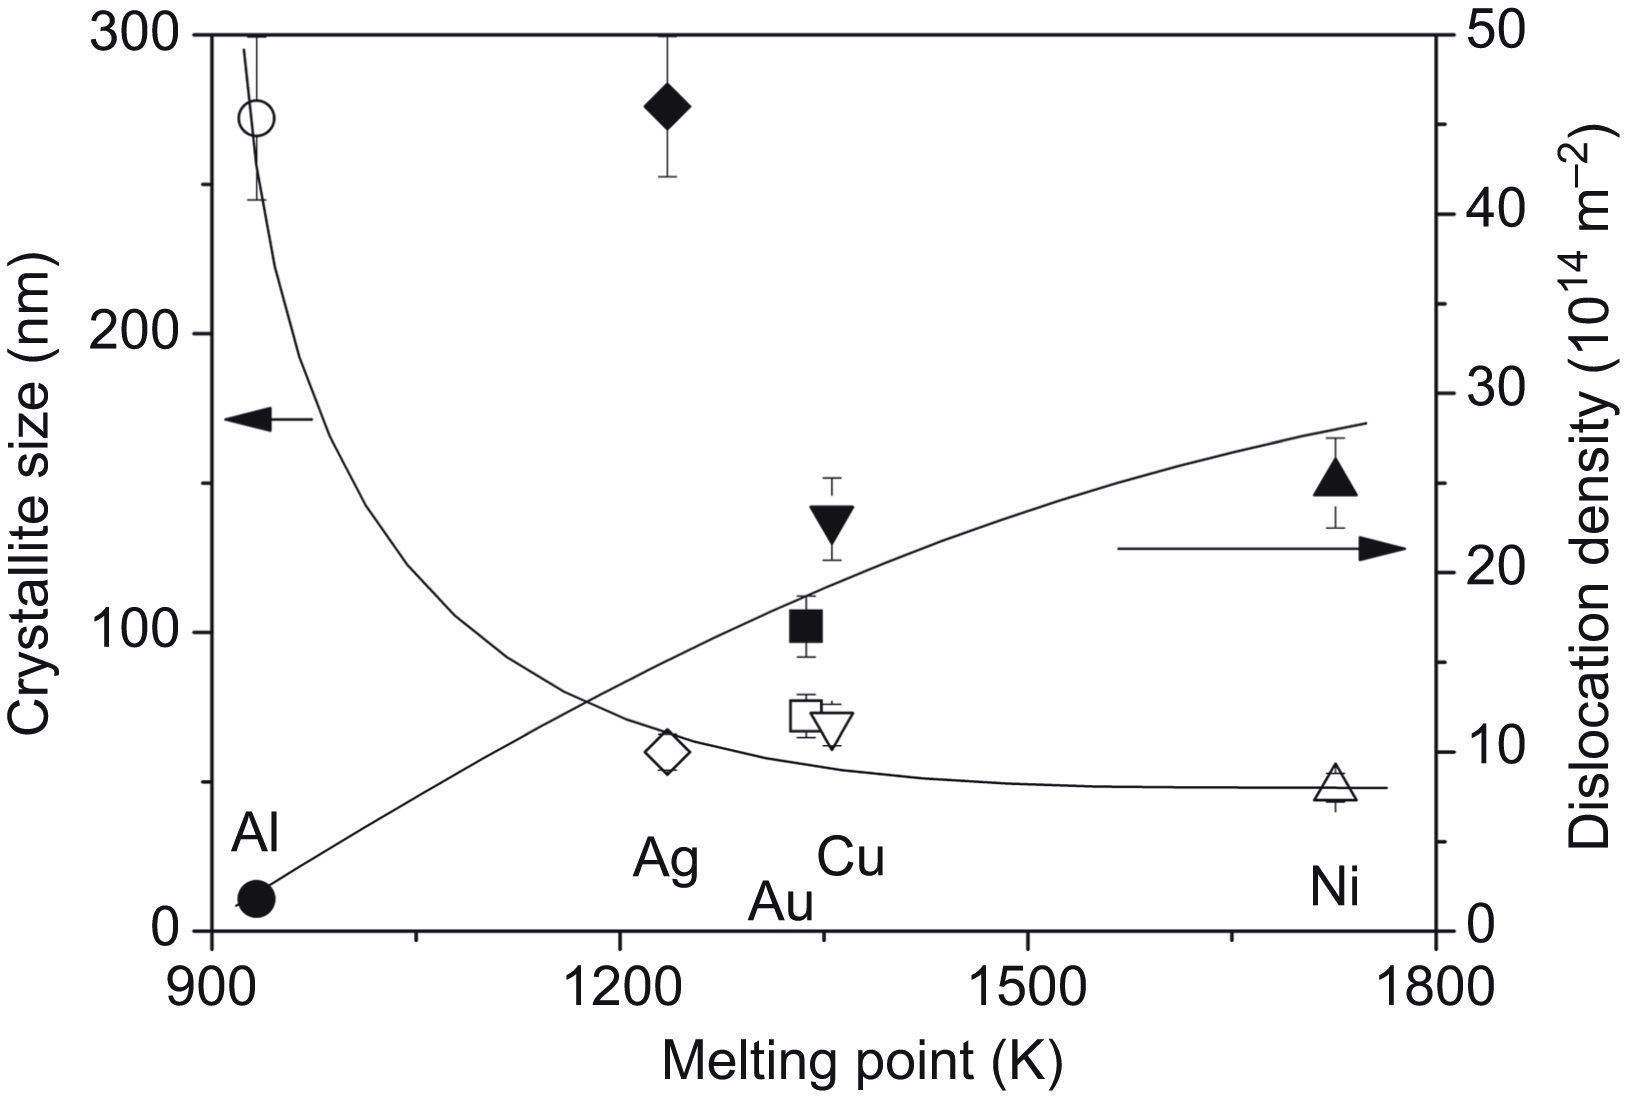
Figure 3.10 The saturation crystallite size and dislocation density as a function of melting point for different pure face-centered cubic metals processed by equal channel angular pressing at room temperature.
![]() (3.1)
(3.1)
where Qself is the activation energy of self-diffusion, R is the universal gas constant, and T is the absolute temperature. It is known that Qself for fcc metals is proportional to the melting point [77].
![]() (3.2)
(3.2)
where 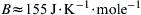 . As the preexponential factor, D0, has similar values for Al, Cu, Au, and Ni, the diffusion coefficient depends primarily on the homologous temperature (T/Tm) due to Eqs. (3.1) and (3.2). At RT, the larger the melting point, the higher the activation energy and therefore the slower the climb process resulting in larger saturation dislocation density.
It is noted that climb is usually considered as an important process only at high temperatures due to the slow diffusion at RT. However, UFG materials produced by SPD have a high volume fraction of grain boundaries and a large density of dislocations together with a large concentration of excess vacancies. The activation energy of diffusion along grain boundaries and dislocation cores is about half of that for self-diffusion; therefore the vacancy migration in nanomaterials is faster than in their coarse-grained counterparts by a factor of 1010 to 1020 [78]. Consequently, diffusion may control the annihilation of dislocations even at RT. The high internal stresses developed in SPD-processed nanomaterials due to the large defect densities also assist climbing considerably.
Fig. 3.10 shows that the saturation dislocation density for pure Ag is much higher than the values for other fcc metals having similar melting points (Au, Cu). The very large dislocation density in Ag can be explained by its extremely low SFE (16 mJ/m2 [51]) yielding a high degree of dislocation dissociation that hinders both cross-slip and climb thereby retarding dislocation annihilation. The evolution of the defect structure in low SFE materials will be presented in Chapter 4.
The temperature and strain rate of SPD processing have a significant effect on the defect structure and grain size in nanocrystalline or UFG metals and alloys. For a given strain and processing method, the higher the strain rate and/or lower the temperature of deformation, the larger the dislocation density and smaller the grain size. The combined effects of strain rate ( ) and temperature can be expressed by the Zener–Hollomon parameter defined as
![]() (3.3)
(3.3)
where Q is the related activation energy for the dominant diffusion process (bulk or grain boundary diffusion). For a constant strain value, the following relationship between the grain size (d) and parameter Z is suggested:
![]() (3.4)
(3.4)
where A and B depend on the studied material. In the case of Cu, assuming a grain boundary diffusion activation energy of 73 kJ/mol, the value of ln Z is 22 for RT deformation at a strain rate of 10−3 s−1 [79]. With increasing ln Z from 22 to 66 in uniaxial deformation of Cu, the grain size decreases from 320 to 66 nm, while the dislocation density increases from 14 × 1014 m−2 to 30 × 1014 m−2 at a fixed equivalent strain of 2 [79]. Deformation twinning occurs in Cu when ln Z exceeds 30, and the twin boundary frequency increases at higher Z. The grain sizes achieved in Cu at different strain rates and temperatures of SPD are close to each other for similar values of parameter Z [80].
Similarly to pure metals, in solid solution alloys the dislocation density, the crystallite, and grain sizes saturate after approximately four to eight passes of ECAP [5–9,81–84]. At the same time, alloying usually leads to an increase of the critical imposed strain that corresponds to saturation. For instance, in 99.99% purity Al and Al–3% Mg alloy processed by ECAP at RT the maximum value of the dislocation density is achieved after the first and fourth passes, respectively. Additionally, the maximum dislocation density increases while the minimum values of the crystallite and grain sizes decrease due to alloying. As an example, Fig. 3.11 shows the saturation values of the dislocation density and the grain size as a function of the Mg concentration in Al processed by ECAP at RT [9]. Both the larger strain needed for saturation and the higher value of the saturation dislocation density in alloys can be explained by the pinning effect of solute atoms on dislocations that hinders their annihilation. As grain refinement in SPD metals occurs usually by the rearrangement of dislocations into subgrain and grain boundaries, the higher dislocation density results in a decrease of grain size for higher Mg concentrations as shown in Fig. 3.11 and demonstrated in the TEM images of Fig. 3.12. In pure Al the saturation grain size is 1200 nm while 3 wt.% Mg alloying leads to a reduction to 300 nm. It is noted that although the minimum grain size in Al–3% Mg alloy is only 4 times smaller than in pure Al, the maximum dislocation density is approximately 13 times higher (see Table 3.1). The dragging effect of solute atoms on dislocations also hinders the evolution of low-angle grain boundaries into high-angle boundaries during SPD. For instance, although in both 99.99% purity Al and Al–1% Mg alloy the fraction of high-angle grain boundaries increases with increasing the number of ECAP passes, its maximum value in Al–1% Mg (∼65%) is lower than that for pure Al (∼75%) [85,86].

Figure 3.11 The minimum grain size and the maximum dislocation density as a function of Mg content in Al solid solutions. Reprinted from J. Gubicza, N.Q. Chinh, Gy. Krállics, I. Schiller, T. Ungár, Microstructure of ultrafine-grained fcc metals produced by severe plastic deformation, Current Applied Physics 6 (2006) 194–199 with permission from Elsevier.

Figure 3.12 Transmission electron microscopy images taken on pure Al (a) and Al–3% Mg (b) processed by eight equal channel angular pressing passes at room temperature. Reprinted from J. Gubicza, N.Q. Chinh, Z. Horita, T.G. Langdon, Effect of Mg addition on microstructure and mechanical properties of aluminum, Materials Science and Engineering A 387–389 (2004) 55–59 with permission from Elsevier.
It is worthwhile to mention that the minimum grain size achievable by SPD is rather affected by the deformation conditions than the initial grain size before deformation. For instance, if RT HPT processing is performed on electrodeposited nanostructured Ni with the grain size of 30 nm, there is a grain growth to 129 nm [87], which is close to the grain size limit for HPT-treated coarse-grained Ni (140–170 nm [18]). Although the dislocation density increases from 120 × 1014 to 200 × 1014 m−2 during HPT of electrodeposited Ni, this cannot compensate the softening effect of grain growth and the hardness decreases from 7.2 to 6.1 GPa. Similar grain growth was also observed during indentation of nanomaterials, while there is a lack of grain growth during tensile testing. This suggests that only stresses above a critical value induce grain growth in nanocrystalline materials. The large dislocation density in the electrodeposited Ni after HPT may be a consequence of the high impurity content that is usually a characteristic feature of electrodeposited materials.
3.4. Excess Vacancy Concentration Due to Severe Plastic Deformation
It is well known that during deformation in addition to dislocations, vacancies are also formed. The most important phenomenon resulting in vacancy production is the climb of edge dislocation segments. However, an edge dislocation may climb to different directions relative to its extra half plane; therefore it may act as either a source or a sink of vacancies. Fig. 3.13a and b shows schematic drawings of two edge dislocations climbing in opposite directions by increasing or decreasing the extension of their extra half planes that leads to a production or annihilation of vacancies, respectively. The significant difference between the two climb processes is that the second one needs vacancy migration to the core of dislocation contrary to the first one. As a consequence, in the beginning of SPD processing at RT, due to the slow diffusion the climb-producing vacancy occurs more easily than the climb-sinking vacancy. Therefore the vacancy production rate is higher than the rate of annihilation resulting in an increase of excess vacancy concentration with increasing strain. At large strain values, the vacancy migration becomes faster due to the large amounts of dislocations and grain boundaries, thereby the formation and annihilation of vacancies equilibrate yielding to a saturation concentration of excess vacancies at the given conditions of SPD.

Figure 3.13 Schematic drawings of two edge dislocations climbing in opposite directions by increasing or decreasing the extension of the extra half plane that leads to a production or annihilation of vacancies, respectively. The direction of atomic migration is indicated by arrows. The produced and the annihilated vacancies are denoted by solid and dashed squares, respectively.
The concentration of excess vacancies was investigated mainly in Cu and Ni processed by ECAP and HPT [8,48,78–83]. In HPT-deformed 99.95% purity Cu, positron annihilation spectroscopy (PAS) revealed the absence of monovacancies while a large amount of vacancy clusters were identified [88]. Most probably, the monovacancies created during HPT processing either disappear by diffusion to sinks such as grain boundaries or agglomerate into small clusters. The vacancy clusters at the center of the HPT-processed Cu and Ni disks consist of four to five vacancies, while the clusters at the periphery consist of seven to nine vacancies [88]. Neither the increase of number of HPT revolutions nor the raise of pressure from 2 to 4 GPa results in a change of the size of vacancy clusters. The densities of dislocations and vacancies were so high in the HPT-processed Cu samples that every positron is very quickly trapped at dislocations or vacancy clusters (referred to as saturated positron trapping). As a consequence, the concentration of vacancy clusters could be only evaluated from the PAS signal with the help of the dislocation density determined by X-ray line profile analysis. The ratio, I2/I1, of the intensities of PAS signals corresponding to positrons trapped in vacancy clusters and at dislocations is directly proportional to the ratio of cluster concentration and dislocation density [88]:
![]() (3.5)
(3.5)
where νV, νD are the specific positron trapping rate to vacancy clusters and dislocations, respectively, cV is the vacancy cluster concentration, and ρ is the dislocation density. The values of νV, νD for Cu are 1.2 × 10¹⁴ at s−1 and 0.6 × 10⁻⁴ m2 s−1, respectively [88]. This methodology most probably overestimates the vacancy cluster concentration as the calculation uses the total dislocation density while the positrons are mainly trapped at edge dislocation segments. The concentration of vacancy clusters increases with increasing of number of HPT revolutions in Cu from about 1.0 × 10⁻⁴ after 1 turn to about 2.5 × 10⁻⁴ after 25 revolutions as it is shown in Fig. 3.14 [88]. Multiplying the cluster concentration with the numbers of vacancies in the clusters, the total vacancy concentration is determined for the center and the periphery of the disks as a function of the number of revolutions and plotted in Fig. 3.15 [88]. The periphery exhibits enhanced concentration of vacancies due to larger size of vacancy clusters. The concentration of vacancies at both the center and the periphery of the disks increase with increasing number of HPT revolutions due to the increase of the imposed strain. At the center, the vacancy concentration is 5 × 10⁻⁴ after one turn that increases to 12 × 10−4 after 25 revolutions. At the periphery, the corresponding concentrations are 12 × 10−4 and 20 × 10−4 after 1 and 25 revolutions, respectively. These values have the same order of magnitude as the concentrations observed in other Cu and Ni disks processed by HPT at RT [48]. The vacancy concentration and the cluster size determined for different SPD-processed samples are listed in Table 3.2.

Figure 3.14 The vacancy cluster concentration in high-pressure torsion (HPT)-processed Cu as a function of the number of revolutions. The individual datum points given in Ref. [87] are not shown here, but all of them follow this line irrespective of the location in the HPT disk and the applied pressure (2 or 4 GPa). The scatter of datum points is illustrated by the error bar.
For ECAP-processed Cu, the vacancy concentration was determined by a combination of X-ray line profile analysis and residual electrical resistometry or differential scanning calorimetry (DSC) [8]. The decrease of electrical resistivity during annealing of the ECAP-processed samples is caused by the annihilation of lattice defects such as vacancies (vacancy clusters) and dislocations. The contribution of dislocations to resistivity can be estimated from the dislocation density determined by X-ray line profile analysis and the specific dislocation resistivity of Cu being 0.8 × 10⁻²⁵ Ωm−3 [89]. Subtracting this contribution from the total decrease of resistivity, the vacancy concentration can determined as the ratio of the remaining resistivity and the resistivity per unit vacancy concentration (0.62 × 10⁻⁴ Ωcm for Cu [90]). The vacancy concentrations obtained by this way are 1.5 × 10⁻⁴ and 3.5 × 10⁻⁴ after the first and fourth ECAP passes, respectively. These values are smaller than the concentrations determined in HPT-processed Cu samples. This can be explained by the larger imposed strain in HPT compared to ECAP. The vacancy concentration values determined from the released heat measured in DSC agree well with those obtained by resistometry [8]. In the DSC thermograms for ECAP-processed Cu samples, one exothermic peak was observed. The released heat is assumed to be a sum of the contributions of vacancies and dislocations. The stored energy in a unit volume corresponding to dislocations having half edge—half screw character is determined as [8]:

Figure 3.15 The concentration of vacancies in the center and at the periphery of Cu disks processed by different revolutions of high-pressure torsion (HPT). The individual datum points given in Ref. [88] are not shown here, but all of them follow this line irrespective of the applied pressure (2 or 4 GPa). The scatter of datum points is illustrated by the error bar.
Table 3.2
The concentration and the cluster size of vacancies obtained for metals processed by severe plastic deformation
| Material | Processing method | Cluster size | Vacancy concentration | References |
| Cu | 1 ECAP at RT | – | 1.5 × 10⁻⁴ | [8] |
| Cu | 4 ECAP at RT | – | 3.5 × 10⁻⁴ | [8] |
| 99.95% Cu | 1 HPT at RT, center of disk, p = 2–4 GPa | 4–5 | 5 × 10⁻⁴ | [88] |
| 99.95% Cu | 1 HPT at RT, periphery of disk, p = 2–4 GPa | 7–9 | 12 × 10−4 | [88] |
| 99.95% Cu | 25 HPT at RT, center of disk, p = 2–4 GPa | 4–5 | 12 × 10−4 | [88] |
| 99.95% Cu | 25 HPT at RT, periphery of disk, p = 2–4 GPa | 7–9 | 20 × 10−4 | [88] |
| 99.99% Cu | HPT at RT, p = 4–8 GPa, shear strain = 20 | – | 4 × 10⁻⁴ | [48] |
| 99.998% Ni | HPT at RT, p = 2 GPa, shear strain = 20 | 1–2 + clusters with unknown size | 1.1 × 10⁻⁴ (single/double vacancies) 3.5 × 10⁻⁴ (in clusters) | [48] |
| 99.998% Ni | HPT at RT, p = 8 GPa, shear strain = 20 | 1–2 + clusters with unknown size | 0.9 × 10⁻⁴ (single/double vacancies) 5 × 10⁻⁴ (in clusters) | [48] |
| Cu–0.18% Zr | 8 ECAP at RT | 4 | 5 × 10⁻⁵ | [73] |

![]() (3.6)
(3.6)
where G is the shear modulus (47 GPa for Cu), b is the magnitude of Burgers vector (0.25 nm for Cu), and ρ is the dislocation density. Subtracting Edisl from the released heat and dividing the remaining stored energy by the formation energy of a vacancy, 0.195 × 10⁻¹⁸ J [90], the vacancy concentration can be determined. It is worth to note that the values of cv obtained for Cu after ECAP or HPT at RT has the same order of magnitude as the equilibrium vacancy concentration near the melting point. Taking 1.28 eV as the value of the vacancy formation energy (EF) and 12.2 as the preexponential factor (c0) [91], the Arrhenius-type formula of vacancy concentration
![]() (3.7)
(3.7)
gives 4 × 10⁻²¹ and 2 × 10⁻⁴ for the equilibrium vacancy concentrations at RT and the melting point, respectively. This means that the vacancy concentration after ECAP at RT is 17 orders of magnitude larger than its equilibrium value due to SPD. It is noted that vacancies have a considerable contribution to the diffuse background scattering under X-ray diffraction peaks; therefore the ratio of the integrated background and the integrated peak intensity can be used for the determination of vacancy concentration after a calibration procedure [92].
In the case of HPT-processed 99.99% and 99.998% purity Ni, two exothermic peaks were observed on the DSC thermograms [48]. The first peak at lower temperature corresponds to the disappearance of single/double vacancies while the second one at higher temperature is related to the annihilation of vacancy clusters and dislocations. The first DSC peak was not observed for 99.99% Cu processed under the same conditions (see earlier) as most probably all the vacancies are clustered due to the smaller values of SFE and melting point of Cu. In Ni with lower purity than 99.99%, single/double vacancy peak is also not detected as impurities facilitate the formation of vacancy clusters. The single/double vacancy concentration in Ni was determined as the ratio of the heat released in the first peak and the formation energy of a vacancy (0.29 × 10⁻¹⁸ J for Ni [90]). The concentration of single/double vacancies increases with increasing shear strain during HPT, and it saturates at about 1.0 ± 0.1 × 10⁻⁴ after a shear strain of about 20 irrespective of the pressure (2–8 GPa) [48]. The concentration of vacancy clusters also increases with increasing strain and its saturation values are 3.5 ± 1.0 × 10⁻⁴ and 5.1 ± 1.0 × 10⁻⁴ for 2 and 8 GPa, respectively [48]. The cluster size in the HPT-processed Ni samples was not determined. However, if we assume that the clusters consist of four to nine vacancies similarly as in Cu and we take into account the difference between the concentrations of clusters and single/double vacancies, it is evident that more than 90% of vacancies are clustered.
3.5. Defects and Phase Transformation in Nanomaterials Processed by Severe Plastic Deformation
When SPD processing is performed on supersaturated solid solution alloys at high temperatures, grain refinement and formation of precipitates occur simultaneously. The precipitation processes are promoted by SPD since lattice defects, such as dislocations and grain boundaries, act as nucleation sites for precipitates. This can be explained by (1) the faster diffusion of alloying elements at lattice defects (kinetic effect) and (2) the decrease of free energy due to annihilation of defects during phase transformation (thermodynamic effect). The influence of SPD processing on phase composition was studied in Al–4.8Zn–1.2Mg–0.14Zr and Al–5.7Zn–1.9Mg–0.35Cu (wt.%) alloys [67]. First, these materials were solution heat-treated for 30 min at 743 K and water-quenched to introduce supersaturated solid solutions. Then, the samples were processed by eight passes of ECAP at 473 K which yielded UFG microstructure with the grain sizes of about 300–500 nm. It is noted that in these Al–Zn–Mg–Zr and Al–Zn–Mg–Cu alloys ECAP processing for eight passes results in a two times higher dislocation density (3.2–3.4 × 10¹⁴ m−2) and a three times smaller grain size than in pure Al, despite the much higher temperature of ECAP in the former case (473 K for the alloy and RT for pure Al) [67]. The higher dislocation density and the smaller grain size can be attributed to the pinning effect of alloying elements on lattice defects.
The microstructure and the phase composition of the ECAP-processed Al–Zn–Mg–Zr and Al–Zn–Mg–Cu alloys were compared with samples artificially aged at the same temperature and for the same time (30 min) as applied during ECAP. In the ECAP-processed specimens, stable incoherent MgZn2 precipitates (η-phase particles) formed while artificial aging yielded only negligible concentration of η precipitates and mainly coherent Guinier-Preston (GP) zones develop [67]. As the precipitation sequence in these alloys is coherent GP zones, semicoherent η′ precipitates and incoherent η-phase particles, the observed difference in the phase compositions of the ECAP-processed and the aged samples indicates the promoting effect of SPD on precipitation. The experimental results show that processing by ECAP at a high temperature influences not only the precipitation kinetics but also there is a significant effect on the shape of the η precipitates. The Al–Zn–Mg–Zr and Al–Zn–Mg–Cu alloys aged for long times contain long rod-like precipitates but these are absent and only essentially spherical particles are present in the specimens processed by ECAP [67]. On the other hand, the precipitation during SPD most probably influences the grain refinement since the pinning effect of the second phase particles on dislocations and grain boundaries yields higher dislocation density and smaller grain size than for the pure counterparts.
In multiphase nanomaterials, the energy of interfaces strongly influences the phase composition [76,93]. This phenomenon is caused by the Gibbs–Thomson effect which reveals that the solubility limit in the matrix phase depends on the size of secondary phase particles (d) and the interface energy (γ) as [94,95]:
![]() (3.8)
(3.8)
where T is the temperature of annealing, c∞ and cd are the solute concentrations in the matrix with precipitates having infinitely small curvature (large diameter) and diameter of d, respectively, R is the molar gas constant, Vm is the molar volume. The value of γ depends on the interface structure. For instance, the energies of semicoherent (111)/(111) and (100)/(100) Ag/Cu interfaces are 0.23 and 0.53 J/m2, respectively [96]. These values are much lower than that for coherent interfaces (∼1 J/m2) [97]. Electron microscopy studies revealed both cube-on-cube and heterotwin orientation relationships between Cu and Ag phases separated by semicoherent interfaces [98–100]. It was shown that the size of Ag precipitates influences the nature of interfaces: below 2 nm misfit dislocations—which are characteristic features of semicoherent boundaries—were not observed in Cu/Ag interfaces, therefore these boundaries were considered to be coherent [101,102]. The dashed and solid curves in Fig. 3.16 show the Ag solute concentration in the Cu matrix as a function of the size of Ag nanoparticles at 623 K for interface energies of 0.38 and 1 J/m2, respectively. The former energy was obtained as the arithmetic average of the energies of (111)/(111) and (100)/(100) Ag/Cu semicoherent interfaces. The value of 1 J/m2 corresponds to coherent interfaces, as discussed above. Fig. 3.16 shows that the Gibbs–Thomson effect becomes significant if the Ag particle size is smaller than 10–20 nm. It can be seen that the smaller the Ag particle size and the higher the interface energy, the larger the solute Ag concentration in the Cu matrix. Therefore, interface engineering by thermomechanical treatments of alloys may be an effective tool for tailoring multiphase microstructures.
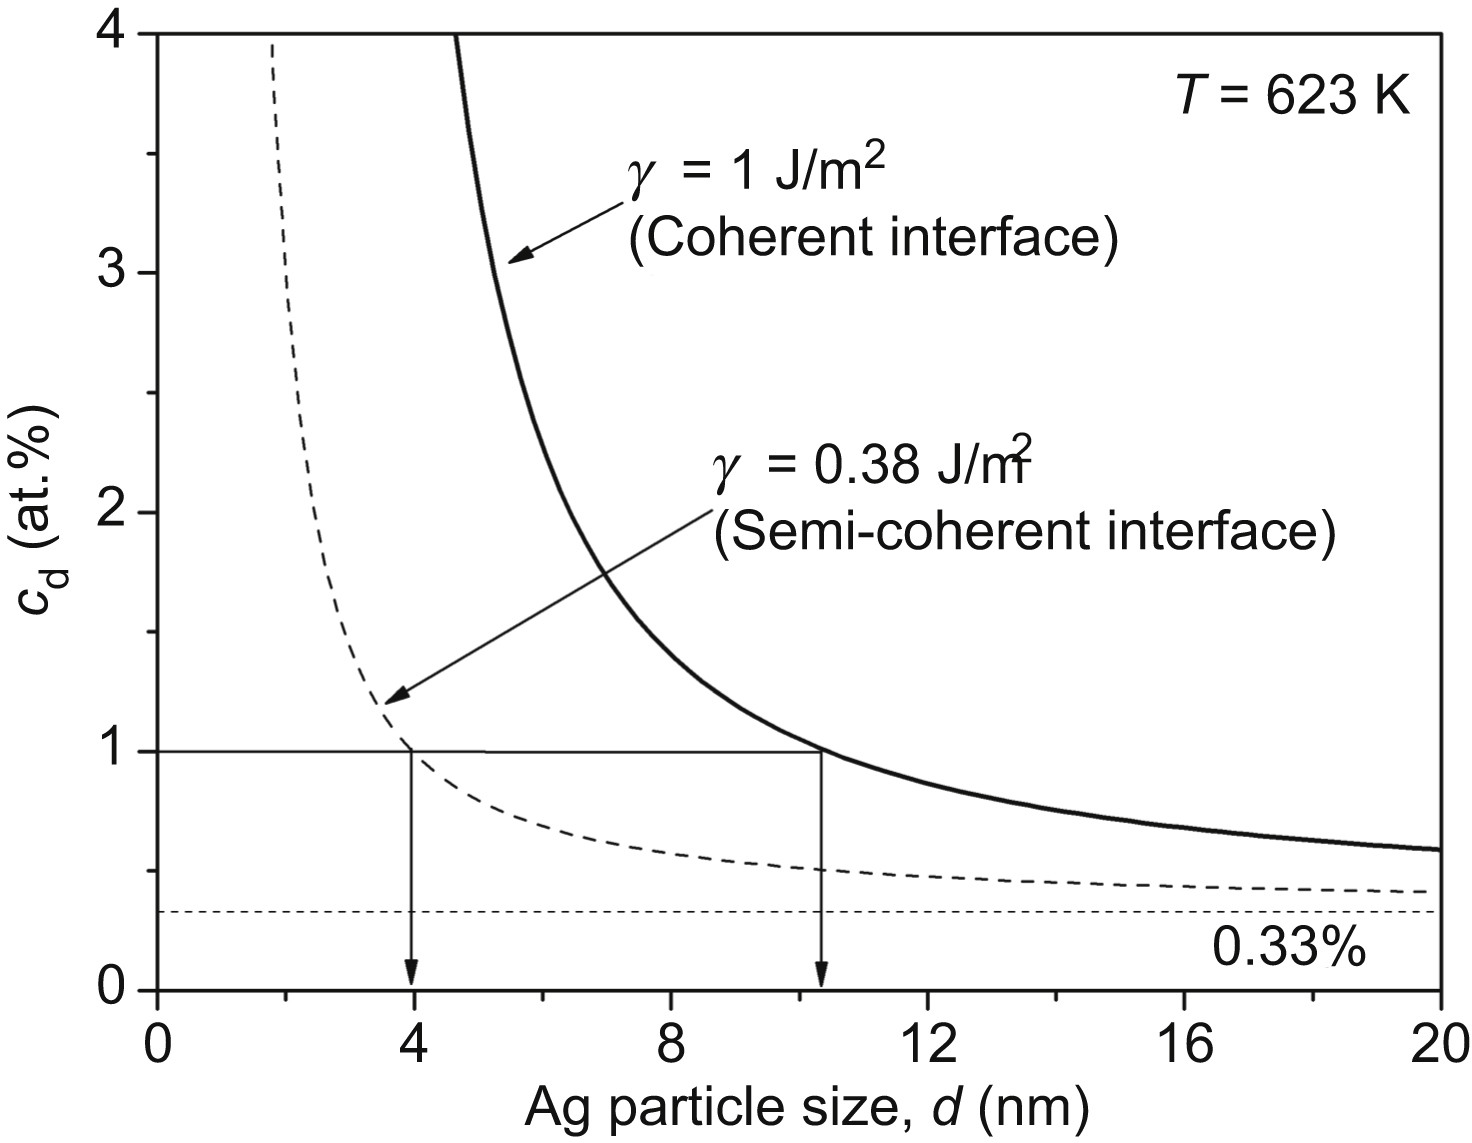
Figure 3.16 The equilibrium Ag solute concentration in the Cu matrix as a function of the size of Ag nanoparticles at 623 K for two interface energies 0.38 and 1 J/m2. The horizontal dotted line represents the equilibrium Ag concentration in Cu matrix containing Ag particles with very large radius (c∞).
The influence of the Gibbs–Thomson effect on the microstructure evolution in multiphase materials was demonstrated in a Cu–Ag alloy [76]. Supersaturated solid solution Cu–3 at.% Ag alloy was SPD-processed by cryorolling at liquid nitrogen temperature (∼77 K). The total thickness reduction during cryorolling was 85% which corresponds to a logarithmic strain of ∼2. The Ag solute content in the cryorolled Cu matrix was about 1 at.% while ∼2 at.% Ag was present as secondary Ag-rich phase. This phase was formed from the supersaturated alloy due to the promoting effect of SPD on precipitation (see above). The grain size of the Cu matrix was 100–200 nm. The average size of secondary Ag particles was ∼20 nm, however, a large number of Ag precipitates with sizes smaller than 8 nm was also detected by TEM. The dislocation density in the cryorolled Cu–3 at.% Ag alloy was very high (∼48 × 1014 m−2) due to the pinning effect of Ag solute atoms on dislocations.
Annealing of the cryorolled UFG Cu–3 at.% Ag alloy at 623 K yielded formation of a strongly heterogeneous microstructure, as indicated by the splitting of each Cu diffraction peak into two components [76]. As an example, Fig. 3.17 shows reflection (220) for the sample annealed for 20 min. For comparison, the same reflection for the cryorolled specimen is also presented. The splitting of the peaks is caused by the development of an inhomogeneous solute atom distribution in the Cu matrix during annealing, resulting in a variation of the lattice parameter of the Cu matrix. For the simplicity, each line profile was evaluated by fitting it with the sum of two profile components having different Bragg angles which correspond to two distinct regions of the matrix with different average lattice parameters. The subprofiles appeared at higher and lower diffraction angles correspond to the matrix volumes with low- and high-solute Ag contents, which are referred to as Regions 1 and 2, respectively [76]. From the positions, intensities and shapes of the diffraction subprofiles, the solute Ag content in the Cu matrix, the fractions of Cu and Ag phases, and the dislocation density in the two matrix regions were determined, respectively. According to the results, the development of the heterogeneous microstructure during annealing at 623 K is depicted schematically in Fig. 3.18. In the cryorolled sample, the average Ag solute concentration is 1%. However, as it is shown in Fig. 3.16, around Ag particles with semicoherent interfaces and sizes smaller than ∼4 nm, the equilibrium Ag solute concentration in the Cu matrix is higher than 1%. Therefore, these particles tend to dissolve into the matrix during annealing, resulting in an increase of solute Ag content and a corresponding decrease of the volume fraction of Ag particles (see the second picture in Fig. 3.18). The matrix regions around these small Ag particles correspond to Region 2. The particles larger than the critical value (∼4 nm for semicoherent interfaces, see Fig. 3.16) grow since the equilibrium solubility limit around them is smaller than the initial 1%. In these volumes, denoted as Region 1, the solute Ag content decreases while the fraction of Ag phase increases (see the second picture in Fig. 3.18). Thus, it can be concluded that the Gibbs–Thomson effect resulted in the development of a heterogeneous two-phase microstructure in Cu–3 at.% Ag alloy processed by cryorolling and subsequent annealing. It is noted that for coherent interfaces the critical Ag particle size is larger (∼10 nm), as shown by the solid curve in Fig. 3.16.

Figure 3.17 Reflection (220) of the Cu–3 at.% Ag sample in cryorolled state and after annealing at 623 K for 20 min. The symbols and the solid lines represent the measured data and the fitted curves, respectively. The diffraction peak in the annealed condition is a sum of two reflections related to Regions 1 and 2 having different average lattice parameters (for details see the text). In this figure the integrated intensity (the area under the peak after background subtraction) is normalized to unity for both cryorolled and annealed states. Reprinted from J. Gubicza, Z. Hegedűs, J.L. Lábár, A. Kauffmann, J. Freudenberger, V. Subramanya Sarma, Solute redistribution during annealing of a cold rolled Cu–Ag alloy, Journal of Alloys and Compounds 623 (2015) 96–103 with permission from Elsevier.
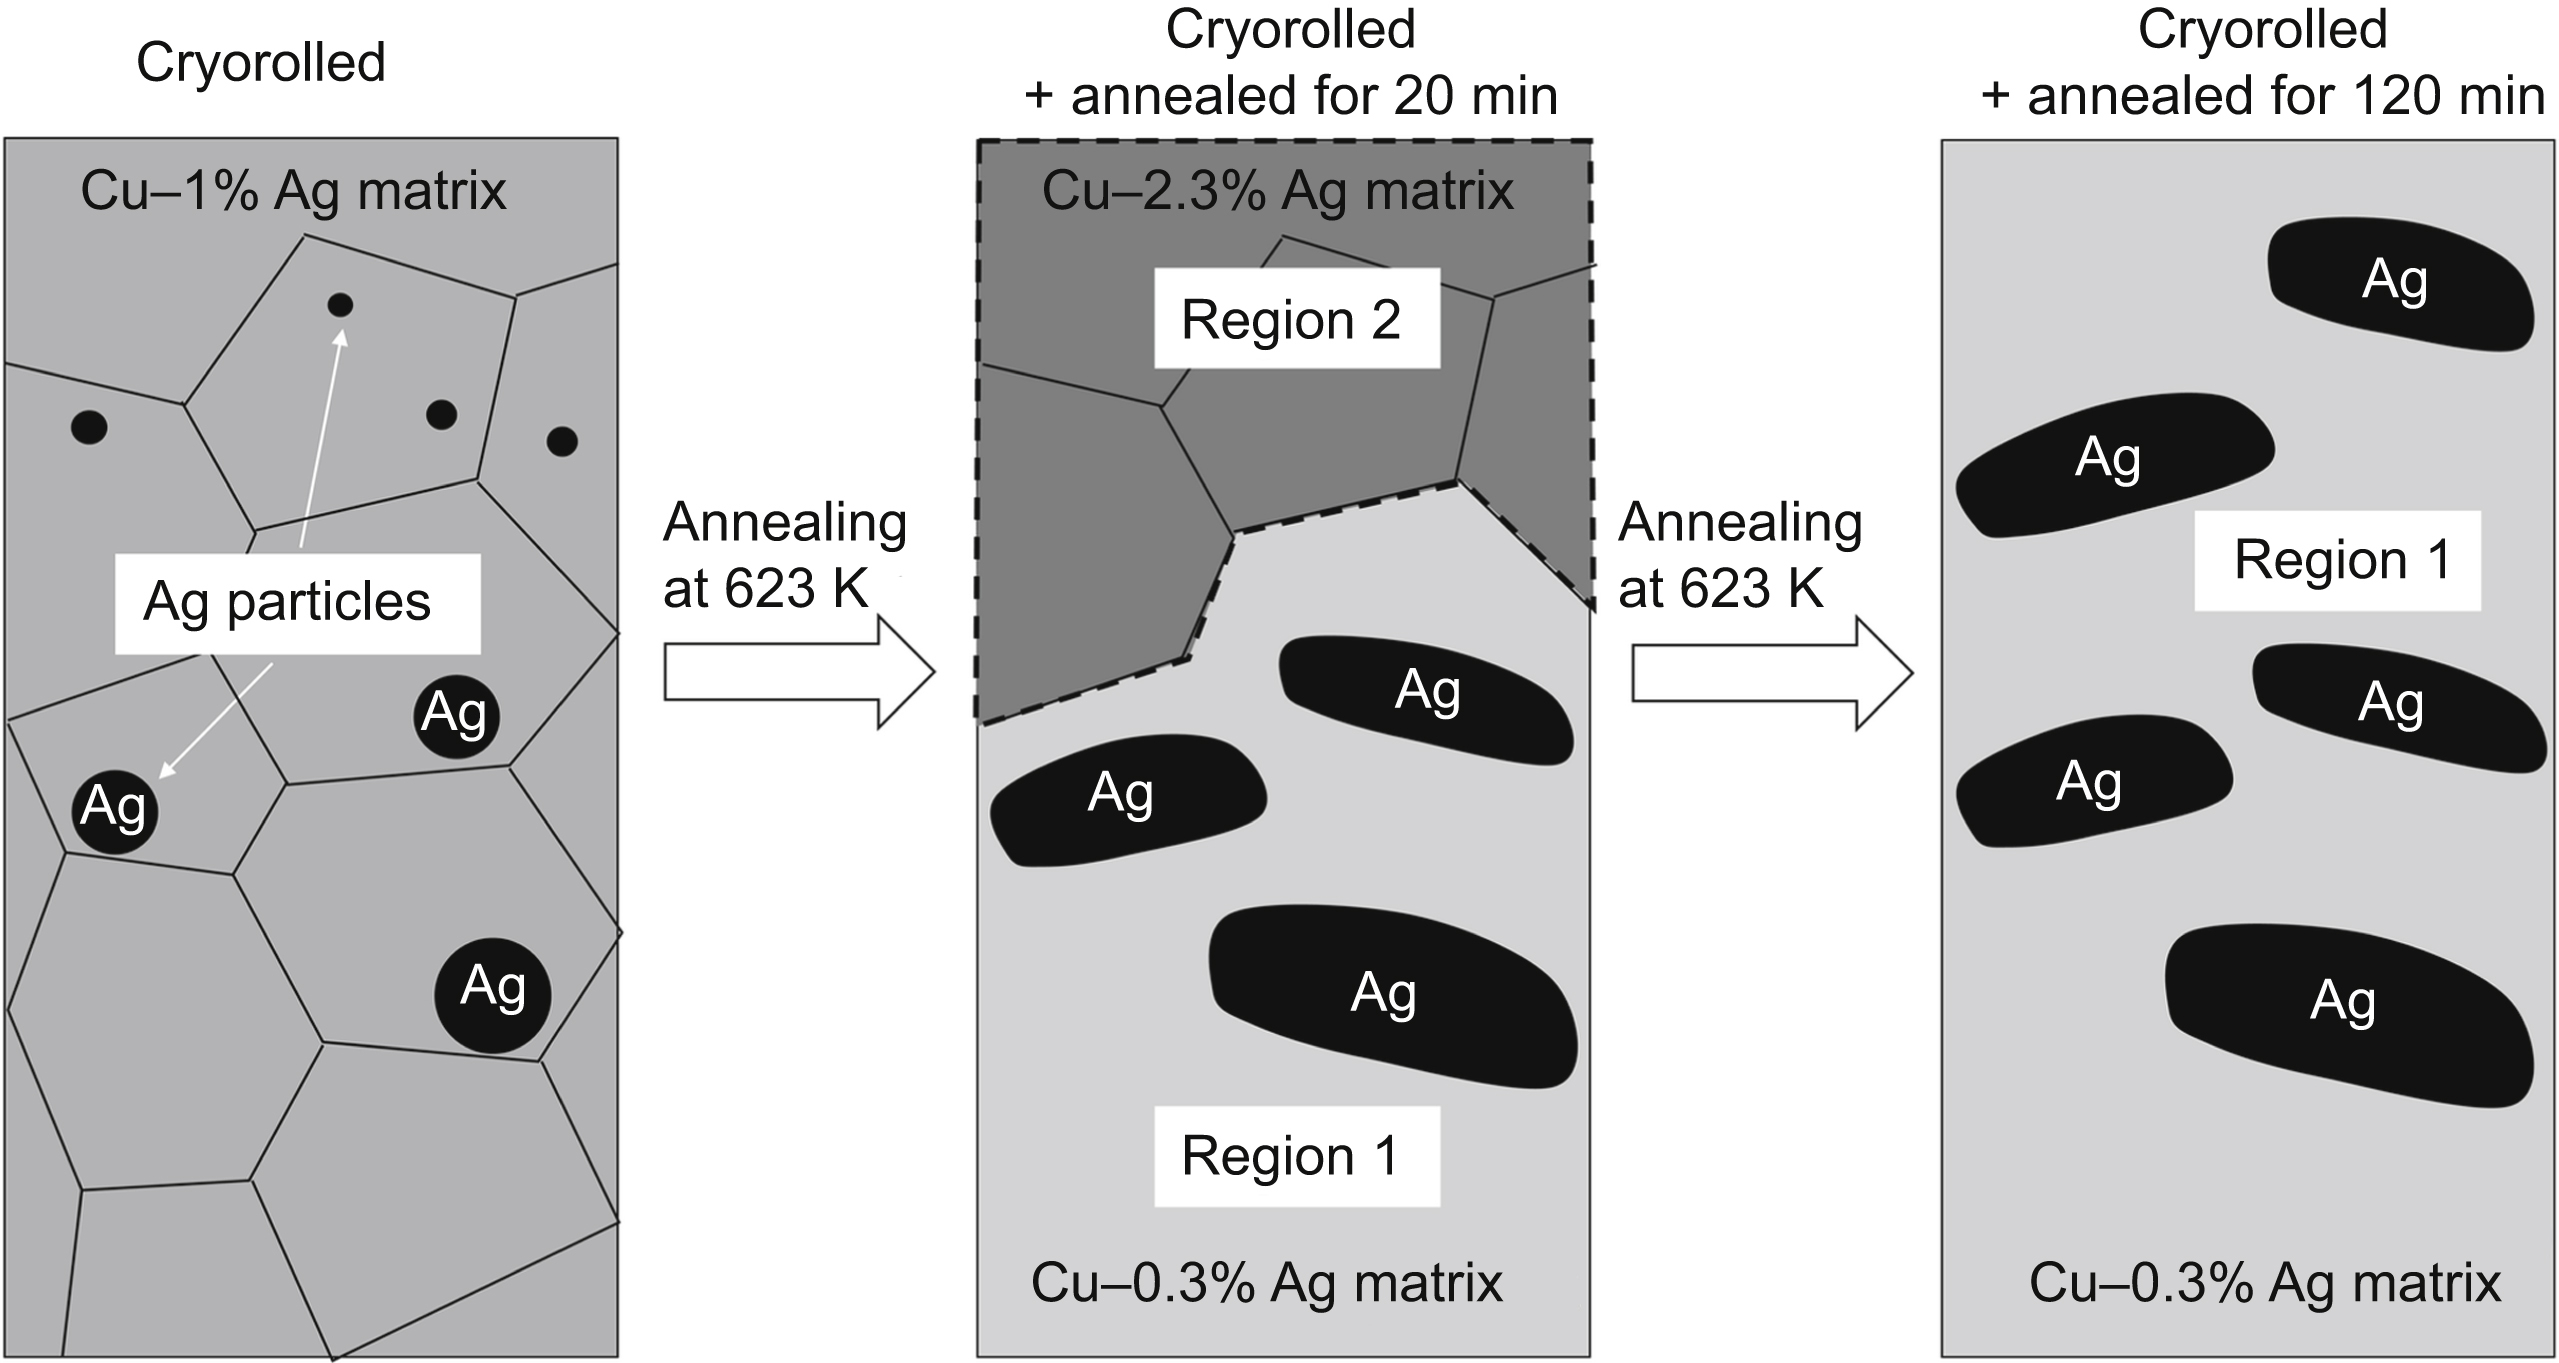
Figure 3.18 Schematic of the development of heterogeneous microstructure in cryorolled ultrafine-grained Cu–3 at.% Ag alloy during annealing at 623 K up to 120 min. The darker the gray in the matrix, the higher the solute Ag content.
Fig. 3.19 shows the solute Ag content in Regions 1 and 2, the relative fractions of these two matrix regions and their dislocation densities as a function of annealing time at 623 K for cryorolled UFG Cu–3 at.% Ag alloy [76]. In Region 2, the solute Ag content increased from ∼1 at.% to ∼2.6 at.% within 5 min annealing and it decreased slightly to ∼1.9 at.% with increasing annealing time up to 75 min (see Fig. 3.19a). For longer durations of heat treatment the solute Ag concentration in Region 2 was not determined due to the low volume fraction of this region (see below). In Region 1, the solute Ag concentration decreased to ∼0.3 at.% during the first 10 min of annealing and remained unchanged within the experimental error up to 120 min. This value agrees with the equilibrium Ag concentration in Cu at 623 K (0.33%) within the experimental error. The increase and the decrease of solute Ag concentration during annealing suggest the dissolution and the precipitation of Ag in Regions 2 and 1, respectively. In the cryorolled state, the relative X-ray intensity of the Ag phase is ∼8% which decreased to ∼5% after 5 min annealing and remained unchanged within the experimental error up to 30 min (Fig. 3.19b). This observation is in accordance with the dissolution of Ag precipitates in Region 2. In this period, the fractions of Regions 1 and 2 are ∼60% and ∼35%, respectively [76]. Between 30 and 120 min the fractions of Regions 1 and 2 increased and decreased, respectively. This indicates that precipitation occurred in Region 2 which reduced the solute Ag concentration to the equilibrium value (∼0.3 at.%). After 120 min annealing, the fraction of Region 2—where the dissolution of Ag had occurred in the beginning of the heat treatment—was practically zero. Concerning the relative intensity of the Ag phase, it increased gradually to ∼13% between 30 and 120 min in accordance with the reduction of the fraction of the matrix volume with high solute Ag content (Region 2).
Figure 3.19 The variation of (a) the solute Ag concentration, (b) the X-ray intensity fraction, and (c) the dislocation density for Regions 1 and 2 in the Cu matrix as a function of annealing time. The solid curves serve only as guide to eyes. Reprinted from J. Gubicza, Z. Hegedűs, J.L. Lábár, A. Kauffmann, J. Freudenberger, V. Subramanya Sarma, Solute redistribution during annealing of a cold rolled Cu–Ag alloy, Journal of Alloys and Compounds 623 (2015) 96–103 with permission from Elsevier.
The variation in the dislocation density in Regions 1 and 2 of the Cu matrix as a function of the annealing time is shown in Fig. 3.19c. In Region 1, the dislocation density decreased to ∼1 × 10¹⁴ m−2 during the first 30 min of annealing, then it remained unchanged within the experimental error up to 120 min [76]. In Region 2, the dislocation density decreased only to about half of the initial value (∼20 × 1014 m−2) due to the stronger pinning effect of the higher solute Ag concentration. Further annealing up to 75 min resulted in only a slight change in the dislocation density in Region 2. Between 75 and 120 min the dislocation density and the crystallite size in Region 2 were not determined since the fraction of this region was very low (<10%) for long annealing times (see Fig. 3.19b). The twin boundary probability in both regions of the heat-treated Cu matrix was found to be in the range of 0%–0.4% without any clear trend with the variation of annealing time. It is also worth to note that the route and the strain of SPD processing most probably influence the size and interface energy of Ag precipitates, i.e., SPD can be applied for interface engineering. Therefore, the functional properties (strength, ductility, conductivity, etc.) of Cu–Ag alloys can be tuned by an appropriate selection of the SPD-processing conditions, the chemical composition, as well as the time and temperature of annealing.
Finally, it is worth noting that HPT processing at RT yielded an elemental decomposition of supersaturated Al–30 wt.% Zn alloy [68]. Before HPT, the material was solution treated at 673 K for 1 h which resulted in a lamellar structure with varying Zn content inside the Al(Zn) grains due to spinodal decomposition. HPT processing destroyed this lamellar structure, leading to precipitation of Zn particles within the Al-rich grains. This elemental decomposition is facilitated by the rapid diffusion along lattice defects. In addition to decomposition, ∼3-nm thick Zn-rich layers were formed at Al–Al grain boundaries [103]. The fast diffusion along these layers caused grain boundary wetting, i.e., it strongly facilitates grain boundary sliding, thereby increasing the ductility of Al–Zn alloys during plastic deformation.
..................Content has been hidden....................
You can't read the all page of ebook, please click here login for view all page.