
Chapter 7
Correlation Between Defect Structure and Mechanical Properties of Nanocrystalline Materials
Abstract
The defect-related mechanical properties of nanomaterials are overviewed. The influence of small grain size on plastic deformation mechanisms, strength, and ductility is discussed. The smaller the grain size in face-centered cubic metals, the higher the activity of twinning at the expense of dislocation glide, while hexagonal close-packed (hcp) materials behave contrarily. The relationship between the dislocation structure and the yield strength is studied in details. Above the grain size of ∼20 nm, the decrease of grain size is accompanied by an increase of yield strength and a decrease of ductility. The loss of ductility can be moderated by the incorporation of coarse grains into the nanocrystalline matrix. A combination of large strength with good ductility can be achieved with nanograins containing high density of twin boundaries. Below the grain size of ∼20 nm, the yield strength is found to decrease with the reduction of grain size, referred to as inverse Hall–Petch effect. The possible explanations of this phenomenon are discussed in details. Contrary to coarse-grained materials, viscous dislocation drag cannot be observed during high strain rate deformation of nanomaterials, since the acceleration of dislocations to very high velocities is hindered by the relatively large dislocation density and the small grain size.
Keywords
Dislocation density; Ductility; Grain size; Inverse Hall–Petch behavior; Partial dislocation; Strain rate; Twinning; Yield strength
7.1. Effect of Grain Size on Deformation Mechanisms in fcc and hcp Nanomaterials
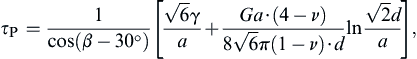
In conventional coarse-grained (CG) metallic materials, the deformation is mainly controlled by the motion of full lattice dislocations in the grain interiors. Grain boundaries act as obstacles against dislocation motion, therefore the dislocations formed at Frank–Read (FR) sources inside the grains are accumulated in pileups, e.g., at grain boundaries. The dislocations in pileups apply repulsive forces to successive dislocations emitted by the sources. As the grain size decreases, the sources are located closer to the grain boundaries; therefore the emission of dislocations from the FR sources becomes more difficult. Thus, for very small grain sizes (10–20 nm) dislocation pileups do not form and the dislocation sources are rather located in the grain boundaries. In this case, the dislocations emitted from a boundary travel throughout the grain and annihilated in the opposite boundary. Experiments and theoretical modeling revealed that when the grain size decreases below ∼10 nm, rather partial dislocations are emitted from grain boundaries instead of perfect lattice dislocations [1–7]. Nanostructured metals produced by severe plastic deformation (SPD) techniques often have nonequilibrium grain boundaries that contain excess dislocations (referred to as extrinsic or nongeometrically necessary or statistically stored dislocations) in addition to the geometrically necessary ones. Some dislocations may dissociate into pairs of Shockley partials, which could move away from the grain boundary under a stress. Such grain boundaries thus act as partial dislocation sources. However, partial dislocations can also be emitted from grain boundaries by atomic reshuffling [2]. The effect of grain size on the emission of partial dislocations from grain boundaries and the related deformation twinning has been studied for face-centered cubic (fcc) nanostructures on the model depicted in Figs. 7.1–7.3 [8,9]. The model assumes a grain with a square (111) slip plane, as shown in Fig. 7.1. Under an external shear stress τ, a leading Shockley partial dislocation with the Burgers vector b1 is emitted from the grain boundary XY. This leading partial dislocation consists of the three segments XE, EF, and FY in Fig. 7.1. τ is oriented at an angle β with line EF. The ends of this partial dislocation are pinned at the triple junctions X and Y, so that two segments of partial dislocation lines XE and FY are deposited on grain boundaries. Similarly, a trailing Shockley partial dislocation with the Burgers vector b2 is emitted from the grain boundary XY. This partial consists of the segments XC, CD, and DY. The two partial segments EF and CD are separated by a stacking fault (SF) ribbon. The two partials react to form two perfect edge dislocation segments XC and YD with the Burgers vector b = b1 + b2 at grain boundaries. The partial segments EF and CD would form a perfect screw dislocation with the Burgers vector b if they reacted. For the formation of a single leading partial, τ has to perform the work needed to increase both the area of the SF behind the partial and the length of the dislocation segments XE and FY. Using the formulas for the forces acting on the leading partial dislocation segment (see Chapter 4), the critical stress, τP for moving the leading partial XEFY can be derived as [9]

Figure 7.1 A schematic illustration of the model of a perfect screw dislocation emitted from grain boundary XY and dissociated into two partials in the slip plane (111). The stacking fault (SF) ribbon between the partials is indicated by color. After Y.T. Zhu, X.Z. Liao, X.L. Wu, Deformation twinning in nanocrystalline materials, Progress in Materials Science 57 (2012) 1–62 with permission from Elsevier.

Figure 7.2 A schematic illustration of the dislocation model for the nucleation of deformation twins. The stacking sequence of the (111) planes is indicated by the letters A, B, and C. SF, stacking fault. After Y.T. Zhu, X.Z. Liao, X.L. Wu, Deformation twinning in nanocrystalline materials, Progress in Materials Science 57 (2012) 1–62 with permission from Elsevier.
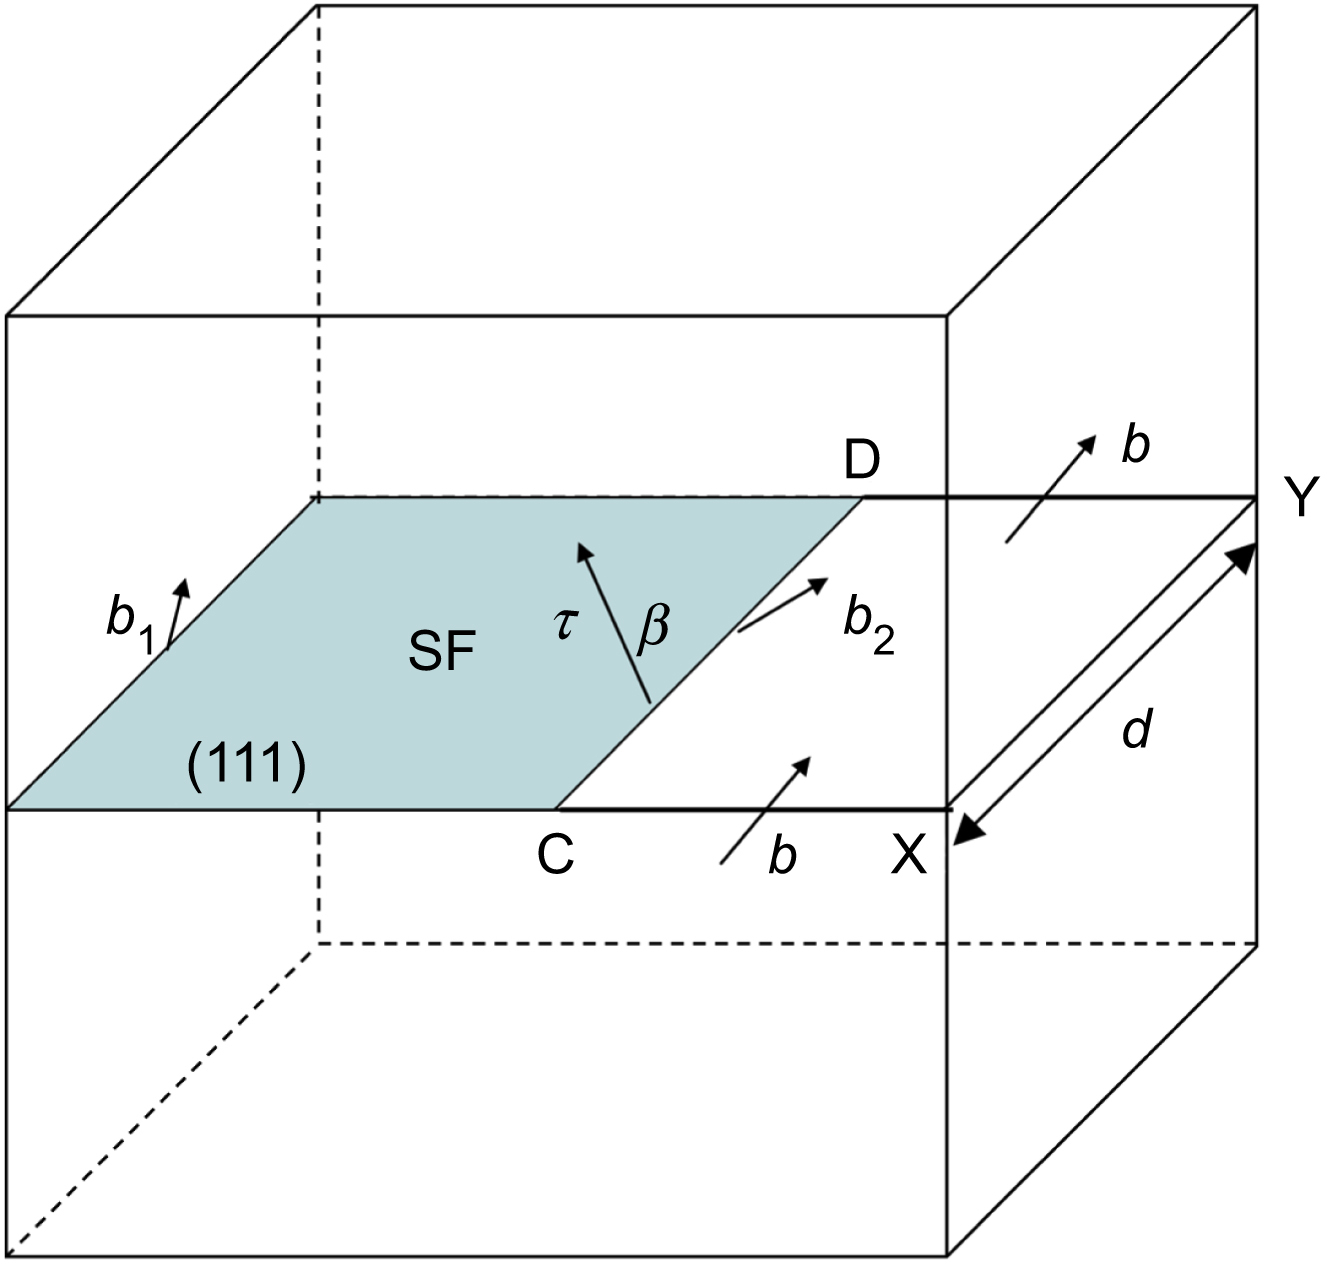
Figure 7.3 A schematic illustration of the emission of a trailing partial from grain boundary XY that partially removes the stacking fault formed previously by passing a leading partial. After Y.T. Zhu, X.Z. Liao, X.L. Wu, Deformation twinning in nanocrystalline materials, Progress in Materials Science 57 (2012) 1–62 with permission from Elsevier.
τP=1cos(β−30°)[√6γa+Ga·(4−ν)8√6π(1−ν)·dln√2da],
 (7.1)
(7.1)
where G is the shear modulus, a is the lattice parameter, ν is the Poisson's ratio, γ is the stacking fault energy (SFE), and d is the grain size.
The shear stress, τL, needed to move the leading and trailing partials together is equivalent to the stress for moving a full screw lattice dislocation. τL has to overcome the work needed to lengthen the lattice dislocation segments XC and YD, and can be obtained as [9]:
τL=Ga2√2π(1−ν)·dcosβln√2da.
 (7.2)
(7.2)
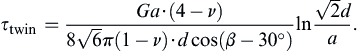
When τP < τL, the deformation is performed by gliding of partials. For instance, in Al for β = 135 degrees and below the grain size of 17 nm, τP is smaller than τL [8]. Moreover, the slipping of partial dislocations on adjacent planes may yield twin nucleation. After formation of an SF by slipping of a partial dislocation across the grain, a twin may nucleate via the emission of a second leading partial from the grain boundary on a plane adjacent to the SF (see Fig. 7.2). After slipping of the two partials on adjacent planes, the resulted stacking sequence is shown by letters A, B, and C in Fig. 7.2. The sequence of the (111) planes reveals that a thin twin lamella has been formed whose boundaries are also indicated in Fig. 7.2. The critical twin nucleation stress, τtwin can be expressed as [9]
τtwin=Ga·(4−ν)8√6π(1−ν)·dcos(β−30°)ln√2da.
 (7.3)
(7.3)
Another possible scenario is that after the slipping of the first leading partial across the grain, a trailing partial is emitted from the boundary XY that slips on the SF plane and erases the SF in its path as can be seen in Fig. 7.3. The trailing partial requires the following stress to move [9]:
τtrail=1cos(β+30°)[√6(8+ν)·Ga48π(1−ν)·dln√2da−√6γa].
 (7.4)
(7.4)
Once a twin is nucleated, it may grow via the emission of more twinning partials on the adjacent planes under stress τtwin. However, the twin may shrink via the emission of a trailing partial with the Burgers vector b2 on a plane adjacent to the twin boundary inside the twin (not in the parent grain). The stress needed to move a shrinking partial can be expressed as [9]
τshrink=1cos(β+30°)√6·(8+ν)·Ga48π(1−ν)·dln√2da.
![]() (7.5)
(7.5)
As an example, Fig. 7.4 shows the grain size dependence of the stresses τP, τL, τtwin, τtrail, and τshrink for nanocrystalline Al. The stresses are calculated using G = 26 GPa, a = 0.405 nm, ν = 0.34, γ = 166 mJ/m2, and β = 30 degrees. The point M in Fig. 7.4 represents the critical grain size (dC ≈ 4.7 nm) below which a deformation twin nucleates because τtwin < τtrail. However, when a deformation twin nucleates by partial dislocation slipping on a plane (111), an initial SF is needed on the adjacent plane. Fig. 7.4 shows that at the critical grain size ∼4.7 nm τL < τP; therefore the stress corresponds to the point N yields the operation of full lattice dislocation but it is not enough for the emission of partial dislocation from grain boundary that is necessary for the formation of the initial SF. At the same time, for the values of τL at point N and dC, the splitting distance between partials in a lattice dislocation (the SF width) reaches the grain size [8]. This means that the SF ribbon of a dissociated full dislocation spreads across the grain and this will serve as an initial SF for the nucleation of a deformation twin. It should be emphasized that although the twin nucleation at the critical grain size dC requires a high stress corresponding to point N, the nucleated twin can grow under a much smaller stress corresponding to point M in Fig. 7.4 [9]. It is noted that the grain size dependence of the stresses τP, τL, τtwin, τtrail, and τshrink is strongly influenced by their orientation to the possible slip systems, i.e., by β, therefore the deformation mechanism may change from grain to grain in a nanocrystalline material. Experiments also show that the operation of partial dislocations may produce deformation twins, even in nanostructured aluminum having high SFE [3–5], which in its CG state never deforms by twinning except at crack tips. For materials with lower SFE, the critical grain size and the stress required for twinning are increased and decreased, respectively. For instance, while in the case of Al the critical grain size and the stress for twin nucleation are ∼5 nm and ∼1000 MPa, respectively, these values for Cu are 46 nm and 370 MPa, respectively [9].
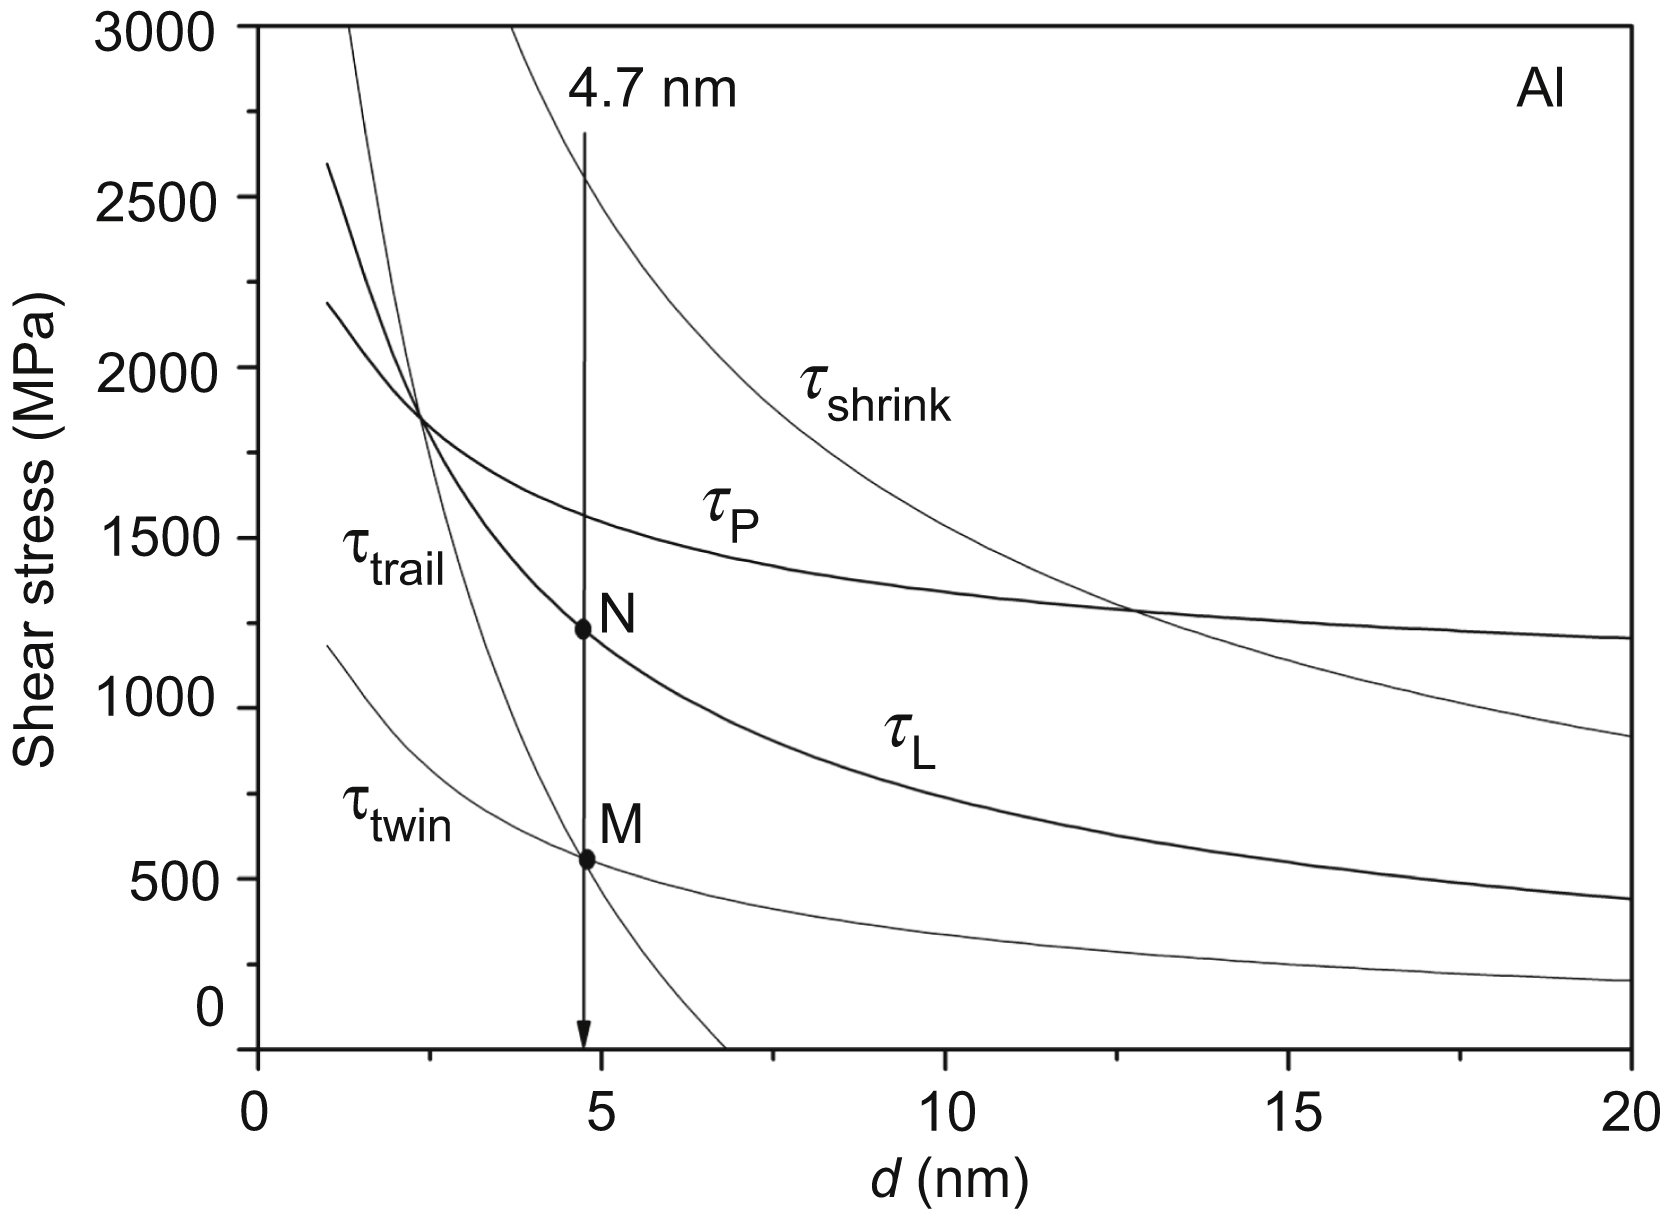
Figure 7.4 The shear stresses τP, τL, τtwin, τtrail, and τshrink as a function of the grain size, d, for nanocrystalline Al. The angle between the stress direction and the line of slipping dislocations is β = 30 degrees.
The probability of twinning in hexagonal close-packed (hcp) structures decreases with decreasing grain size [10] that can be explained by the stress dependence of deformation mechanisms. In an hcp metal, the strain along the basal plane is resulted by the easy glide of dislocations with 〈a〉 -type Burgers vectors. At the same time, the deformation in the direction of the crystallographic c-axis may be performed by glide of dislocations with 〈c+a〉
 -type Burgers vectors or by twinning (both processes operate mainly on pyramidal planes). The most frequently observed twinning planes and directions are {10.1}〈10.ˉ2〉
 and {11.2}〈11.ˉ3〉
 (compressive twins), and {10.2}〈10.1〉
 and {11.1}〈ˉ1ˉ1.6〉
 (tensile twins). The generation and propagation of 〈c+a〉 dislocations is difficult due to their large Burgers vectors. However, an elevated deformation temperature and/or high stresses increase the activation of pyramidal 〈c+a〉 dislocations at the expense of twin formation. In deformed hcp metals with smaller grain size, the stresses are higher mainly in the vicinity of grain boundaries [11] that facilitate the operation of 〈c+a〉 dislocations in addition to 〈a〉 dislocations, thereby reducing the occurrence of twinning. It is noted that deformation twins are observed in nanocrystalline Mg—10 at.% Ti alloy with an average grain size of 33 nm processed by mechanical attrition. The formation of deformation twins is attributed to the alloying effect, which may change the energy path for twinning [12].
As the grain boundary fraction in nanomaterials increases, the relative importance of deformation mechanisms occurring at grain boundaries increases. One example for these deformation mechanisms is grain boundary sliding which is controlled by grain boundary diffusion. Grain boundary diffusion is much faster than crystal lattice diffusion inside grains, since the activation energy of the former process is about half of that for the latter mechanism. However, in CG materials (d > 10 μm) the contribution of grain boundary diffusion to plastic deformation (Coble creep) is marginal due to the small volume fraction of grain boundaries. For these materials, lattice diffusion inside grains is fast enough for controlling plastic deformation (Nabarro–Herring creep) only at temperatures above 0.5 × Tm, where Tm is the absolute melting temperature. At the same time, in nanomaterials, grain boundary sliding by Coble creep may operate even at room temperature (RT) as very high fraction of atoms are located in the vicinity of grain boundaries. Fig. 7.5 shows the Ashby–Verrall model of grain boundary sliding [13,14]. The grains are sliding at their boundaries due to the external tensile stress. The sliding of the grains without any change of their shape would yield voids between them, therefore the integrity of the material is sustained by a complementary diffusion in the vicinity of the grain boundaries as it is shown at the bottom part of Fig. 7.5. The combination of sliding and diffusion yields a strain of 0.55 in this model. For metallic materials with large melting points grain boundary sliding may contribute to plasticity at RT even if the grain size is only in the ultrafine-grained (UFG) regime, i.e., between 100 nm and 1 μm. For instance, atomic force microscopy (AFM) study shows rumpling on the surface around a Vickers pattern in pure Al processed by equal-channel angular pressing (ECAP) and having a grain size of about 1 μm [15,16]. The quantitative evaluation of the AFM measurements reveals that adjacent grains may slide up to ∼30 nm over each other and the contribution of grain boundary sliding to the total strain is about ∼70% during indentation of the ECAP-processed Al sample. Other experimental investigations [17–19] and three-dimensional molecular dynamics computer simulations [20,21] also suggest the occurrence of grain boundary sliding as a viable deformation process in nanocrystalline solids at low temperatures. In addition to grain boundary sliding, other boundary-related deformation mechanism, such as grain rotation is also observed in nanomaterials [22]. During this process, nanosized grains rotate in a manner that brings their orientations closer together. The disappearance of the boundary between these grains provides a path for more extended dislocation motion [23].

Figure 7.5 Schematic illustration of the Ashby–Verrall model for grain boundary sliding. The arrows in the grains indicate the sliding directions along the grain boundaries. At the bottom of the figure, the arrows show the directions of diffusion in the vicinity of grain boundaries that yields the change of the grain shape as a complementary process in addition to grain boundary sliding.
7.2. Breakdown of Hall–Petch Behavior in Nanomaterials
Considering the grain boundary strengthening in polycrystalline CG metallic materials, the yield strength is usually correlated to the grain size by applying the Hall–Petch equation [24–26]. In a grain of a polycrystal, the plastic deformation sets in when the resolved shear stress in one or more slip systems reaches the critical value necessary for the initiation of dislocation glide. In a polycrystalline material, the grains have different crystallographic orientations relative to the direction of the external load, therefore the resolved shear stresses acting on the various slip systems also change from grain to grain. In the grains with favorable orientations (i.e., having slip systems with large Schmid factors), the resolved shear stresses are high and the plastic deformation starts by the activation of one or more slip systems. In unfavorably oriented grains, the shear stresses are not enough to initiate dislocation glide, therefore these grains deform only elastically. In the plastically deformed grains, dislocations are formed at the (FR) sources, and these dislocations are accumulated in pileups at the grain boundaries as depicted for grain A in Fig. 7.6. The elastic stresses of dislocations in the pileups are added to the shear stresses caused by the external load, thereby assisting the initiation of plastic deformation in the adjacent, elastically deformed grain having unfavorable orientation relative to the applied force (grain B in Fig. 7.6). The macroscopic plastic deformation sets in when all grains start to deform plastically. As the repulsive force between dislocations in pileups is inversely proportional to dislocation spacing, the smaller the grain size, the lower the number of dislocations in the pile-ups. As a consequence, when the grain size is reduced, the contribution of the stress field of dislocations to the initiation of plasticity in the adjacent grain is smaller; therefore larger applied stress is necessary for yielding the material, i.e., the yield strength will be higher. Thus, there is an inverse relationship between grain size and yield strength, as demonstrated by the Hall–Petch equation [24–26]:

Figure 7.6 Two grains A and B with the size d in a polycrystalline material loaded by a tensile stress σ. The dashed lines represent the slip planes. In grain A, the plastic deformation has already been initiated by the external stress and a Frank–Read (FR) source emits dislocations that are gliding due to the shear stress τ. The stress field of the dislocations accumulated at the boundary in grain A assists the activation of FR sources in the unfavorable oriented grain B.
σY=σ0+kY·d−1/2,
![]() (7.6)
(7.6)
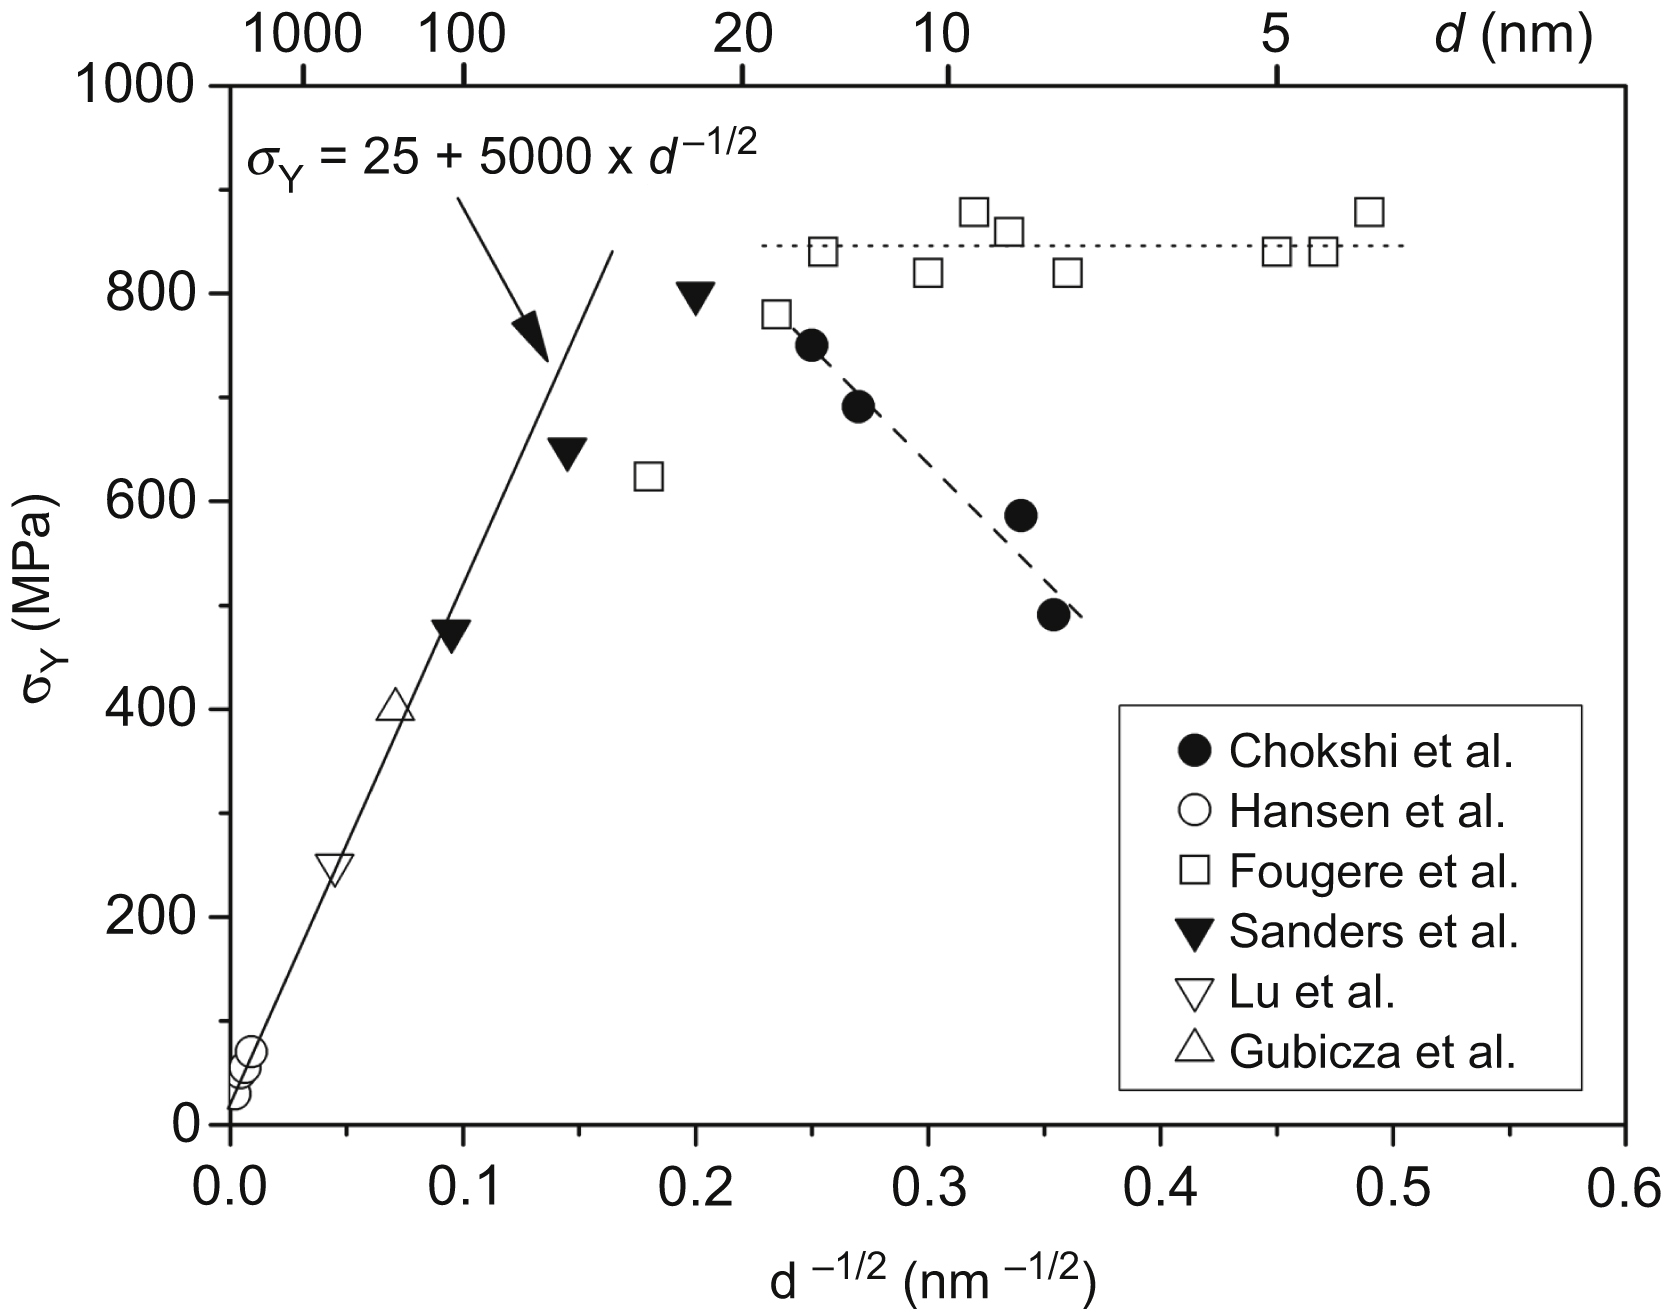
where σY is the yield strength, σ0 is the friction stress, kY is the strengthening coefficient (a constant unique to each material), and d is the average grain diameter. For instance, the values of σ0 and kY are ∼25 MPa and ∼5000 MPa nm1/2, respectively, for Cu [26] as illustrated in Fig. 7.7.
When the grain size is reduced to the range 20–100 nm, the yield strength further increases with decreasing grain size but the slope kY continuously decreases (see Fig. 7.7) [23]. This deviation from the conventional Hall–Petch behavior can be attributed to the grain size dependence of the stress (τ) required to operate an FR source [32,33]. If an edge dislocation segment pinned at its ends is considered as an FR source inside a grain and ν = 0.33 is chosen for the Poisson's ratio, the stress τ versus the length of the segment L can be given as
τ=0.12GbL[ln(Lb)−1.653],
![]() (7.7)
(7.7)
where b is the magnitude of the Burgers vector and G is the shear modulus [33]. τ as a function of L−1/2 for Cu is plotted in Fig. 7.8. When the length of the dislocation segment is large, the stress needed for the operation of a source increases more or less linearly with L−1/2. However, when the length of an FR source is reduced below 10–15 nm, the slope of τ versus L−1/2 plot decreases. Moreover, if L is smaller than 4 nm in Cu, the stress required for the operation of an FR source decreases with the reduction of its length. In materials with grain sizes between 20 and 100 nm, a considerable fraction of FR sources may have smaller lengths than 10–15 nm that can explain the deviation from the conventional Hall–Petch behavior. Additionally, the strong reduction of the numbers of dislocations in pileups with decreasing grain size yields a decrease of the exponent of d in Eq. (7.6) from −1/2 to −1 which may cause the observed reduction of kY in the Hall–Petch plot [16]. The value of −1 for the Hall–Petch exponent is also predicted by the model in which two dislocations locate within one grain with the distance of d/3 between them, where d is the grain diameter [34].
As the grain size decreases to 10–20 nm, the number of dislocations in pileups is eventually reduced to one and thus the pileup mechanism breaks down [23]. As a consequence, the assisting effect of the stress field of dislocation pileups on the initiation of plastic deformation is lost and the Hall–Petch equation is not valid. In this grain size regime, if dislocations contribute to plasticity, they are emitted from grain boundaries, then travel through the grains with a small chance of interaction with other dislocations, and finally annihilate at the opposing boundaries. Below 10–20 nm, the experimental results do not show a clear trend in the grain size dependence of the yield strength. In some cases, the yield strength is found to decrease with the reduction of grain size while in other cases only a plateau is observed (see Fig. 7.7). When the yield strength decreases with decreasing grain size, the Hall–Petch plot remains more or less linear even below the grain size of 10–20 nm but with a negative slope; therefore this behavior is termed as negative or inverse Hall–Petch behavior. This effect is usually attributed to the dominance of deformation mechanisms occurring in the grain boundaries as the reduced grain size is accompanied by the increase of grain boundary fraction. Such a mechanism is grain boundary sliding that may occur by grain boundary diffusion controlled Coble creep [35]. In this case, the stress (σ) required for yielding at a strain rate of ˙ε can be given by the following formula [23]:

Figure 7.8 The stress (τ) required for the operation of a Frank–Read source versus the length (L) of the edge dislocation segment between the pinning points of the source in Cu.
σ=πkT˙ε150ΩδDGBd3,
![]() (7.8)
(7.8)
where k is the Boltzmann's constant, T is the absolute temperature, Ω is the atomic volume, δ is the grain boundary width, and DGB is the grain boundary diffusion coefficient. Assuming Ω = 1.3 × 10⁻²⁹ m3, δ = 1 nm, DGB = 4.7 × 10⁻²⁰ m2/s at RT, and ˙ε=10−4 for Cu with d = 20 nm, the stress required for Coble creep is 112 MPa as obtained from Eq. (7.8), which is much less than the calculated stress needed for dislocation glide (∼800–900 MPa). The easy occurrence of Coble creep suggests its significant contribution to plasticity at RT for grain sizes less than 20 nm. Moreover, Eq. (7.8) predicts that when the grain boundary sliding becomes the main deformation mechanism, the yield strength will decrease with decreasing grain size, which corresponds to a considerable fraction of experimental results. However, Coble creep cannot be the sole deformation mechanism in the inverse Hall–Petch behavior as the experimental yield strength values do not fall so steeply with decreasing grain size as the trend, σ ∼ d3, predicted by Eq. (7.8) [36]. For instance, for inert gas–condensed Cu the inverse Hall–Petch effect was described as
σY=A−k′·d−1/2,
![]() (7.9)
(7.9)
where A ≈ 1290 MPa and k′ ≈ 2170 MPa nm1/2 [27]. Most probably, intragranular dislocation motion as a complementary deformation mechanism also occurs to sustain the integrity of the material as the sliding of grains without changing their shape would yield voids between them. It should be also noted that the voids, micro- or nanocracks, and poorly bonded interfaces in nanomaterials processed by powder consolidation (e.g., inert gas condensation) may also yield a similar strength degradation as the inverse Hall–Petch behavior [23]. Although, the experimental results obtained on different nanomaterials do not prove convincingly the general existence of the inverse Hall–Petch effect, molecular dynamic simulations predicts this behavior for very small grain sizes [37]. It is noted, however, that the results of molecular dynamic simulations are valid only for very high strain rates (108–109 s−1). Moreover, the change of the deformation mechanism inside the grains when their sizes decrease below ∼20 nm may also contribute to the inverse Hall–Petch behavior. This is illustrated in Fig. 7.9, where the shear stresses required for the emission of full lattice (τL), leading partial (τP), trailing partial (τtrail), twinning partial (τtwin), and shrinking partial (τshrink) dislocations from grain boundaries are plotted as a function of grain size in Cu. These stresses are calculated according to Eqs. (7.1)–(7.5) with assuming G = 47 GPa, a = 0.361 nm, ν = 0.34, γ = 62 mJ/m2, and β = 30 degrees. It seems that below ∼30 nm, twinning becomes a considerable deformation mechanism. For twin nucleation, first an initial SF should be formed at the stress corresponding to point N. Then, twinning occurs at the stress corresponding to point M that is much lower than that at point N. When the grain size falls below ∼20 nm (point L in Fig. 7.9), partial dislocations are emitted from the grain boundaries instead of full dislocations since the former mechanism requires smaller stress. In nanocrystalline materials, the grains have a size distribution. By decreasing the average grain size, more and more grains in the distribution become so small that their interiors deform rather by twinning which requires smaller stress than for dislocation glide in the large nanograins. Therefore, the macroscopic yield strength decreases with decreasing the average grain size in accordance with the inverse Hall–Petch behavior.

It is worth to note that the inverse Hall–Petch behavior depends on the strain rate if the reason of this behavior is the enhanced grain boundary sliding. For large strain rates, the role of this mechanism in plasticity is reduced, and dislocation gliding in grain interiors becomes dominant. In this case, softening is not observed with decreasing grain size. It should be also noted that for pure metals with low melting point (e.g., Al, Pb, Sn, or In), grain boundary sliding may yield softening at RT even if the grain size is refined only into the UFG regime [38]. In these materials, grain sizes of several hundreds of nanometers are enough for the dominance of grain boundary sliding at low strain rates. Fig. 7.10 shows the decrease in hardness at RT due to grain refinement in Pb, Sn, and In processed by high-pressure torsion (HPT). If deformation after HPT is carried out at high strain rates, most probably hardening can be observed for these materials. A decrease of hardness at RT due to grain refinement by SPD was also detected in Al–30 wt.% Zn alloy [39]. SPD was carried out by HPT at RT. Before HPT, the material was a supersaturated solid solution where the Zn concentration inside the Al(Zn) grains varied due to spinodal decomposition [40]. This lamellar structure in the coarse grains led to high hardness. HPT destroyed this lamellar structure and yielded an elemental decomposition of supersaturated Al–30 wt.% Zn alloy. Therefore, a refinement of Al(Zn) grains to about 300 nm and a precipitation of Zn particles occurred simultaneously. In addition, ∼3-nm thick Zn-rich layers were formed in Al–Al grain boundaries [41]. The deterioration of the fine lamellar structure and the grain boundary wetting caused softening in the HPT-processed Al–30 wt.% Zn alloy. For Zn concentration smaller than 10 wt.%, this softening was not observed [39].

Figure 7.10 Hardness of coarse-grained and ultrafine-grained (UFG) Pb, Sn, and In versus the homologous temperature, T/Tm (Tm is the melting point). The arrows indicate softening at RT due to grain refinement achieved by high-pressure torsion (HPT) processing. The data were taken from K. Edalati, Z. Horita, Significance of homologous temperature in softening behavior and grain size of pure metals processed by high-pressure torsion, Materials Science and Engineering A 528 (2011) 7514–7523.
7.3. Correlation Between Dislocation Structure and Yield Strength of Ultrafine-Grained fcc Metals and Alloys Processed by Severe Plastic Deformation
For UFG fcc metals processed by ECAP the dislocation density and the yield strength show similar developments as a function of strain and both quantities saturate approximately at the same strain [16,42]. This suggests that it is worthwhile studying the relationship between these quantities. The dislocation density determined by X-ray line profile analysis and the corresponding yield strength measured by mechanical tests for different fcc metals and alloys are listed in Table 7.1. The relationship between the dislocation density (ρ) and yield strength (σY) for plastically deformed metals is generally characterized by the Taylor equation:
σY=σ0+αMTGbρ12,
![]() (7.10)
(7.10)
where σ0 is the friction stress, α is a constant depending on the arrangement of dislocations, and MT is the Taylor factor. Since the value of αMT is of the order of 1, it is possible to check the validity of Eq. (7.10) by plotting the value of (σY − σ0) against the product of Gbρ1/2 for different fcc metals and solid solution alloys processed by SPD, as shown in Fig. 7.11. The good correlation between these two quantities in Fig. 7.11 demonstrates that in UFG fcc metals and solid solutions processed by SPD the yield strength is essentially determined by the interactions between dislocations. This observation can be explained by the fact that in materials processed by SPD at low homologous temperatures, the grain refinement occurs mainly by the arrangement of dislocations into subgrain boundaries and/or dislocation walls. Consequently, large fraction of boundaries consists of dislocations and the effect of subgrain/grain boundaries on dislocation motion can be regarded as the interaction between dislocations [43]. Concerning the solid solution strengthening, the solute atoms may increase the strength in two ways: (1) directly by pinning the dislocations and impeding their motion in a solute–dislocation interaction and (2) indirectly by hindering the annihilation of dislocations during deformation, leading to an increase in the dislocation density in a dislocation–dislocation interaction. The direct and indirect effects of solute atoms are taken into account in the friction stress, σ0, and the dislocation term in the Taylor equation. For severely deformed metals where the dislocation density is relatively high, the latter term is dominant so that the hardening effect of the solute atoms is manifested basically in the higher dislocation density.
Table 7.1
The dislocation density (ρ) determined by X-ray line profile analysis and the yield strength (σY) at room temperature (RT) for face-centered cubic (fcc) metals and alloys processed by severe plastic deformation
| Material | Processing method | ρ (1014 m−2) | σY (MPa) | σ0 (MPa) | G (GPa) | b (nm) | α | References |
| Pure metals | ||||||||
| Al | 1 ECAP at RT | 1.9 | 95 | 20 | 26 | 0.286 | 0.24 | [44] |
| Al | 2 ECAP at RT | 2.1 | 110 | 20 | 26 | 0.286 | 0.27 | [44] |
| Al | 4 ECAP at RT | 1.9 | 120 | 20 | 26 | 0.286 | 0.32 | [44] |
| Al | 8 ECAP at RT | 1.8 | 120 | 20 | 26 | 0.286 | 0.33 | [44] |
| Cu | 1 ECAP at RT | 15 | 294 | 35 | 47 | 0.256 | 0.18 | [31] |
| Cu | 3 ECAP at RT | 21 | 386 | 35 | 47 | 0.256 | 0.21 | [31] |
| Cu | 5 ECAP at RT | 21 | 394 | 35 | 47 | 0.256 | 0.21 | [31] |
| Cu | 10 ECAP at RT | 20 | 412 | 35 | 47 | 0.256 | 0.23 | [31] |
| Cu | 15 ECAP at RT | 15 | 404 | 35 | 47 | 0.256 | 0.26 | [31] |
| Cu | 25 ECAP at RT | 15 | 402 | 35 | 47 | 0.256 | 0.26 | [31] |
| Cu | 25 HPT at RT | 37 | 563 | 35 | 47 | 0.256 | 0.24 | [45] |
| Au | 4 ECAP at RT | 17 | 245 | 27 | 27 | 0.288 | 0.22 | [46] |
| Ni | 6 ECAP | 18 | 730 | 60 | 82 | 0.249 | 0.25 | [46] |
| Ni | 8 ECAP +5 HPT at RT | 25 | 1103 | 60 | 82 | 0.249 | 0.33 | [44] |
| Ag | 8 ECAP at RT | 46 | 330 | 29 | 30 | 0.289 | 0.17 | [46] |
| Solid solution alloys | ||||||||
| Al–1Mg | 8 ECAP at RT | 3.9 | 220 | 25 | 26 | 0.286 | 0.43 | [44] |
| Al–3Mg | 1 ECAP at RT | 12 | 250 | 50 | 26 | 0.286 | 0.25 | [44] |
| Al–3Mg | 8 ECAP at RT | 23 | 400 | 50 | 26 | 0.286 | 0.32 | [44] |
| Cu–10% Zn | 5 HPT at RT | 34 | 773 | 35 | 46 | 0.256 | 0.35 | [47] |
| Cu–30% Zn | 5 HPT at RT | 81 | 987 | 44 | 41 | 0.256 | 0.33 | [47] |
| Dispersion-strengthened alloys | ||||||||
| Al 6082 | 1 ECAP at RT | 4.0 | 193 | 25 | 26 | 0.286 | – | [44] |
| Al 6082 | 4 ECAP at RT | 5.0 | 246 | 25 | 26 | 0.286 | – | [44] |
| Al 6082 | 8 ECAP at RT | 5.4 | 265 | 25 | 26 | 0.286 | – | [44] |
| Al–4.8Zn–1.2Mg–0.14Zr | 8 ECAP at 200 °C | 3.2 | 290 | 20 | 26 | 0.286 | – | [48] |
| Al–5.7Zn–1.9Mg–0.35Cu | 8 ECAP at 200 °C | 3.4 | 380 | 20 | 26 | 0.286 | – | [48] |
| Al–5.9Mg–0.3Sc–0.18Zr | 15 HPT at RT | 24 | 750 | 20 | 26 | 0.286 | – | [48] |
| Cu–0.18% Zr | 8 ECAP at RT | 39 | 416 | 35 | 47 | 0.256 | – | [48] |

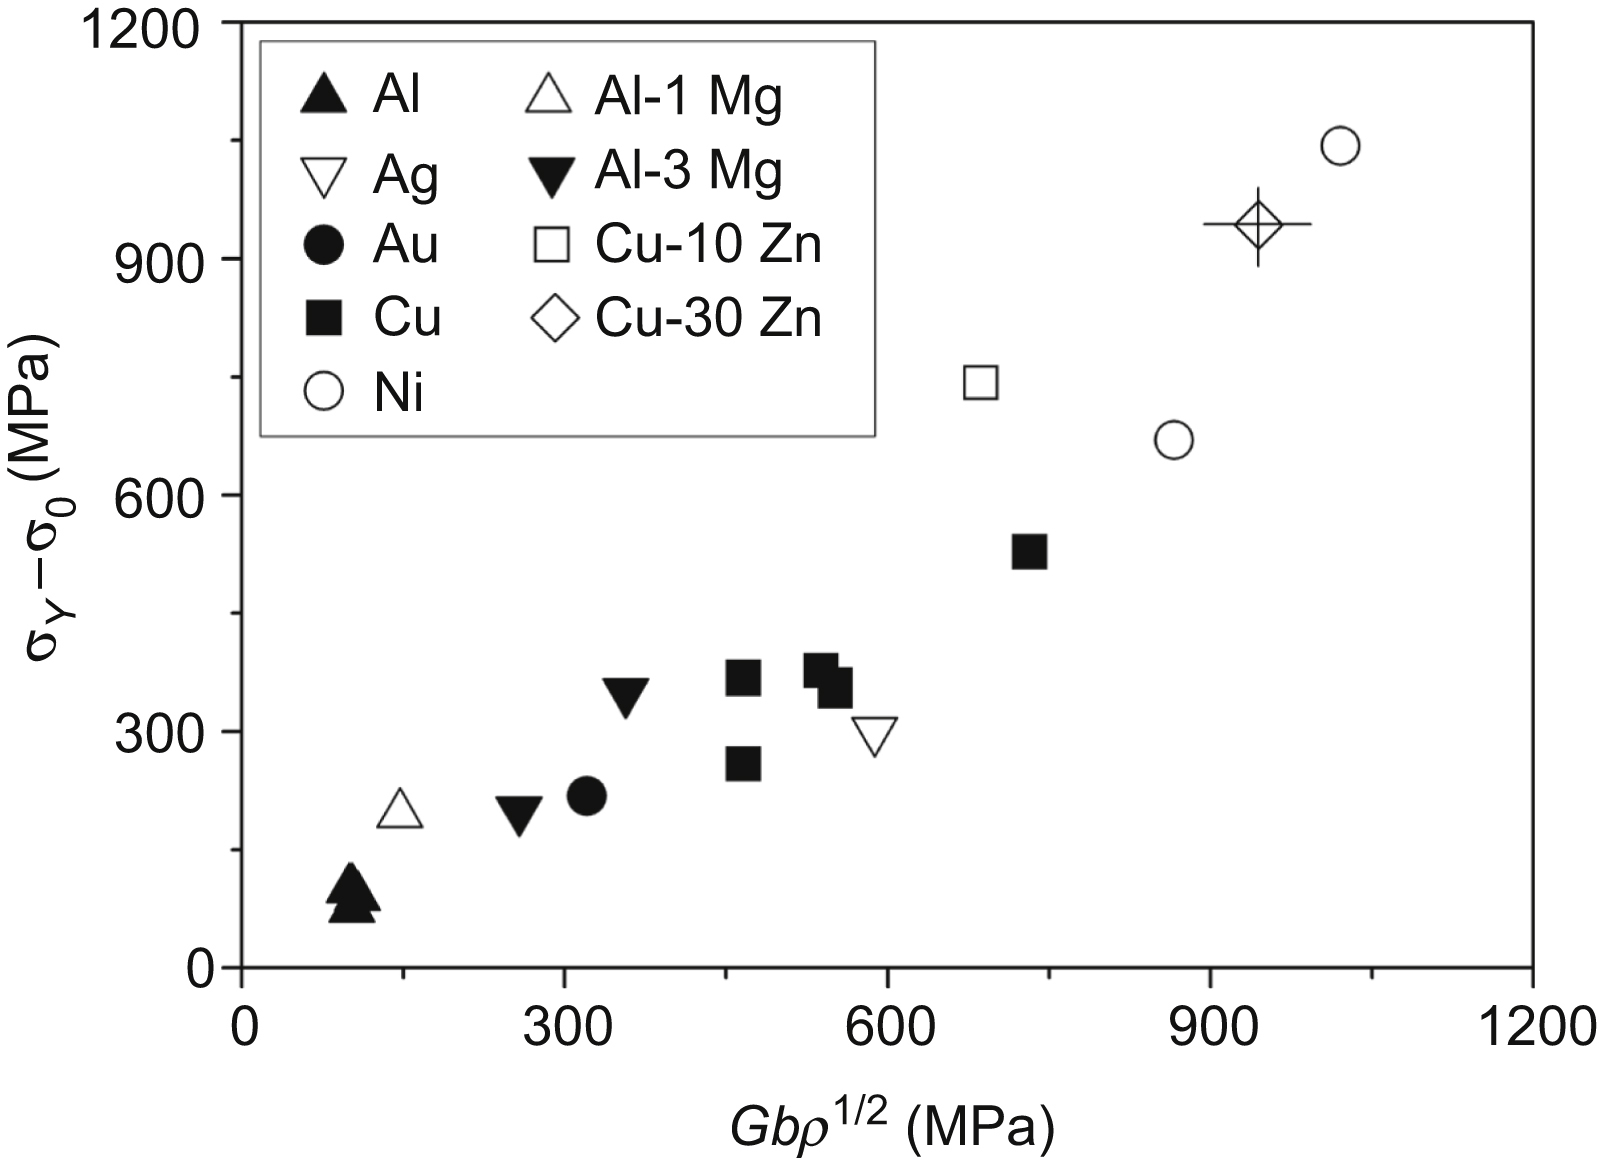
Figure 7.11 The yield strength at room temperature (RT) reduced by the friction stress (σY − σ0) versus the product of Gbρ1/2 for different fcc metals and alloys processed by SPD. The errors on the individual datum points are indicated by solid horizontal and vertical lines at the symbol diamond. ρ, dislocation density; b, Burgers vector; G, shear modulus.
The scattering of the datum points in Fig. 7.11 is attributed to the difference between the values of α for the different metals. Therefore, the values of α in Table 7.1 are calculated from Eq. (7.10) by using the experimental values of σY and ρ. In this calculation, the Taylor factor is estimated by the value characteristic for a random crystallographic orientation (3.06) as weak textures in fcc metals after SPD, if any, yield only a deviation less than 3% from this value of MT [46]. Most of the values of α are between 0.17 and 0.35, and this range is similar than that observed for CG materials. In practice, the value of α depends upon the arrangement of dislocations in the material [49,50]. For example, calculations have shown that the value of α increases from ∼0.15 to ∼0.37 when dislocation clustering increases and the dislocation structure evolves from a uniform random distribution through thick cell walls to sharp boundaries [49]. The dissociation of lattice dislocations into partials in fcc metals has a strong effect on the arrangement of dislocations. In the formation of dense dislocation structures, as in walls or subgrain boundaries, an important role is played by cross-slip and climb. Thus, the higher the degree of dissociation, the more difficult the occurrence of cross-slip and climb. The degree of dislocation dissociation is characterized by the equilibrium splitting distance (dp) between the partial dislocations, which can be determined from the shear modulus, the Burgers vector, and the SFE using Eq. (4.3) given in Chapter 4. The values of dp are listed in Table 4.1 of Chapter 4 for edge and screw dislocations in pure fcc metals. The values of α obtained for pure fcc metals processed by ECAP at RT till the saturation of the dislocation density are plotted in Fig. 7.12 as a function of the arithmetic average of splitting distances for edge and screw dislocations in Burgers vector unit, dp/b. The higher the value of dp/b, the higher the degree of dislocation dissociation which impedes the clustering of dislocations inside the grains resulting in a relatively low value of α. It should be noted that, beside the interaction between dislocations, the relatively high twin boundary frequency in Ag (see Chapter 4) is expected to make an additional contribution to the strength. However, if this hardening effect is taken into account, the Taylor-type contribution to the total yield strength will be reduced and this will lead to an even smaller value of α for Ag, providing additional confirmation that the higher splitting distance is accompanied by a smaller value of α. In the cases of Cu–10% Zn and Cu–30% Zn, the values of α are most probably also overestimated in Table 7.1 due to the large twin boundary hardening.
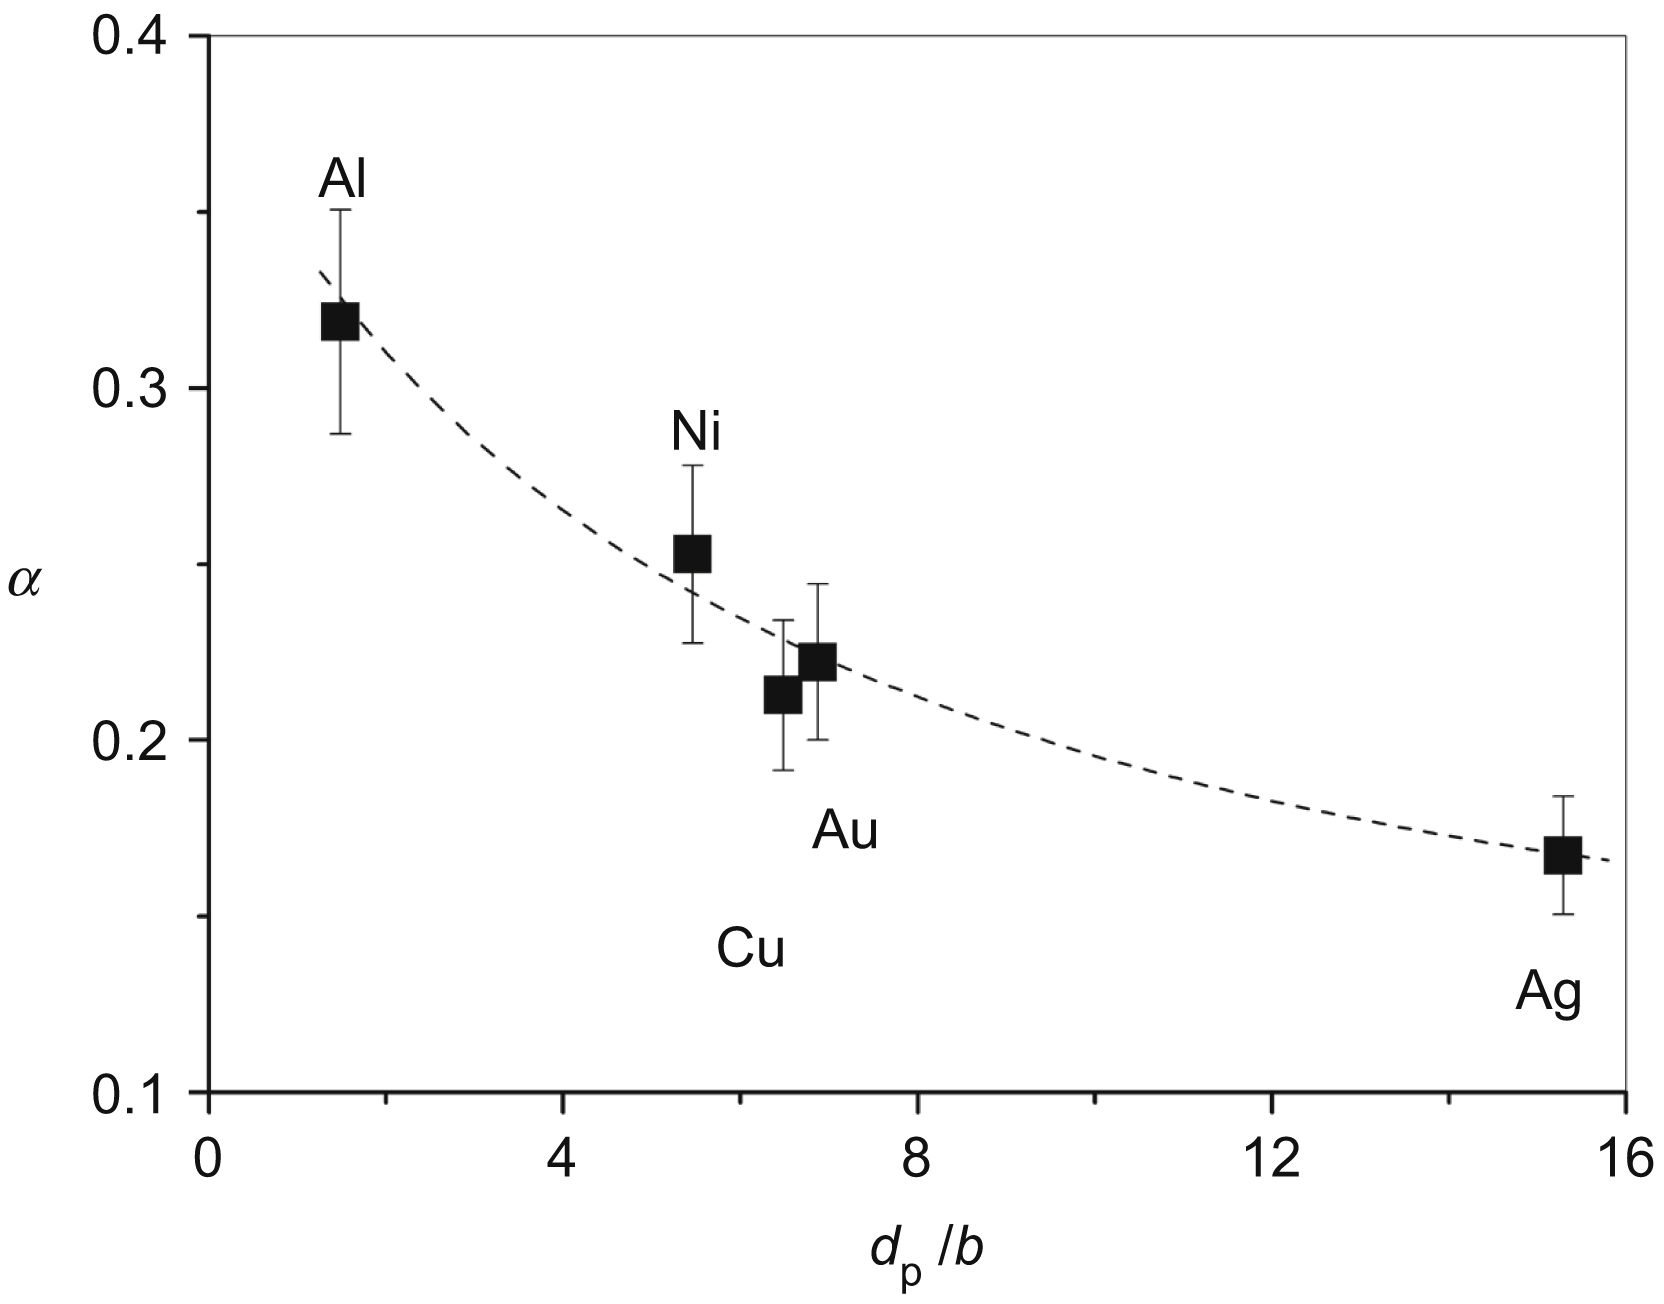
Figure 7.12 The value of α in the Taylor equation as a function of the equilibrium splitting distance between partials in Burgers vector unit (dp/b) for pure fcc metals processed by equal-channel angular pressing at room temperature till saturation of the dislocation density. Reprinted from J. Gubicza, N.Q. Chinh, J.L. Lábár, S. Dobatkin, Z. Hegedűs, T.G. Langdon, Correlation between microstructure and mechanical properties of severely deformed metals, Journal of Alloys and Compounds 483 (2009) 271–274 with permission from Elsevier.
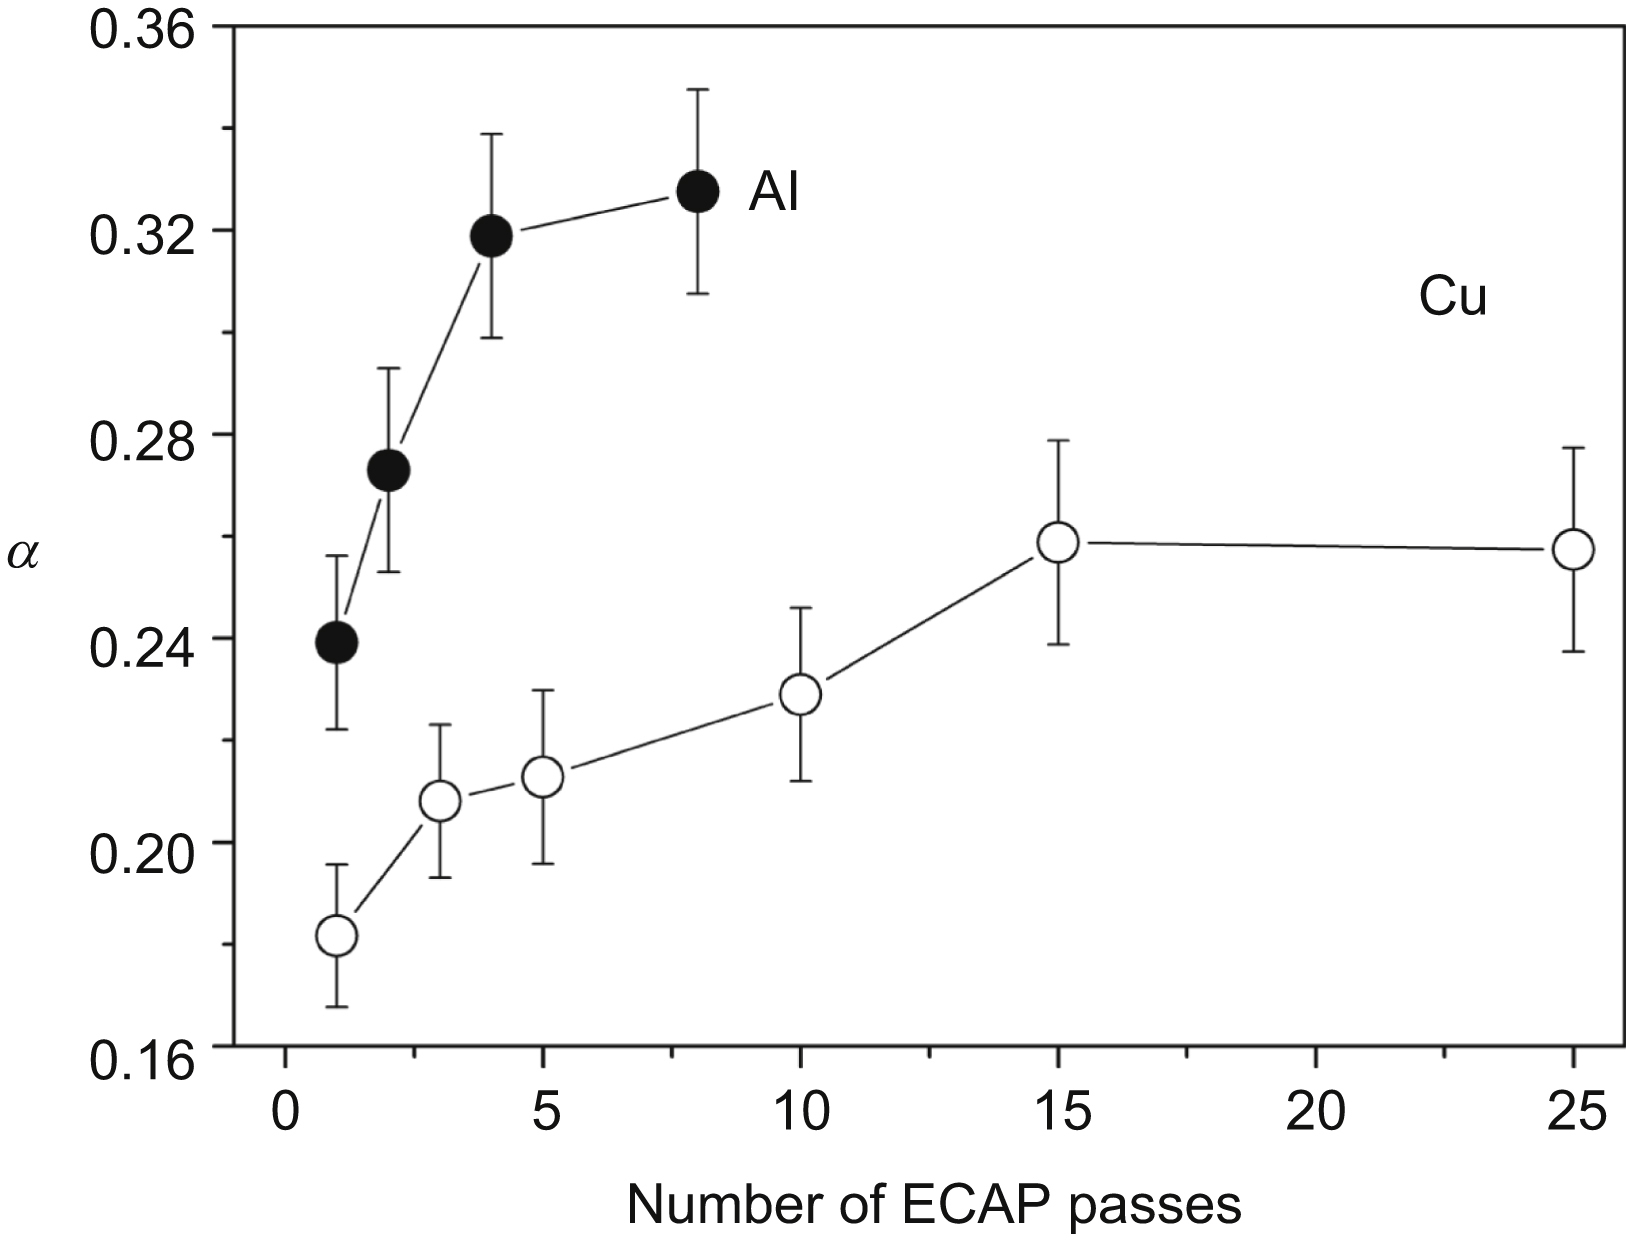
Figure 7.13 The value of α in the Taylor equation as a function of the number of equal-channel angular pressing (ECAP) passes for pure Al and Cu.
It is noted that α varies with increasing strain in SPD processing of pure fcc metals. Fig. 7.13 plots the value of α as a function of the number of ECAP passes for pure Al and Cu. The increase of the value of α with increasing strain is explained by the thinning of the grain/subgrain boundaries and the evolution to a more equilibrated structure as discussed in Chapter 3. It is worthwhile to note that in the case of Cu, α saturates only after 15 ECAP passes, although the maximum dislocation density has already been achieved after 5 passes indicating that the evolution of the dislocation structure continues even after the saturation of its density.
The yield strength values for some dispersion-strengthened UFG alloys are also presented in Table 7.1 but for these materials the value of α is not determined due to the strength contribution of the secondary phase dispersoids (precipitates). Considering nonshearable dispersoids in UFG alloys and assuming the additivity of the different strengthening contributions, the yield strength may be expressed by the following relationship [51]:
σy=σ0+αMGbρ1/2+0.85MGbln(x/b)2π(L−x),
![]() (7.11)
(7.11)
where x is the average size of dispersoids and L is the average distance between them. For instance, in supersaturated Al–4.8Zn–1.2Mg–0.14Zr and Al–5.7Zn–1.9Mg–0.35Cu (wt.%) alloys processed by eight passes of ECAP at 200 °C, stable incoherent MgZn2 precipitates (η-phase particles) form [48]. The different contributions to yield strength are calculated from Eq. (7.11) using the values of L and x obtained from transmission electron microscopy (TEM) images and the dislocation density determined by X-ray line profile analysis. The average size of the precipitates in the Al–4.8Zn–1.2Mg–0.14Zr and Al–5.7Zn–1.9Mg–0.35Cu alloys are 30 and 20 nm, respectively [48]. The average distance, L, between the precipitates is approximately 120 nm in the Al–4.8Zn–1.2Mg–0.14Zr alloy and 80 nm in the Al–5.7Zn–1.9Mg–0.35Cu alloy. The value of σ0 was taken as 20 MPa measured for pure Al [52] because the lattice parameter of the matrix obtained from the X-ray diffractograms agrees with the value for pure Al within the experimental error. The strength contributions originating from the dislocation density given by the second term in Eq. (7.11) are 133 and 137 MPa for Al–4.8Zn–1.2Mg–0.14Zr and Al–5.7Zn–1.9Mg–0.35Cu, respectively, as the dislocation densities in the two matrices are very close to each other. The third term in Eq. (7.11) related to the dislocation–precipitation interaction gives 156 and 214 MPa for Al–4.8Zn–1.2Mg–0.14Zr and Al–5.7Zn–1.9Mg–0.35Cu, respectively, where the difference between the two values is due to the different size and dispersion of precipitates [48]. Thus, the smaller particles with a more dense distribution lead to a higher strength for the Al–5.7Zn–1.9Mg–0.35Cu alloy. Finally, the sum of the three components leads to estimated total strengths of 309 and 371 MPa, which are in good agreement with the values of 290 and 350 MPa determined by mechanical testing for the Al–4.8Zn–1.2Mg–0.14Zr alloy and the Al–5.7Zn–1.9Mg–0.35Cu alloy, respectively (see Table 7.1).
7.4. Defect Structure and Ductility of Nanomaterials
Beside the yield strength, the ductility of UFG and nanomaterials is also an important parameter describing the mechanical behavior. The ductility is usually characterized by the maximum elongation or the maximum true strain (εmax) achieved until inhomogeneous deformation (necking) sets in during tension. After necking, the deformation is localized mainly to the neck, and due to the decrease of the cross section at the neck, the force required for further straining decreases, i.e., the deformation becomes unstable (it does not stop immediately when the force is reduced). As a consequence of inhomogeneous deformation after necking, the true stress (σ) and true strain (ε) vary along the longitudinal axis of the specimen; therefore the following usual formulas for the calculation of σ and ε can only be applied before necking:
ε=lnll0,
![]() (7.12a)
(7.12a)
Al=A0l0,
![]() (7.12b)
(7.12b)
σ=FA,
![]() (7.12c)
(7.12c)
where l and l0 are the actual and initial lengths of the sample, respectively, F is the applied force, A and A0 are the actual and initial cross sections of the sample, respectively. Eq. (7.12b) reflects the unchanged volume during plastic deformation. The deformation is stable only in the homogeneous regime, i.e., when the first derivative of the force over the sample length, dFdl , is larger than zero. Using Eqs. (7.12a–c), this criterion can be expressed by the true stress and true strain as
dσdε≥σ.
![]() (7.13)
(7.13)
This formula is referred as Considère criterion.
In the case of UFG and nanomaterials, the flow stress at RT is large even in the beginning of tension due to the high initial dislocation density and/or the small grain size, and it tends to saturate at small strain values. As a result, for UFG and nanomaterials the true stress, σ becomes equal to the work hardening rate, dσdε at smaller strains than for CG counterparts, i.e., the ductility decreases with decreasing grain size as illustrated in the schematic picture of Fig. 7.14. As an example, Fig. 7.15 shows the grain size dependence of ductility at RT for interstitial-free steel processed by accumulative roll bonding [53]. The grain size varies between 200 nm and 20 μm, and the ductility is described by the uniform and total elongations. The former and the latter quantities are determined when dFdl becomes zero and after the failure of the sample, respectively. Fig. 7.15 reveals that a large loss of ductility occurs when the grain size decreases below 1 μm. Similar effect is also observed for Al alloys processed by SPD [53]. In addition to the small value of work hardening rate, the considerable porosity and amount of oxide phase at the interfaces in UFG and nanomaterials consolidated from nanopowders (NPs) also reduce the ductility. The relative fractions of pores and oxide particles usually increase with decreasing grain size as a result of the larger specific surface area for a smaller initial particle size. The porosity and the oxide phase may yield weaker particle bonding resulting in an easier cracking under external loads. Generally, in UFG and nanomaterials the total elongation is typically less than a few percent and the regime of uniform deformation is even smaller, which limits their practical utility.

Figure 7.14 Schematic illustration of decreasing ductility (εmax) with decreasing grain size according to Considere criterion. CG, coarse-grained material; UFG, ultrafine-grained material.

Figure 7.15 Grain size dependence of uniform and total elongations at room temperature for interstitial free steel with various mean grain sizes. The data are taken from N. Tsuji, Y. Ito, Y. Saito, Y. Minamino, Strength and ductility of ultrafine grained aluminum and iron produced by ARB and annealing, Scripta Materialia 47 (2002) 893–899.
For materials whose plastic deformation is sensitive to strain rate (˙ε) , the strain regime of homogeneous deformation is determined by Hart's stability criterion:
dσdε≥σ(1−m),
![]() (7.14)
(7.14)
where m is the strain rate sensitivity parameter defined as
m=(∂lnσ∂ln˙ε)T.
![]() (7.15)
(7.15)
The value of m is usually between 0 and 1, but it depends on the microstructure, the temperature, and the strain rate of deformation. The higher strain rate sensitivity helps to sustain the homogeneous deformation since the material hardens at the neck when the strain rate increases in the beginning of necking that yields larger ductility. If the value of m is larger than 0.3, very large strains (higher than 100%) can be achieved during tension and this behavior is termed as superplasticity. Superplastic deformation in CG metals and alloys is usually observed at low strain rate (10−5–10−2 s−1), high homologous temperature (>0.5Tm, where Tm is the melting point), and for relatively small grain size (<10 μm) since its mechanism is the grain boundary sliding. As a consequence, the decrease in grain size usually improves the superplastic behavior. This effect is illustrated on a commercial spray-cast Al-7034 alloy having a chemical composition of 11.5% Zn–2.5%Mg–0.9% Cu–0.2% Zr (in wt.%) with the balance of Al [54,55]. The initial grain size of 2.1 μm is reduced to 300 nm after six ECAP passes at 200 °C. An as-received specimen and a sample processed by six passes were subjected to tensile testing at 350 °C at strain rates between 10−3 and 10−1 s−1. The elongations in the as-received condition were in the range of 150%–300%. The ECAP-processed specimen showed higher elongation for any strain rate and the maximum elongation was about 600% at strain rates in the vicinity of ∼10−2 s−1 which increased to 1100% in tensile testing at 400 °C [56]. The very high elongations for the ECAP-processed sample is due to the UFG microstructure which was retained even at high testing temperatures because of the presence of finely dispersed MgZn2 and Al3Zr precipitates that impeded grain boundary motion. In this case, ECAP processing results in an increase of the strain rate sensitivity from ∼0.2 to 0.3–0.5 [55].
At low homologous temperature, the strain rate sensitivity parameter is usually less than 0.05 because the superplastic deformation mechanisms (e.g., grain boundary sliding) are controlled by thermally activated diffusion. Fig. 7.16a and b shows that with decreasing grain size in fcc and body-centered cubic (bcc) metals, the value of m increases and decreases, respectively, which can be explained by the different nature of activation volumes of deformation [35]. The activation volume, V∗, for a dislocation controlled deformation is defined as the product of the Burgers vector, b, and the activation area for dislocation motion, A∗. The latter quantity is the area swept by a dislocation overcoming obstacles in its course. The activation volume can be expressed from the strain rate sensitivity as
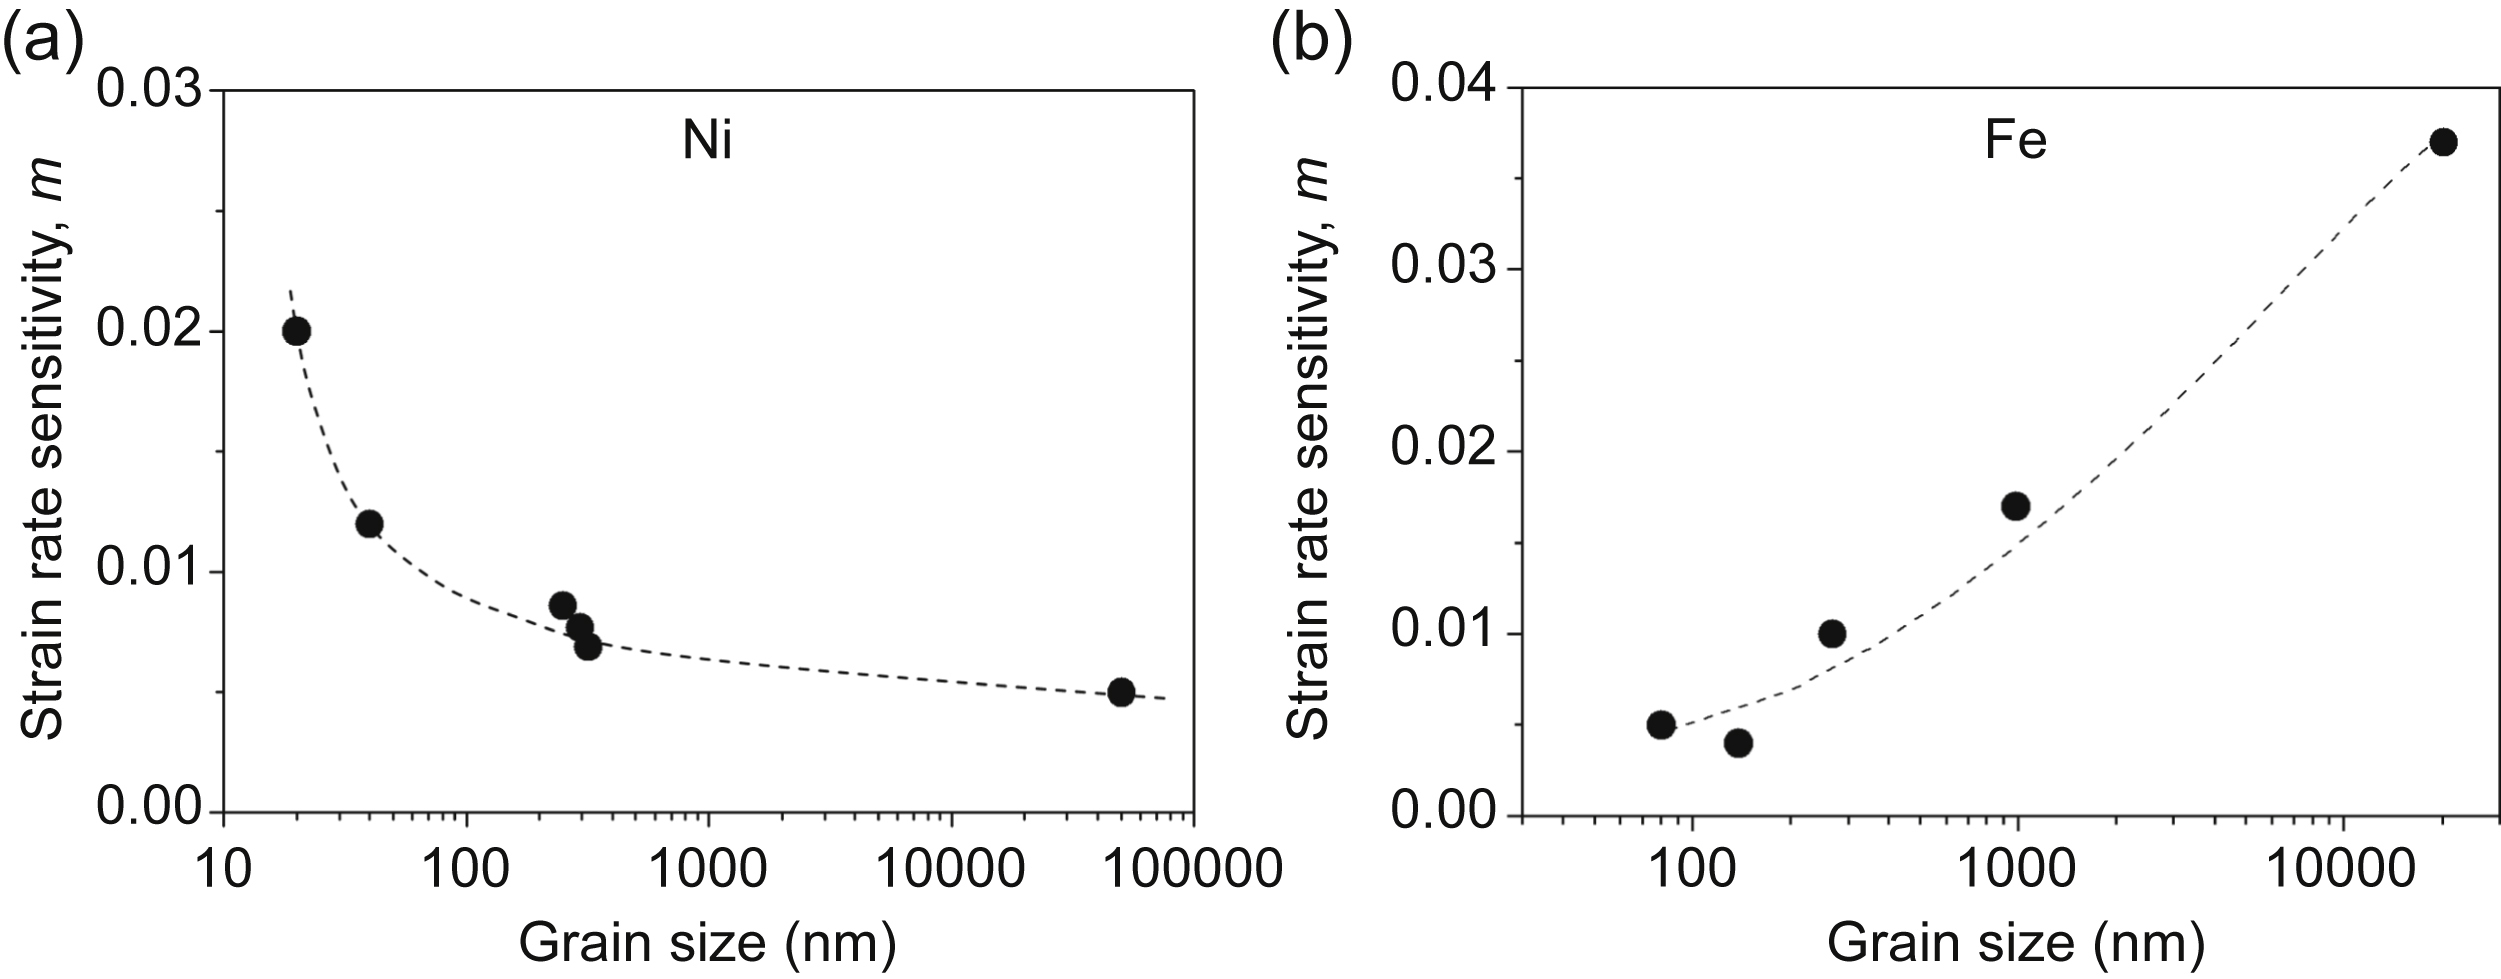
Figure 7.16 The strain rate sensitivity, m, measured at room temperature as a function of grain size for (a) face-centered cubic Ni [64–66] and (b) body-centered cubic Fe processed by powder metallurgy methods. The data are taken from D. Jia, K.T. Ramesh, E. Ma, Effects of nanocrystalline and ultrafine grain sizes on constitutive behavior and shear bands in iron, Acta Materialia 51 (2003) 3495–3509; Q. Wei, T. Jiao, K.T. Ramesh, E. Ma, L.J. Kecskes, L. Magness, R. Dowding, V.U. Kazykhanov, R.Z. Valiev, Mechanical behavior and dynamic failure of high-strength ultrafine grained tungsten under uniaxial compression, Acta Materialia 54 (2006) 77–87.
V∗=31/2kTmσ,
![]() (7.16)
(7.16)
where k is the Boltzmann constant and T is the absolute temperature of deformation. The activation volume decreases with decreasing grain size in fcc metals [57,58]. The rate-controlling mechanism for conventional polycrystalline fcc metals is the glide movement of a dislocation through the dislocation forest. The activation area is equal to the spacing of forest dislocations multiplied by b and the activation volume is therefore equal to 100–1000 × b3 for dislocation mechanism. For UFG fcc materials, the increase of the dislocation density yields a decrease in the average dislocation spacing, but this trend is almost completely compensated by the increase of flow stress, thereby m only slightly increases. In the nanocrystalline regime, V∗ decreases drastically to ∼10 × b3 as a consequence of the change in the rate-controlling mechanism [35]. Dislocation-boundary interactions or grain boundary sliding [59] are two possible mechanisms operating in nanomaterials which may cause the reduction in V∗ and the corresponding increase in m (see Fig. 7.16a).
In bcc crystals, screw dislocation cores are dissociated into nonplanar configurations [60], and the mobility of the edge components of dislocation loops is much higher than the mobility of the screw components [61]. For conventional polycrystalline bcc metals, the rate-controlling mechanism is the thermally activated motion of screw dislocations by the nucleation and propagation of kink pairs, which have an activation volume of only a few b3 even for CG materials [62]. In bcc metallic materials, V∗ is not reduced considerably with decreasing grain size while the flow stress increases, which yields a continuous decrease of strain rate sensitivity as shown in Fig. 7.16b for Fe. However, the constancy of V∗ does not mean that the rate-controlling deformation mechanism is the same in the whole grain size regime since in bcc nanomaterials other mechanisms with a small activation volume (e.g., grain boundary sliding) might become operative. The reduction of m for bcc metals with decreasing grain size contributes to the decrease in ductility at RT. The slight increase of m for UFG fcc materials is overwhelmed by the increase of flow stress yielding a decrease of ductility with the reduction of grain size. At the same time, for nanocrystalline fcc metals, the large increment in m may cause a restoration of ductility with retaining the high yield strength. It is noted that the value of m for UFG and nanomaterials increases with decreasing strain rate and/or increasing temperature of deformation [63].
Different strategies are developed to offset the low tensile ductility accompanying the high yield strength of nanocrystalline and UFG materials [63,68]. For instance, the uniform incorporation of some micron-sized grains into the UFG matrix yields an enhancement in the work hardening rate (dσdε) because the dislocation density can increase considerably in the coarse grains during deformation [63,69]. According to Eq. (7.13), the higher work hardening rate may cause larger uniform elongation. The micron-sized grains, however, inevitably lowers the yield strength of the otherwise nanocrystalline or UFG material but the relative decrease of strength is much smaller than the relative increment in ductility. The bimodal grain structure can be achieved by heterogeneous grain growth during annealing of severely deformed materials such as Cu [70] or Ni [71]. For instance, Fig. 7.17 compares the engineering stress–strain curves for UFG and bimodal Cu samples [63,70]. The UFG Cu specimen is processed by eight passes of ECAP at RT and then rolled at liquid nitrogen temperature (cryorolling) for a reduction of the cross-sectional area of 93%. After ECAP the average grain size of 300 nm is refined to 200 nm due to cryorolling. The annealing at 200 °C for 3 min results in a partial recrystallization of the cryorolled specimen that gives a bimodal grain structure. The recrystallized grains with the size of ∼2 μm are distributed homogeneously in the UFG matrix having a mean grain size of 200 nm [63,70]. In Fig. 7.17 the deformation is uniform till the first derivative of the engineering strain remains nonnegative. For the conventional CG material the uniform and total elongations are about 55% and 70%, respectively, which are reduced to 2% and 23% after SPD processing while there is a 10-fold increment in the yield strength. In the annealed material with bimodal microstructure, a pronounced strain hardening and corresponding improvements in the uniform and total elongations to 30% and 67%, respectively, are achieved while only a relatively small loss of strength was detected, as shown in Fig. 7.17.

Figure 7.17 Room temperature (RT) tensile engineering stress–strain curves for Cu with different microstructures. Ultrafine-grained (UFG): processed by eight passes of equal-channel angular pressing at RT and then rolled at liquid nitrogen temperature for a reduction of the cross-sectional area of 93%. Bimodal: sample UFG annealed at 200 °C for 3 min. Coarse-grained: conventional sample. The strain rate for all the tests is 10−4 s−1. The data are taken from Y.M. Wang, E. Ma, Three strategies to achieve uniform tensile deformation in a nanostructured metal, Acta Materialia 52 (2004) 1699–1709; Y. Wang, M. Chen, F. Zhou, E. Ma, High tensile ductility in a nanostructured metal, Nature 419 (2002) 912–915.
The heterogeneous microstructure with high strength and good ductility can be achieved by traditional plastic deformation procedures which are capable for large-scale industrial production of metallic materials at low cost. For instance, a process combining asymmetric rolling and annealing at 475 °C for 5 min yields a heterogeneous microstructure in Ti in which soft micrograined lamellae (with the size of ∼3 μm) are embedded in hard UFG lamella matrix (the grain size is about 300 nm) [72]. The CG lamellae are formed due to partial recrystallization in the annealing step. This heterogeneous microstructure is as strong as an UFG metal and as ductile as a conventional CG material. The yield strength and the elongation to failure are ∼900 MPa and ∼30%, respectively. The uniform elongation is also relatively large (∼8%). There is a spatial inhomogeneity in plastic deformation of this heterogeneous microstructure which produces considerable backstresses due to pile up of dislocations in softer grains at interfaces of UFG and coarse lamellae. These stresses have a significant contribution to the strength of this material in addition to dislocation hardening effect.
For UFG Al–1% Mg alloy processed by 10 turns of HPT, short-term annealing in a vacuum for 10 min yielded an improvement of ductility, as shown in Fig. 7.18 [73]. The heat treatment at 150 °C resulted in a decrease of the average dislocation density by one order of magnitude from 3.7 × 10¹⁴ m−2 to 0.5 × 10¹⁴ m−2 while the average grain size increased only by a factor of two from about 220 nm to 360 nm (see Fig. 7.18a). Accordingly, the ultimate tensile strength was reduced by ∼30% from 440 MPa to 320 MPa. At the same time, the ductility increased by a factor of two from 14% to 30%. Therefore, the annealing at moderate temperatures and for short times results in a larger increase of ductility than the reduction of strength in Al–1% Mg alloy. Similar improvement in the mechanical performance was observed for Cu–3 at.% Ag alloy samples processed by cold rolling at room and liquid nitrogen temperatures and short-time annealed just below the recrystallization temperature [74]. The temperatures of annealing for the cold-rolled and cryorolled specimens were 400 and 375 °C, respectively. After annealing, an inhomogeneous solute atom distribution developed in both Cu–Ag alloys since the Ag particles smaller than a critical size were dissolved due to the Gibbs–Thomson effect (see Chapter 3). The partial dissolution of Ag particles resulted in the development of a heterogeneous solute distribution in the Cu matrix. Furthermore, in the regions where the solute concentration increased, the dislocation density developed during rolling was retained in the Cu matrix even after annealing, while in other volumes a significant decrease in dislocation density was observed. Therefore, in the rolled and annealed samples, bimodal microstructures were developed where both the dislocation density and the solute concentration vary considerably. Due to this bimodal microstructure, the high strength achieved during rolling only slightly decreased while the ductility was recovered, as shown in Fig. 7.19. Indeed, the as-rolled samples exhibited high ultimate tensile strengths close to 600–700 MPa with small elongation to failure (∼2%–4%). After short-time annealing the ultimate tensile strength decreased only by about 20–60 MPa while the elongation to failure increased to 12%–14% [74]. The improvement of ductility can be attributed to the bimodal microstructure in the Cu matrix since the reduction of the dislocation density in some regions increased the strain hardening capacity of the material. Heterogeneous microstructures with different fractions of UFG and CG regions can also be manufactured by powder metallurgy, as shown for Al50583 alloy [75]. This material was consolidated from a blend of UFG and CG powders, and exhibited a high yield strength (619 MPa) and a relatively good ductility (the elongation to failure is ∼8%). Surface mechanical attrition treatment technique is also capable to produce heterogeneous microstructures in bulk materials, as demonstrated in 304 steel specimens, in which a central CG region is sandwiched between two surface gradient layers [76]. The gradient layer is composed of submicron-sized parallelepiped austenite domains separated by intersecting ε-martensite plates, with increasing domain size along the depth.

Figure 7.18 The dislocation density and the grain size (a) and the ultimate tensile strength and the elongation to failure (b) as a function of annealing temperature for Al–1% Mg processed by 10 turns of high-pressure torsion at room temperature [73].

Figure 7.19 Engineering stress–strain curves for Cu–3 at.% Ag alloy rolled at liquid nitrogen temperature (LNT) and room temperature (RT), and annealed for a short time at 375 and 400 °C, respectively [74].
Another approach for retaining a good ductility in addition to high strength in pure UFG and nanomaterials is to synthesize samples with nanoscale growth twins. Nanotwinned 99.998% purity UFG Cu specimens were produced by pulsed electrodeposition technique from an electrolyte of CuSO4 [77]. Due to their low energy, twin boundaries do not increase the stored energy very much, therefore from a thermodynamic point of view, it is beneficial to accommodate the orientation differences in the as-grown Cu by the formation of twin boundaries. It is noted that if a direct current is applied without pulses in electrodeposition, twins are scarcely observed in Cu. The twin boundary frequency is adjustable by modifying the electrodeposition parameters. When the deposition rate is high (for example, with a high current density or a large pH value of the solute) and/or the deposition temperature is low, more twins are formed. According to TEM investigations, the mean grain size of nanotwinned Cu processed by electrodeposition is ∼500 nm, while the average twin boundary spacing is ∼20 nm [77]. The sample has an (110) texture, which is usual for electrodeposited Cu specimens with growth twins. Although, a coherent twin boundary has very low interface energy compared to a conventional grain boundary, it is also very effective in blocking dislocations. In the as-deposited sample, the dislocation density is very low. During deformation, dislocations are formed and accumulated at the twin boundaries. In the electrodeposited samples either with or without twins, the low initial dislocation density enables the increase of its value during plastic deformation yielding a considerable work hardening that increases the uniform elongation compared to Cu specimens processed by SPD methods (see Table 7.2). The yield strength of the nanotwinned Cu is ∼900 MPa that is 2–3 times larger than the corresponding values for its counterparts with similar grain sizes since in the twinned material the characteristic length is rather the twin boundary spacing which is much smaller than the grain size. Twin boundaries also act as dislocation sources. TEM investigations revealed that the high stress concentrations in the vicinity of steps and jogs along twin boundaries yielded nucleation of partial dislocations at these boundaries. This mechanism has much smaller activation volume, V∗ = 3–10 × b3, than that of conventional full lattice dislocation motion (∼100–1000 × b3) [58]. Eq. (7.16) suggests that the strain rate sensitivity at RT is determined by the product V∗σ. Although, the flow stress, σ is very high (∼900 MPa) for nanotwinned Cu compared to UFG counterparts without twins (300–400 MPa), it cannot suppress the effect of the extremely low V∗ in the product of V∗σ, that yields a relatively high strain rate sensitivity, m ∼ 0.036. Table 7.2 summarizes the values of V∗ and m for various Cu samples. For nanotwinned Cu, the strain rate sensitivity is 2–7 times larger than that for the counterparts having similar grain size but no twin boundaries [30].
Table 7.2
The average grain size (d), the mean twin spacing (t), the activation volume (V∗), the strain rate sensitivity (m), the yield strength (σY), the uniform and total elongations for various Cu samples at room temperature
| Material | d (nm) | t (nm) | V∗ (×b3) | m | σY (MPa) | Uniform elongation (%) | Total elongation (%) |
| Coarse-grained Cu | 40,000 | – | 1000 | 0.006 | 25 | 55 | 70 |
| Cu processed by eight equal-channel angular pressing | 200–300 | – | 48 | 0.02 | 400 | 1 | 14 |
| Electrodeposited Cu (without pulses) | 400–500 | – | 135 | 0.005 | 250 | 12 | 16 |
| Electrodeposited Cu (with pulses) | 400–500 | 20 | 12 | 0.036 | 900 | 12 | 14 |
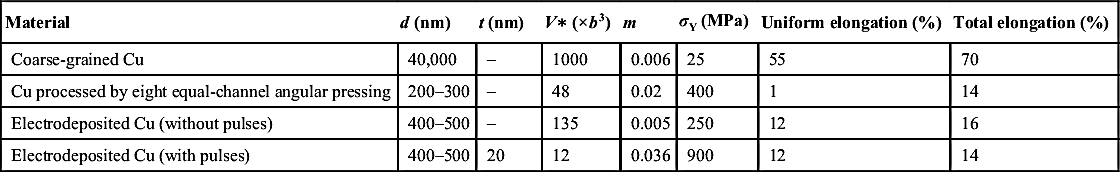
The data are taken from L. Lu, R. Schwaiger, Z.W. Shan, M. Dao, K. Lu, S. Suresh, Nano-sized twins induce high rate sensitivity of flow stress in pure copper, Acta Materialia 53 (2005) 2169–2179; Y.M. Wang, E. Ma, Three strategies to achieve uniform tensile deformation in a nanostructured metal, Acta Materialia 52 (2004) 1699–1709.
In alloys, nanoparticles and nanoprecipitates pin dislocations that improve the dislocation storage capacity of the material. As a result, the work hardening rate increases that leads to larger uniform elongation while elevating strength [35]. Applying SPD methods at high temperatures on supersaturated solid solutions or partially precipitated alloys, the large defect densities produced during processing act as nucleation sites of precipitates and therefore yield a large population of uniformly distributed nanoparticles [48]. Another strategy to increase the ductility in metallic materials is hindering recovery during straining by reducing deformation temperature to cryogenic regime (liquid nitrogen temperature, ∼77 K) and/or by increasing strain rate [35]. The reduced recovery of the dislocation structure increases the strain hardening rate and thereby the ductility is improved. For instance, for Cu processed by eight passes of ECAP the uniform and total elongations increase from 1% to 13% and from 14% to 26%, respectively, when the temperature of tension is reduced from RT to 77 K at a strain rate of 10−4 s−1 [63]. For this material, the increment of strain rate from 10−4 to 10−1 s−1 at RT yields an improvement in uniform and total elongations from 1% to 3% and from 14% to 19%, respectively. At cryogenic temperature, the uniform elongation changes from 13% to 19%, while the total elongation increases from 26% to 40% when the strain rate is raised from 10−4 to 10−1 s−1 [63].
SPD methods, such as ECAP may also yield a combination of good ductility and high strength, if SPD processing is performed beyond a certain level of strain [78]. For instance, the total elongation of Cu processed by ECAP at RT first decreases with increasing number of passes but after 16 passes the elongation is restored to ∼55% that is very close to the value obtained on CG material (60%–70%) while the yield strength remains high (∼400 MPa). After four to six passes of ECAP, the grain size in Cu saturates at a value of 100–200 nm, but the microstructure development continues, and the fraction of high angle grain boundaries increases [78,79] and/or the dislocation density slightly decreases [31,80]. The latter structural recovery at large strains is accompanied by a decrease in the grain boundary thickness corresponding to an evolution from nonequilibrium boundaries to a more equilibrated structure [81,82]. The larger fraction of high-angle grain boundaries facilitates grain boundary sliding as a mechanism of plastic deformation [78]. Deformation entirely by grain boundary sliding would ideally result in a strain rate sensitivity of 0.5 whereas conventional dislocation slip typically results in strain rate sensitivities less than 0.05. The relatively high value of m = 0.14 obtained for Cu processed by 16 passes of ECAP suggests that a mixture of grain boundary sliding and dislocation slip occurs in nanostructured metals processed by SPD for large strains [78]. The higher strain rate sensitivity improves the ductility without sacrificing the large yield strength.
7.5. Influence of Sintering Conditions on Strength and Ductility of Consolidated Nanomaterials
In Chapter 5, the defect structures in UFG Ni samples sintered from NPs under different consolidation conditions are reviewed. In this section, the mechanical behaviors of these materials are compared. The samples are consolidated from NPs with the particle size of 100 or 50 nm. The sintering is carried out by hot isostatic pressing (HIP) or spark plasma sintering (SPS) method. The details of the consolidation procedures are given in Chapter 5 and also listed in Table 7.3. Both the NPs and the consolidated materials contain NiO. The amount of NiO is characterized by the integrated intensity ratio of the NiO and Ni peaks on the X-ray diffractograms at 2Θ = 37.4 and 44.6 degrees, respectively. The intensity ratios for the initial powders having particle sizes of 100 and 50 nm are 0.5% and 1.2%, respectively, which does not change during HIP processing as a result of the careful isolation of the sample from air. On the other hand, in SPS processing, the capsule containing the powder was broken in air that yields an increase of NiO content from 0.5% to 0.9% and from 1.2% to 1.5% for the powders with particle sizes of 100 and 50 nm, respectively [83]. When the consolidation by SPS is performed in Ar, the amount of NiO does not increase significantly (see Table 7.3). The grain size and the defect densities are listed in Table 5.2 in Chapter 5 for the samples sintered by SPS in air and by HIP in Ar.
Table 7.3
The relative density, the intensity ratio (INiO/INi) of the X-ray peaks for NiO and Ni at 2Θ = 37.4 and 44.6 degrees, respectively, the mean grain size (d) obtained from transmission electron microscopy images, the yield strength, maximum strength, and the strain to failure determined by compression for Ni samples processed from nanopowders by hot isostatic pressing (HIP) or spark plasma sintering (SPS)
| Powder particle size (nm) | Consolidation conditions | Relative density (%) | INiO/INi (%) | d (nm) | Yield strength (MPa) | Maximum strength (MPa) | Strain to failure |
| 100 | HIP, 140 MPa, 700 °C, 150 min, in Ar | 95.5 | 0.5 ± 0.1 | 403 | 542 | 789 | 0.35 |
| 100 | SPS, 150 MPa, 500 °C, 1 min, in air | 95.4 | 0.9 ± 0.1 | 294 | 682 | 873 | 0.21 |
| 100 | SPS, 100 MPa, 500 °C, 4 min, in Ar | 94.0 | 0.6 ± 0.1 | 306 | 660 | 878 | 0.33 |
| 50 | SPS, 150 MPa, 500 °C, 1 min, in air | 94.5 | 1.5 ± 0.1 | 250 | 1022 | 1178 | 0.04 |

The data are taken from Q.H. Bui, G. Dirras, S. Ramtani, J. Gubicza, On the strengthening behavior of ultrafine-grained nickel processed from nanopowders, Materials Science and Engineering A 527 (2010) 3227–3235; J. Gubicza, H.-Q. Bui, F. Fellah, G.F. Dirras, Microstructure and mechanical behavior of ultrafine-grained Ni processed by different powder metallurgy methods, Journal of Materials Research 24 (2009) 217–226.
Fig. 7.20 shows the stress–plastic strain curves obtained for the four consolidated Ni samples by quasistatic compression at RT. The yield strength, the maximum strength and the strain to failure are listed in Table 7.3. The yield strength data are plotted as a function of the inverse square root of the grain size in Fig. 7.21 (Hall–Petch plot). In the figure, the values obtained on the four UFG Ni samples are completed by the strength (96 MPa) determined on a CG (grain size is ∼5 μm) specimen consolidated by SPS. In addition to the strength values obtained on the samples processed by powder metallurgy (denoted by solid squares), data determined on oxide-free Ni specimens produced by electrodeposition (marked by open circles) are also plotted in Fig. 7.21 [66]. The latter values gives a Hall–Petch relationship with the values of σ0 = 37 MPa and k = 5538 MPa nm1/2 represented by a solid straight line in Fig. 7.21. The yield strength data of the UFG samples processed by powder metallurgy are higher than the values predicted from the Hall–Petch relationship since not only the grain size but also the NiO dispersoids contribute to the strength. In the case of the CG Ni specimen consolidated by SPS, the oxide content is marginal therefore its strength is determined basically by the grain size as shown in Fig. 7.21. Assuming a simple linear addition of the strength contributions from the grain size and the oxide particles, the oxide strengthening in the UFG samples processed by powder metallurgy can be estimated by subtracting the strength contribution of the grain size from the experimental yield strength. The strength caused by the grain size can be calculated from the Hall–Petch relationship obtained for the oxide-free electrodeposited Ni samples. Fig. 7.22 shows that the calculated strength contribution of NiO dispersoids correlates well with the intensity ratio INiO/INi, i.e., with the oxide volume fraction. Fig. 7.21 suggests that the smaller the grain size, the higher the strength contribution of NiO. The main reason of this behavior is the fact that the majority of oxide in the initial powder can be found on the particles' surfaces, therefore the smaller powder particle size is accompanied by higher oxide content. As the smaller particle size usually yields smaller grain size after consolidation, the NiO content and its strengthening contribution increase with decreasing grain size. It should be noted that in addition to the initial particle size, the consolidation atmosphere also influences the oxide content in the sintered material as revealed in Table 7.3. This effect will be discussed in the next paragraphs.

Figure 7.20 Compression stress–strain curves for Ni samples consolidated from powders with the grain size of 50 or 100 nm, in Ar or air and by hot isostatic pressing (HIP) or spark plasma sintering (SPS). After Q.H. Bui, G. Dirras, S. Ramtani, J. Gubicza, On the strengthening behavior of ultrafine-grained nickel processed from nanopowders, Materials Science and Engineering A 527 (2010) 3227–3235 with permission from Elsevier.
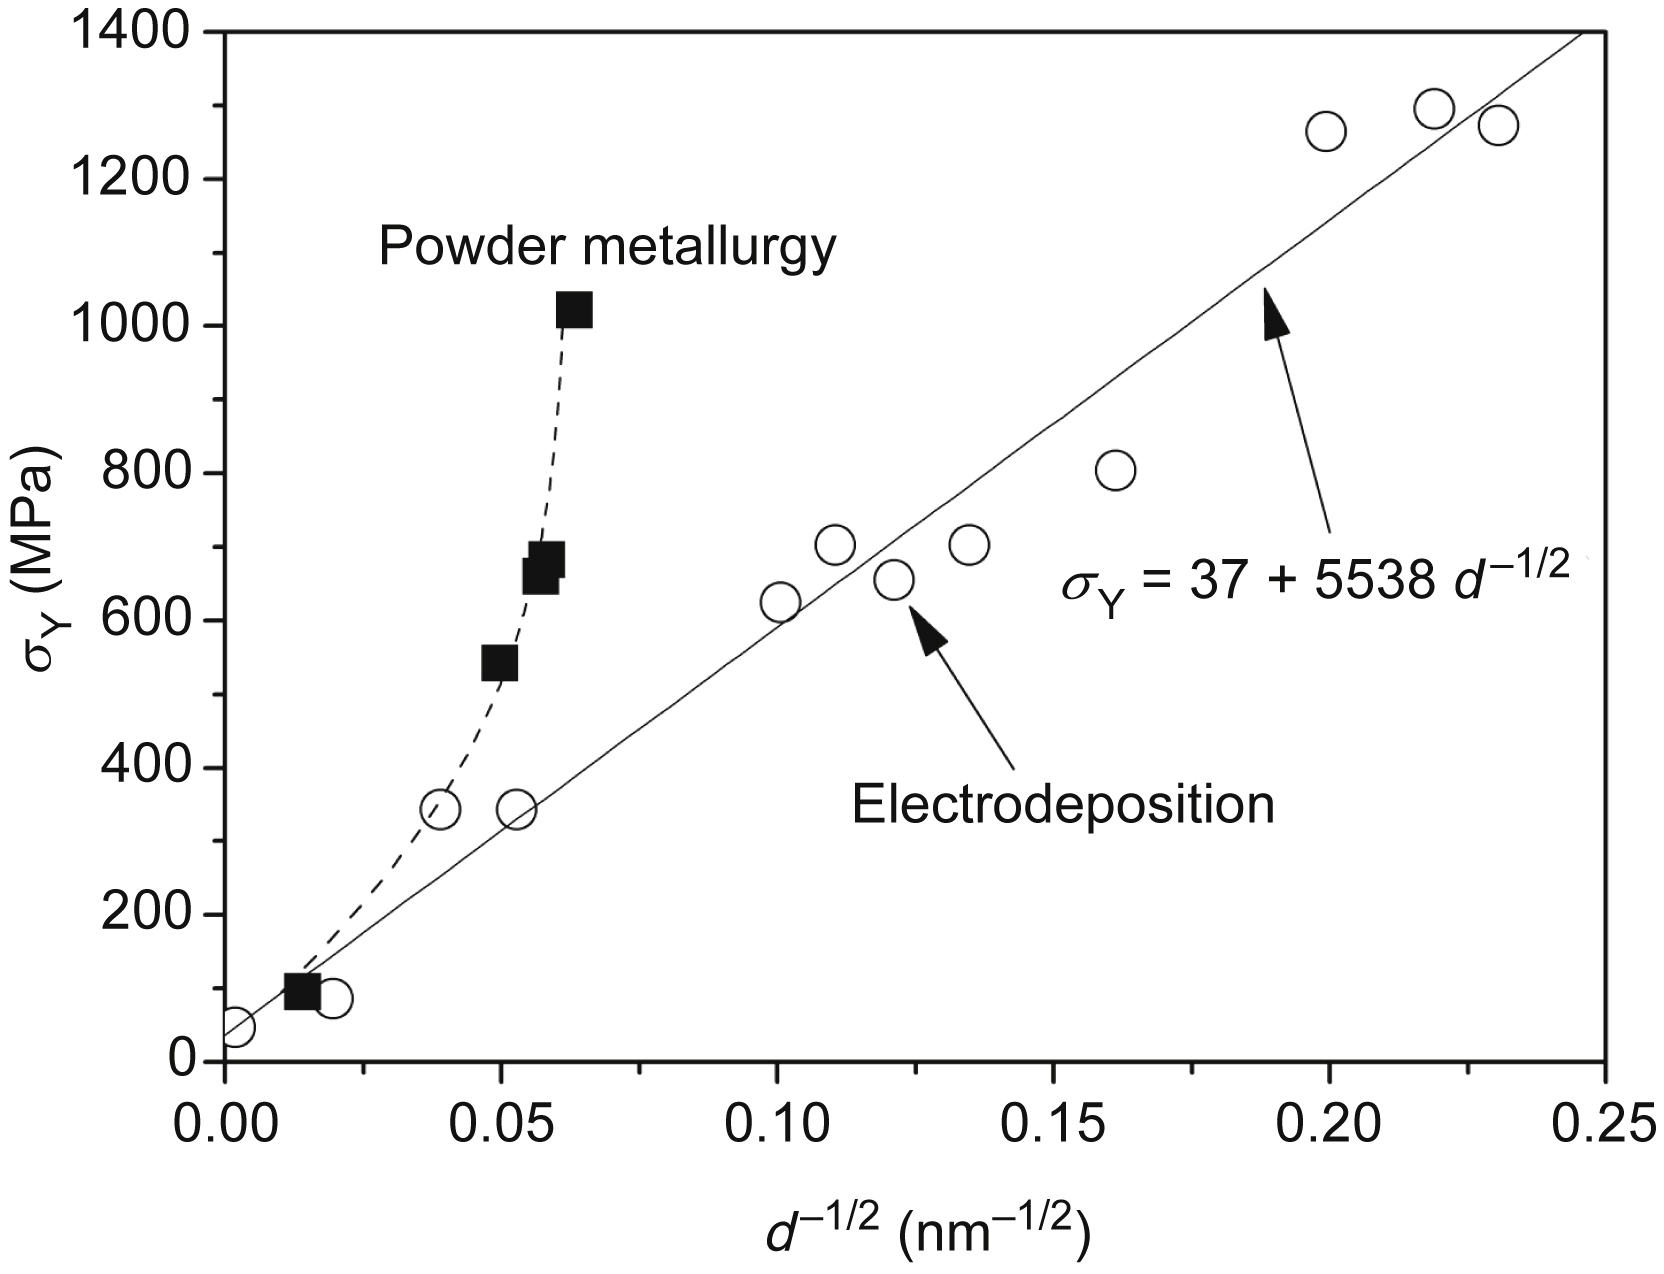
Figure 7.21 Hall–Petch relation between the yield strength (σY) and the grain size (d) for Ni samples processed by electrodeposition and powder metallurgy. The solid line represents a linear fit on the data obtained for electrodeposited Ni specimens. After Q.H. Bui, G. Dirras, S. Ramtani, J. Gubicza, On the strengthening behavior of ultrafine-grained nickel processed from nanopowders, Materials Science and Engineering A 527 (2010) 3227–3235 with permission from Elsevier.
Fig. 7.20 shows that the UFG Ni samples processed from the powder having a mean particle size of 100 nm by HIP or SPS have very different mechanical behaviors. The specimen processed by SPS has higher yield strength (682 MPa) than that obtained for the sample consolidated by HIP method (542 MPa) as a result of the higher oxide dispersoid content and the smaller grain size of the former specimen. The smaller grain size is due to the reduced temperature and time of SPS procedure while the higher NiO content is resulted by the processing of the powder in air. Comparing the mechanical behaviors of the two samples, it is revealed that the HIP-processed sample hardens in the whole range of strain while in the case of SPS-processed specimen the flow stress saturates at a small strain value (ε ≈ 0.04) and after a very short plateau the sample softens till rupture. The values of strain to failure are 0.22 and 0.35 for the SPS- and HIP-processed samples, respectively [83].

Figure 7.22 The strength contribution of NiO dispersoids in sintered Ni samples as a function of the intensity ratio (INiO/INi) of the X-ray diffraction peaks for NiO and Ni at 2Θ = 37.4 and 44.6 degrees, respectively.
For a better understanding of the difference in the mechanical behaviors of the HIP- and SPS-processed samples, the defect structures were determined after the compression test by X-ray line profile analysis. Fig. 7.23a and b shows the dislocation density and the twin boundary frequency for the HIP- and SPS-processed samples before and after compression. It can be seen that during RT deformation the dislocation density increased from 5.6 ± 0.5 to 16 ± 2 × 10¹⁴ m−2 for the HIP-processed sample and from 5.1 ± 0.5 to 21 ± 3 × 10¹⁴ m−2 in the case of the SPS-processed specimen. At the same time, the twin boundary frequency decreased during compression for both samples: in the case of the HIP-processed sample from 0.32 ± 0.03% to 0.02 ± 0.02% and for the SPS-processed specimen from 0.29 ± 0.03% to 0.18 ± 0.02%. Fig. 7.23c and d shows the distribution of the angle of misorientation between the grains in the as-consolidated samples and in the specimens compressed up to 10% strain as determined by electron backscatter diffraction (EBSD) experiments. For the as-consolidated samples there is a peak at about 60 degrees in the misorientation distribution which corresponds to twin boundaries [71,84]. After compression at 10% strain, this peak disappeared for both samples indicating the reduction of densities of twin boundaries. This observation is in agreement with the results of X-ray line profile analysis.
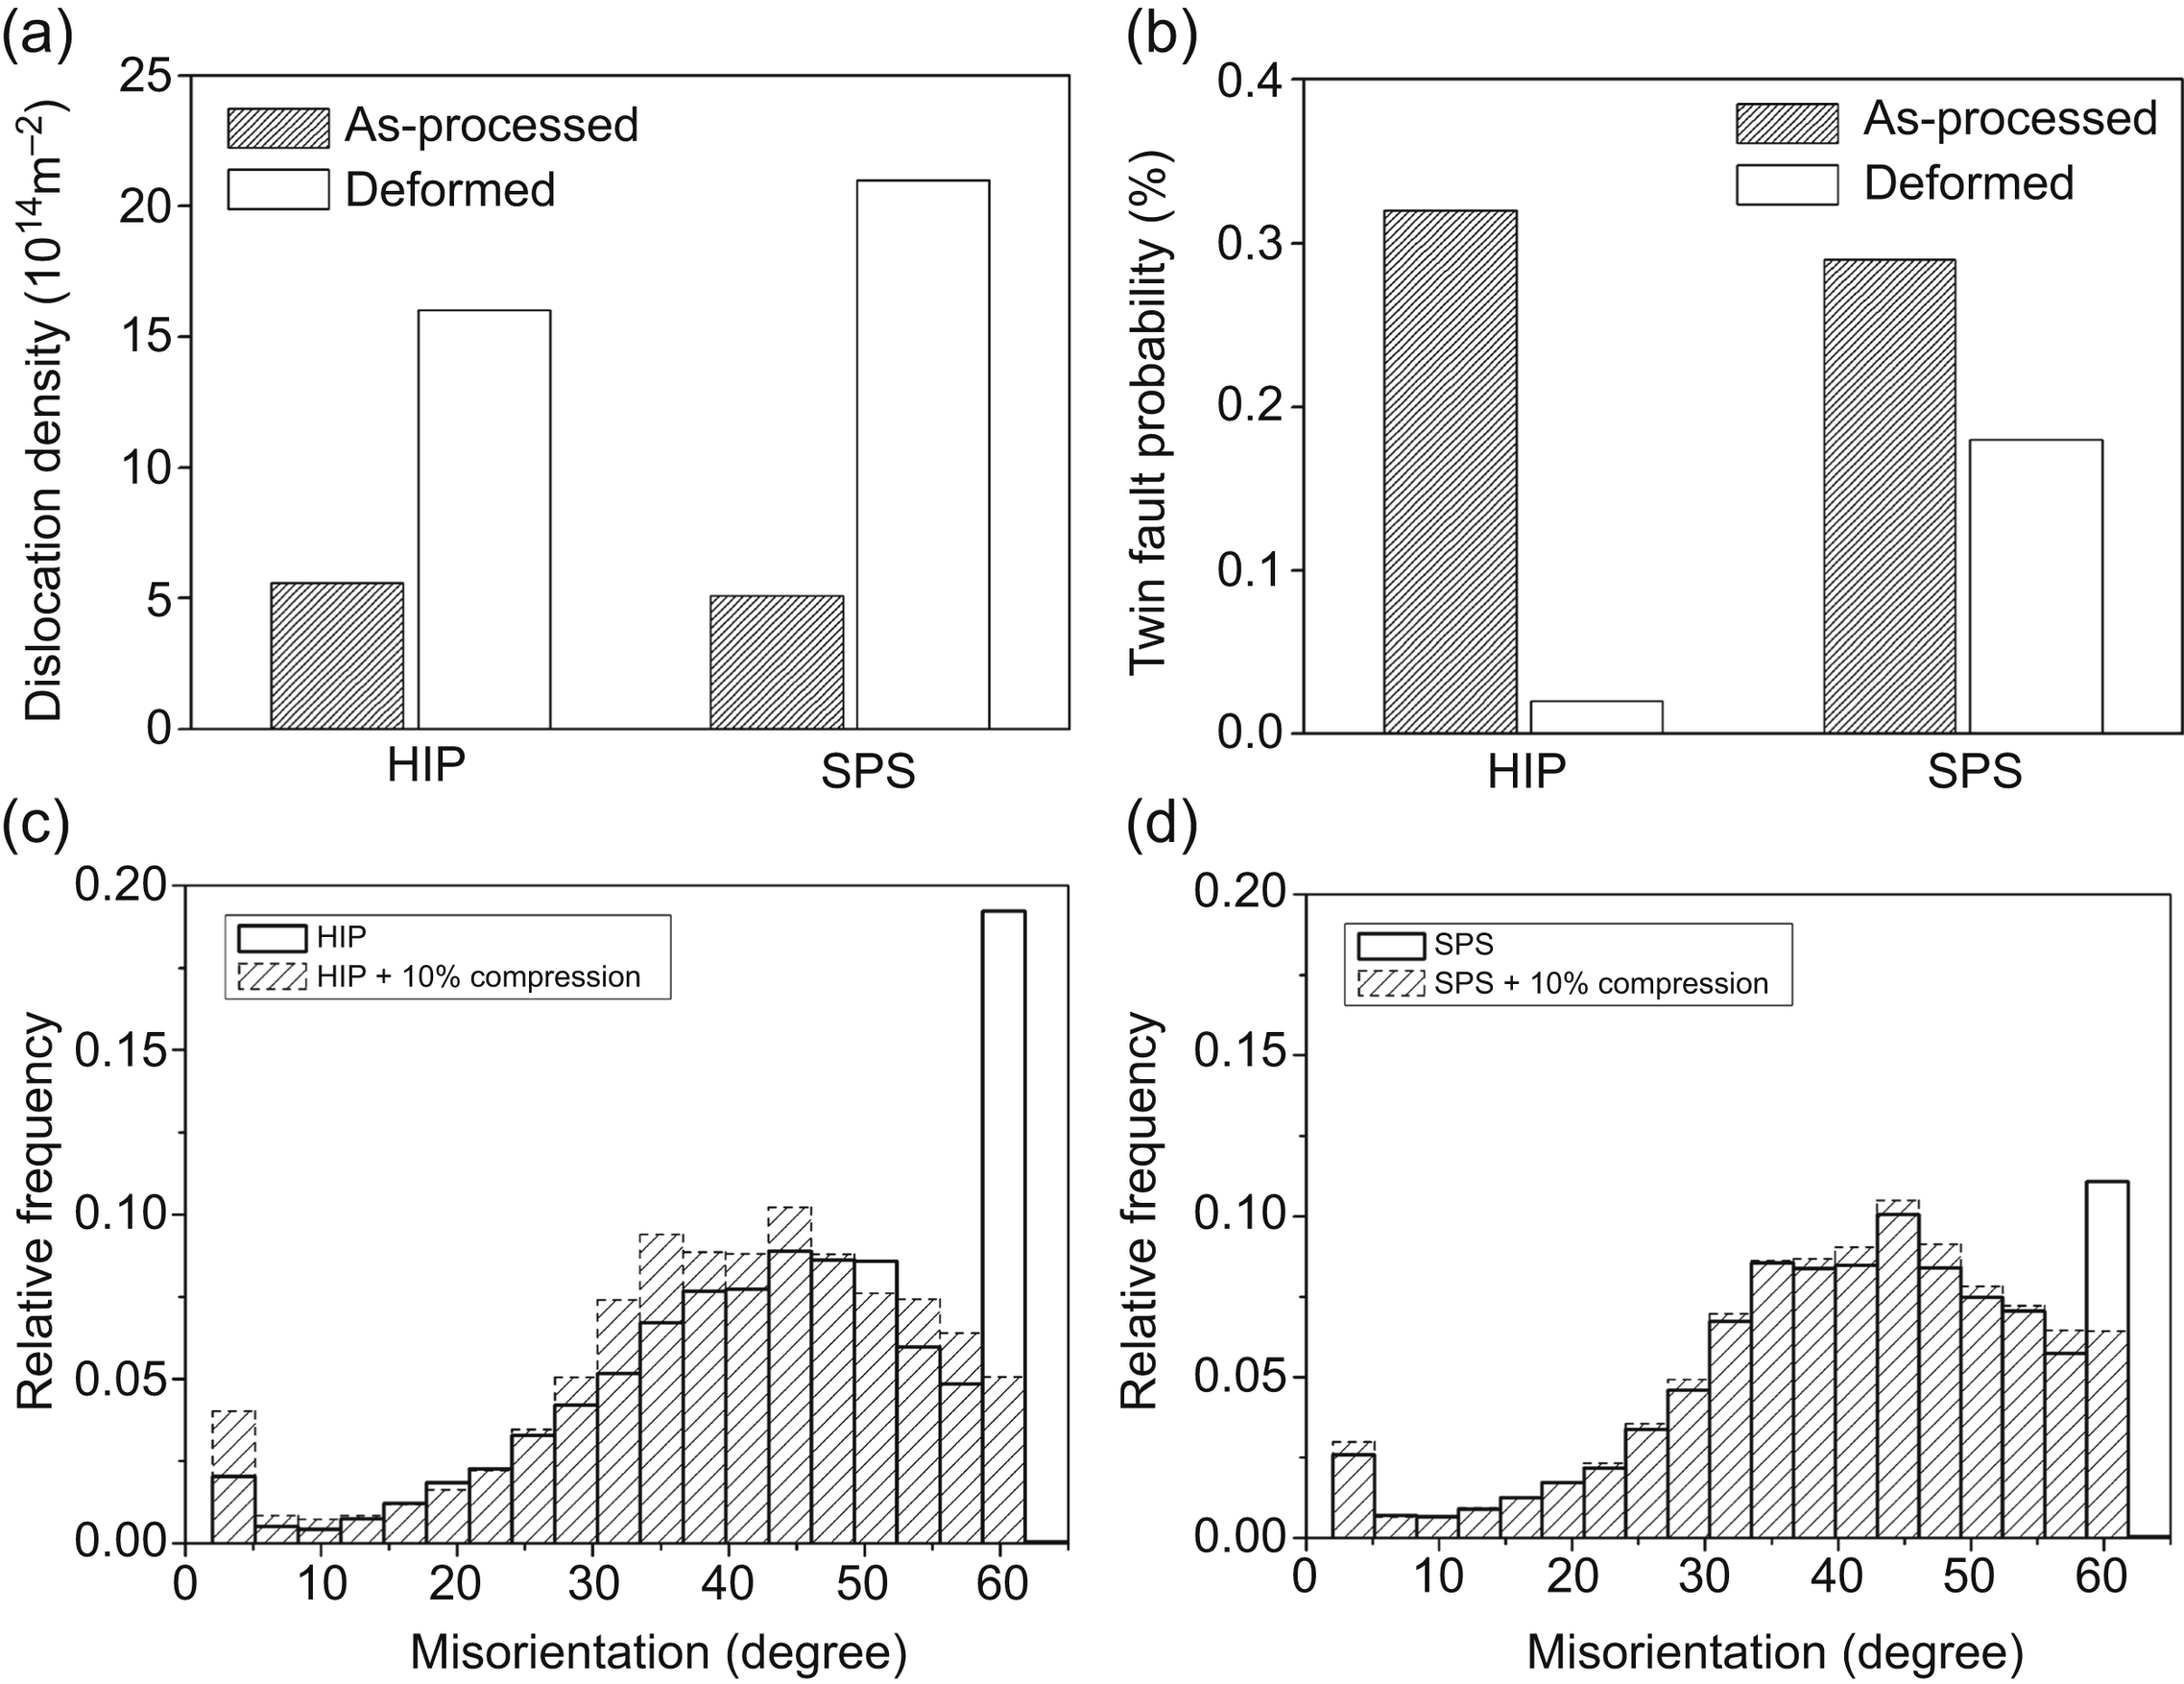
Figure 7.23 (a) The dislocation density and (b) the twin boundary frequency for the hot isostatic pressing (HIP)- and spark plasma sintering (SPS)-processed samples before and after compression test as determined by X-ray line profile analysis. The distribution of the angle of misorientation between the grains in the (c) HIP-processed sample and after compression up to 10% strain and (d) in the SPS-processed sample and after compression up to 10% strain as determined by electron backscatter diffraction. Reproduced from J. Gubicza, H.-Q. Bui, F. Fellah, G.F. Dirras, Microstructure and mechanical behavior of ultrafine-grained Ni processed by different powder metallurgy methods, Journal of Materials Research 24 (2009) 217–226 with permission from Cambridge University Press.
The increase of the dislocation density and the decay of twins (referred to as untwinning) are resulted by the interaction between dislocations and twin boundaries during compression. This interaction first yields steps on twin boundaries as indicated by black arrows in the TEM image of Fig. 7.24a [83]. The mechanism of step formation is depicted in Fig. 7.24b. Twin boundaries act as obstacles to dislocation gliding and the blocked dislocations may dissociate [71]. For example, if a dislocation having a Burgers vector of 12[101] and gliding on plane (ˉ111)
 reaches a twin boundary on plane (111), this dislocation may dissociate into a Shockley partial and a nonglissile Frank dislocation, such as 12[101]→16[1ˉ21]+13[111]
 . The Shockley partial with the Burgers vector of 16[1ˉ21]
 may slip on plane (111) resulting in a narrowing of a part of the twin by one (111) lattice spacing. If a slip band intersects a twin boundary on plane (111), the slipping of Shockley partials on successive planes (111) yields a partial untwinning as discussed in Chapter 4.

Figure 7.24 (a) Transmission electron microscopy image showing twins in a large grain after compression test of Ni sample processed from a powder with particle size of 100 nm by spark plasma sintering in air. The arrows show steps on twin boundaries as a result of untwinning process. The untwinning mechanism is illustrated in (b) showing the Burgers vectors of dislocations interacting with a twin boundary (TB). Reproduced from J. Gubicza, H.-Q. Bui, F. Fellah, G.F. Dirras, Microstructure and mechanical behavior of ultrafine-grained Ni processed by different powder metallurgy methods, Journal of Materials Research 24 (2009) 217–226 with permission from Cambridge University Press.
It is a general observation for both HIP- and SPS-processed samples that untwinning can be observed only in large grains having grain sizes higher than about 500 nm because in larger grains the contribution of dislocations to plastic deformation is higher. In Chapter 5, Fig. 5.12c and d shows that the size distribution of grains containing twins follows the total grain size distribution in both consolidated Ni samples. As the HIP-processed sample has larger grains and untwinning mainly occurred in large grains, the decrease of twin probability during compression is expected to be higher for the HIP-processed sample. This is in agreement with the experimental results of X-ray line profile analysis which shows that the reduction of twin probability is much higher for the HIP-processed sample than in the case of the SPS-processed specimen (see Fig. 7.23a and b). The larger strain to failure for the HIP-processed sample may also have a contribution to the higher degree of untwinning in this specimen. It is noted that in the case of the sample produced from the powder having a mean particle size of 50 nm by SPS, the dislocation density increases from 3.7 × 10¹⁴ to 8.5 × 10¹⁴ m−2 and the twin probability decreases from 0.25% to 0.20% in the compression test. The smaller changes of defect densities in this case can be explained by the very small value of strain to failure.
In the beginning of compression test the strain hardening for the SPS-processed sample is larger and the flow stress saturates at a relatively low strain value. This can be explained by the larger fraction of oxide dispersoids, which interact with the dislocations emitted from grain boundaries leaving dislocation loops around the NiO particles thereby increasing the dislocation density very quickly [85]. It is noted that the low strain value at saturation does not exclude a high value of the saturated dislocation density as can be seen in the case of the sample processed by SPS (21 ± 3 × 10¹⁴ m−2). After saturation of the flow stress, strain softening occurs during deformation of the SPS-processed sample while the HIP-processed specimen hardens till failure (see Fig. 7.20). Fig. 7.25 shows scanning electron microscopy images taken on the surface of the SPS-processed sample deformed by compression to the strain value of 7% (A), 18% (B), 22% (C) and for the HIP-processed specimen at a strain of 25% (D). The loading axis is vertical on the figure. It can be seen that cracks (indicated by arrows) form in the SPS-processed sample during compression and the concentration and length of cracks increase with increasing strain. At the same time, no decohesion or crack formation was observed in the case of the HIP-processed sample compressed up to 25% strain. TEM pictures reveal that the cracks are formed at the grain boundaries of the SPS-processed sample during compression tests. The crack formation is most probably the reason of the flow softening during compression test and the smaller strain to failure in the case of the SPS-processed sample. The crack formation can be attributed to the higher flow stress level during deformation of the SPS-processed sample (see Fig. 7.20), which results in a larger probability of debonding between the grain boundaries. Additionally, the higher total oxide content in the SPS-processed sample probably involves higher oxide content on the grain boundaries which may reduce the grain boundary strength resulting in an easier cracking during deformation [86].

Figure 7.25 Scanning electron microscopy images showing the surface of the sample processed by spark plasma sintering (SPS) in air deformed by compression to the strain values of (a) 7%, (b) 18%, and (c) 22% and (d) the surface of the hot isostatic pressing (HIP)-processed specimen at a strain of 25%. The loading axis is vertical in the figures. Some cracks are indicated by black arrows. Reproduced from J. Gubicza, H.-Q. Bui, F. Fellah, G.F. Dirras, Microstructure and mechanical behavior of ultrafine-grained Ni processed by different powder metallurgy methods, Journal of Materials Research 24 (2009) 217–226 with permission from Cambridge University Press.
7.6. Mechanical Behavior of Materials Sintered From Blends of Powders With Different Particle Sizes
In Chapter 5, the grain size distribution and the defect structure were studied in Ni materials consolidated from blends of NP and coarse powder (CP). In this section, the mechanical properties of these materials are studied. In addition to the bulk samples processed from 100% NP and 100% CP powders (referred to as samples UFG and CG, respectively), two additional specimens with different volume fractions of powders NP and CP were prepared. The volume fractions of CG and UFG components are 61% and 39% for sample A, respectively, while these values are 39% and 61% for sample B [87]. Fig. 7.26a shows the resulting true stress–true strain curves for samples CG, A, B, and UFG. The yield strength was plotted as a function of the UFG volume fraction in Fig. 7.26b. It can be seen that the yield strength increases with increasing the amount of the UFG content of the samples. However, the yield strength values determined for samples A and B can be found under the straight line connecting the datum points of the fully CG and UFG samples. This means that the yield strength of the composite-like materials cannot be obtained by a linear interpolation from the strength values of the fully CG and UFG specimens [87].
The strength of the CG and UFG components are characterized locally by nanoindentation. The nanohardness distributions for the fully CG specimen, samples A and B, and for the fully UFG specimen are shown in Fig. 7.27. The mean hardness increases in the following order: specimen CG (2.4 ± 0.1 GPa), sample A (3.3 ± 0.1 GPa), sample B (4.9 ± 0.1 GPa), and specimen UFG (7.1 ± 0.1 GPa) [87]. It can be seen that the mean nanohardness increases with increasing the UFG content of the samples, which is in line with the trend observed for the yield strength. At the same time, the hardness for samples A and B are smaller than the values interpolated from the hardness values characteristic for the fully CG and UFG specimens (see Fig. 7.28). This observation is in line with the results obtained for the yield strength.

Figure 7.26 (a) True stress–logarithmic plastic strain curves obtained by compression test at room temperature for samples CG, A, B, and ultrafine-grained (UFG) consolidated from blends of nano- and coarse-grained (CG) Ni powders with different volume fractions. The notations of the samples are explained in the text. The volume fraction of the CG component is also indicated. (b) The yield strength values obtained from the stress–strain curves in (a). Reprinted from G. Dirras, J. Gubicza, S. Ramtani, Q.H. Bui, T. Szilágyi, Microstructure and mechanical characteristics of bulk polycrystalline Ni consolidated from blends of powders with different particle size, Materials Science and Engineering A 527 (2010) 1206–1214 with permission from Elsevier.

Figure 7.27 The nanohardness distributions for (a) coarse-grained (CG) specimen, (b) sample A, (c) sample B, and (d) ultrafine-grained (UFG) specimen. Reprinted from G. Dirras, J. Gubicza, S. Ramtani, Q.H. Bui, T. Szilágyi, Microstructure and mechanical characteristics of bulk polycrystalline Ni consolidated from blends of powders with different particle size, Materials Science and Engineering A 527 (2010) 1206–1214 with permission from Elsevier.
It can be seen from Fig. 7.27 that the hardness distributions for samples A and B are asymmetric having long tail in the higher hardness region. This tail part is most probably related to the UFG component of the microstructure. The low-hardness part of the distribution is assumed to be related to the CG component. The mean hardness of the CG component is determined by averaging the lowest hardness values up to the 61% and 39% of the total number of indentations for samples A and B, respectively (these are the relative fractions of the CG components). The mean hardness of the UFG component is estimated by averaging 39% and 61% of hardness numbers having the highest values for samples A and B, respectively. The hardness values of the CG and UFG components for different samples are plotted in Fig. 7.28. The hardness of the fully CG sample is lower than that for the CG fraction in sample A which is lower than the hardness of the CG component in sample B [87]. This can be explained by the decrease of the grain size in the CG component with increasing UFG volume fraction as discussed in details in Chapter 5 (“barrier effect”). It should be noted that the relative number of indents located in the CG grains may differ slightly from the volume fraction of the CG component which may result in slight deviation of the calculated mean hardness from the real value. It should be also noted that some hardness values measured in the CG grains may be affected by the hardness of the UFG grains and vice versa as the size of an indent is determined by the strength of a volume around the indent having a radius of about 20 times the penetration depth (this depth was 100–250 nm). For example, close to the interfaces between the CG and UFG grains the hardness of the CG grains may be higher than in the center of the CG grains or the hardness of the UFG component may be lower if there is a CG grain under the measured UFG region.

Figure 7.28 The nanohardness of the coarse-grained (CG) and ultrafine-grained (UFG) fractions and their volume-weighted average as a function of the volume fraction of the UFG component for the as-processed specimen CG, sample A, sample B, and specimen UFG. The dashed line represents the linear interpolation between the values characteristic for the fully CG and UFG samples. Reprinted from G. Dirras, J. Gubicza, S. Ramtani, Q.H. Bui, T. Szilágyi, Microstructure and mechanical characteristics of bulk polycrystalline Ni consolidated from blends of powders with different particle size, Materials Science and Engineering A 527 (2010) 1206–1214 with permission from Elsevier.
Fig. 7.28 shows that in the composite samples the hardness of the UFG component is lower than that in the fully UFG sample, and it seems that the higher the CG fraction, the lower the hardness of the UFG component [87]. This can be explained by the “shielding effect” of the CG grains on the UFG volumes during sintering as discussed in Chapter 5. As a result of this effect, the dislocation density is smaller and therefore the hardness is lower in the UFG components of samples A and B than in the fully UFG specimen. The “shielding effect” of the CG component may also yield incomplete particle bonding within the UFG component, which also contributes to the lower hardness. In the case of sample B, the lower hardness of the UFG component may be partially caused by the lower relative mass density which is most probably associated with a higher porosity due to the lower temperature and shorter duration of sintering (see Chapter 5). The smaller hardness of the UFG component in samples A and B compared to the fully UFG specimen is primarily responsible for the smaller hardness and yield strength of the composite samples than the values interpolated from the data characteristic for the fully CG and UFG samples (see Fig. 7.26b and 7.28).
The addition of coarse particles to the UFG matrix influences both strength and ductility of the materials sintered from blends of powders with very different particle sizes [88–90]. It was shown for both Al–7.5% Mg and 5083 Al alloy (Al–4.2 wt.% Mg–0.67 wt.% Mn) that the strength decreased while the strain to failure decreased with increasing the CG fraction in the sintered materials. In the case of Al–7.5% Mg alloy, spray atomized powder was cryomilled at −190 °C for 8 h, and then it was blended with 15 and 30 wt.% unmilled powder [88]. The unmilled powder served as the CG component of the microstructure. The cryomilled and unmilled powders had grain sizes of 20 nm and 4–40 μm, respectively. The powder blends were sintered in two steps. First, HIP was applied at 325 °C and 175 MPa. Then, the HIP-processed billets were extruded with the extrusion ratio of 6.5:1. The final bimodal microstructure comprised an UFG matrix with a grain size of 100–300 nm and embedded CG bands with a grain size of ∼1 μm. The yield strength, ultimate tensile strength, and strain to failure as a function of CG powder fraction in bimodal Al–7.5% Mg alloy are shown in Fig. 7.29. The yield strength reduced only by 15% while the ductility increased by a factor of ∼4 due to the addition of 30 wt.% CG powder to the NP. In the case of the 5083 Al alloy, spray-atomized powder was cryomilled in a liquid nitrogen slurry [89]. Then, the cryomilled powder was blended with 15%, 30%, and 50% unmilled CG powder. The powder blends were canned under inert atmosphere and consolidated by cold isostatic pressing at a pressure of 400 MPa. The consolidated compacts were degassed in vacuum at a temperature of 673 K. To remove the remaining porosity, the consolidated billets were extruded at a temperature of 823 K and then swaged at a temperature of 723 K. The average grain sizes in the UFG matrix and the embedded coarse grains in the consolidated bimodal samples were ∼200 nm and ∼1 μm, respectively. The yield strength, ultimate tensile strength, and strain to failure as a function of CG powder fraction in bimodal 5083 Al alloy are shown in Fig. 7.29. The addition of 50% CG powder to the cryorolled NP resulted in a reduction of the yield strength by 44% while the tensile strain to failure increased with a factor of ∼8.
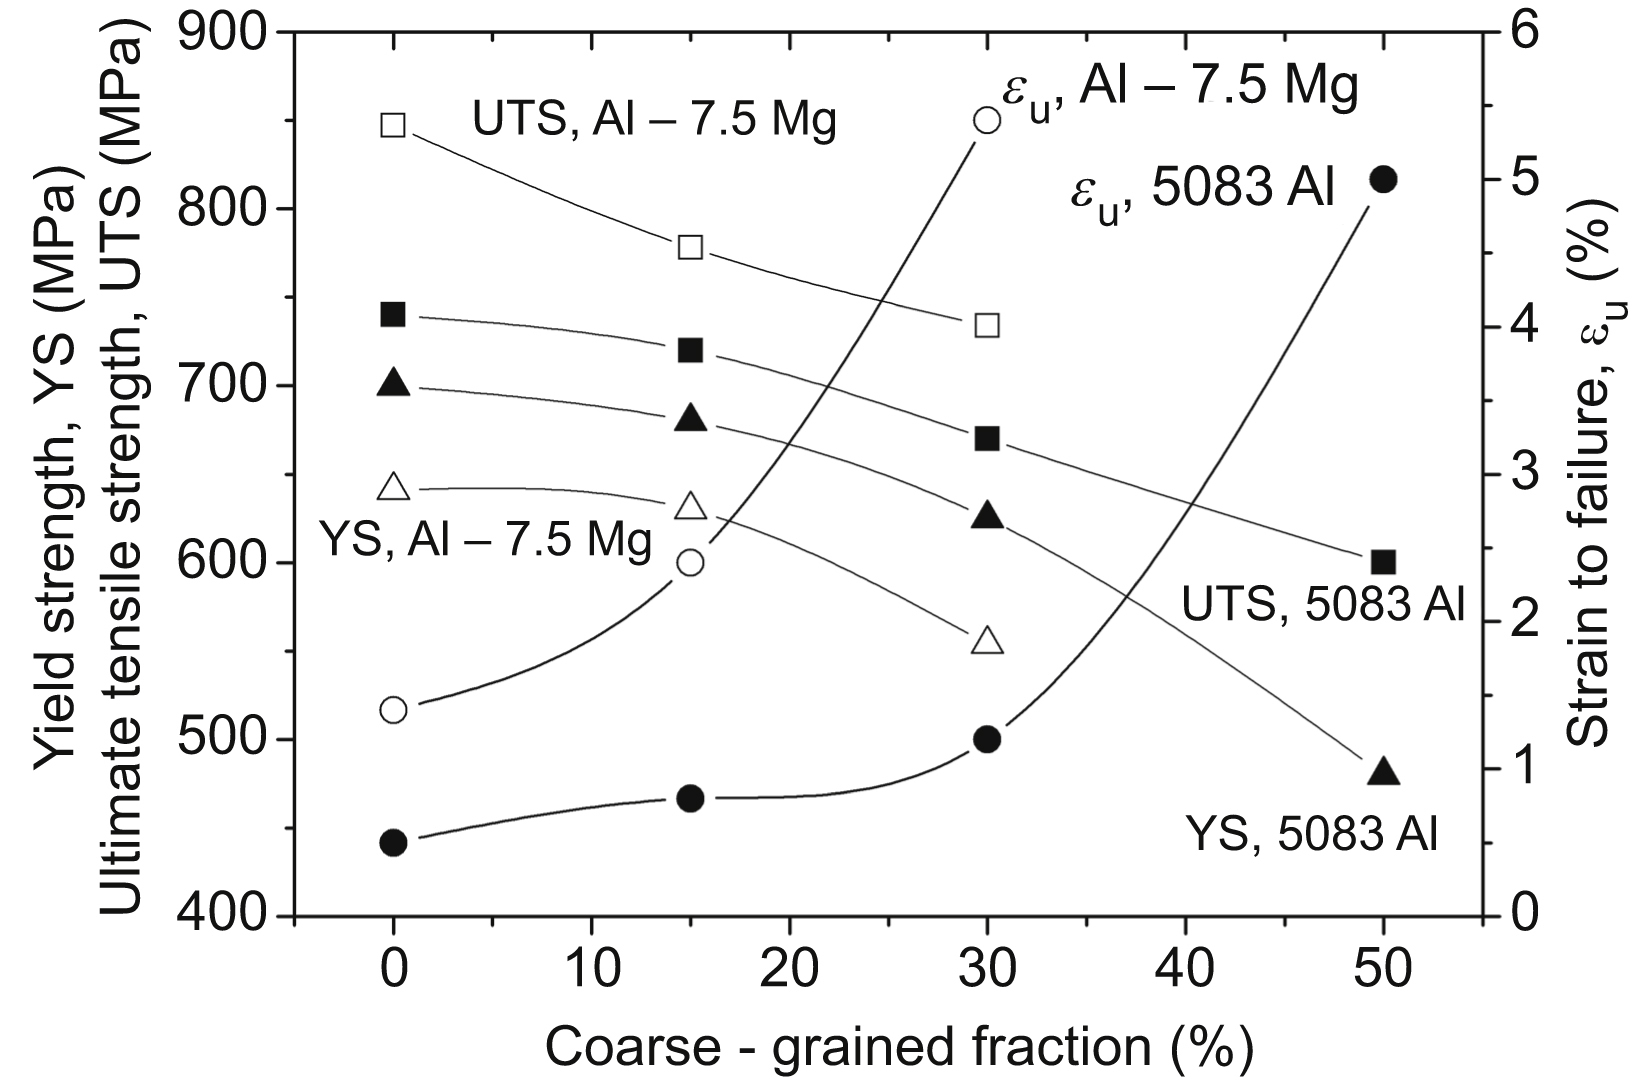
Figure 7.29 The yield strength, ultimate tensile strength, and strain to failure as a function of coarse-grained powder fraction for bimodal Al–7.5% Mg and 5083 Al alloys consolidated from blends of cryomilled NPs and unmilled coarse particles. The data were taken from D. Witkin, Z. Lee, R. Rodriguez, S. Nutt, E. Lavernia, Al–Mg alloy engineered with bimodal grain size for high strength and increased ductility, Scripta Materialia 49 (2003) 297–302; B.Q. Han, Z. Lee, D. Witkin, S.R. Nutt, E.J. Lavernia, Deformation behavior of bimodal nanostructured 5083 Al alloys, Metallurgical and Materials Transactions A 36 (2005) 957–965.
7.7. Defect Structure and Mechanical Performance of Nanomaterials at High Strain Rates
The annihilation of dislocations during SPD is controlled by thermally activated mechanisms, such as vacancy migration, therefore the decrease of processing temperature and the increase of strain rate are expected to yield a higher dislocation density, thereby enhancing the strength of plastically deformed metals. The combined influence of these two effects is usually measured by the Zener–Hollomon parameter (Z), given as Z=˙εeQkT , where ˙ε is the strain rate given in the unit s−1, Q is the activation energy of the mechanism controlling the rate of deformation, k is the Boltzmann constant, and T is the absolute temperature. Indeed, experiments showed that the grain size decreased and the dislocation density increased with increasing the value of Z, resulting in a higher yield strength and a reduced ductility (e.g., for Cu see Ref. [91]). As a consequence, high strain rate deformation methods are expected to be very effective in processing UFG metallic materials with very high strength. In addition, plastic deformation at high strain rates naturally occurs in projectile impact and explosion processes. Therefore, there is a demand for a better understanding of the deformation behavior of UFG and nanocrystalline materials at high strain rates. Different dynamic plastic deformation techniques, such as drop mass bench [92], air hammer [93], split Hopkinson pressure bar, and direct impact Hopkinson pressure bar (DIHPB) [94,95] tests, have been developed for studying the mechanical performance of materials at strain rates between 103 and 105 s−1. It was found that these techniques are capable for refining the grain structure to the UFG regime in very short times (typically in a millisecond) [92,96].

Figure 7.30 The flow stress at the strain of ε = 0.05 versus the logarithm of the strain rate for both CG-Zn and UFG-Zn. CG, coarse-grained; UFG, ultrafine-grained. Reprinted from G. Dirras, J. Gubicza, H. Couque, A. Ouarem, P. Jenei, Mechanical behaviour and underlying deformation mechanisms in coarse- and ultrafine-grained Zn over a wide range of strain rates, Materials Science and Engineering A 564 (2013) 273–283 with permission from Elsevier.
The influence of high strain rate on the strength of the UFG microstructure was investigated for different materials [97,98]. Fig. 7.30 shows the strain rate dependence of the flow stress measured by compression at a strain of 0.05 for UFG-Zn sintered from a NP using SPS method [98]. For comparison, the data for an as-cast coarse-grained Zn (CG-Zn) material is also shown. For strain rates lower and higher than ∼10−1 s−1, the flow stress values were measured by quasistatic compression and DIHPB test, respectively. For the sake of clarity, the strain rates refer to their initial values in the beginning of deformation for both quasistatic or dynamic compression experiments. A TEM study and an X-ray line profile analysis indicate that both the crystallite and the grain sizes are about 200 nm in the as-consolidated UFG-Zn samples. At the same time, the average size of the grains in CG-Zn is about 780 μm. X-ray diffraction revealed the presence of ZnO phase in the as-consolidated UFG-Zn with the fraction of 9 ± 1% and the average particle size of ∼20 nm. Fig. 7.30 shows that the flow stress increases with increasing strain rate for both UFG-Zn and CG-Zn. At very low strain rates, the flow stress values are similar for the two materials despite the very large difference between their grain sizes. At the same time, for UFG-Zn the increase of strain rate yields larger hardening than for CG-Zn. These two observations can be explained by a significant contribution of grain boundary controlled mechanisms (e.g., grain boundary sliding) in plastic deformation of UFG-Zn. Although the grain size is not very small (about 200 nm), the low melting point of Zn may yield operation of grain boundary sliding during low strain rate compression. This assumption is confirmed by the relatively high strain rate sensitivity of UFG-Zn (m = 0.18) measured at low strain rates [98]. This value is close to the strain rate sensitivity of 0.15 determined previously for a Zn sample with the grain size of 238 nm consolidated from ball-milled powder [99]. It is noted that the value of m for CG-Zn is 0.12. Besides grain boundary sliding, dislocation motion and multiplication also contribute to deformation at strain rates above ∼10−1 s−1 as revealed by the evolution of the dislocation density in Fig. 7.31. The dislocation density increased from ∼0.7 × 10¹⁴ to ∼1.4 × 10¹⁴ m−2 in this strain rate regime while the crystallite size was refined from ∼200 to 80–120 nm. Fig. 7.30 reveals that the increase of strain rate causes a higher enhancement in flow stress for UFG-Zn than CG-Zn. With increasing strain rate, the dislocation controlled deformation mechanisms in UFG-Zn become dominant, and the higher obstacle density (e.g., due to the smaller grain size and the larger ZnO content) yields higher strength compared to CG-Zn at strain rates larger than ∼10−1 s−1. The maximum flow stress achieved at the highest applied strain rate of ∼104 s−1 is about 850 MPa for UFG-Zn which is much higher than that for CG-Zn (∼690 MPa) [98].
Fig. 7.30 reveals that the flow stress for CG-Zn increases steeply with increasing strain rate above ∼103 s−1, which is often explained by the viscous drag of dislocations [100]. In this case, the force acting on a dislocation (τb) is proportional with the dislocation velocity (v) as
τb=vB,
![]() (7.17)
(7.17)
where τ is the shear stress acting on the dislocation in the glide plane in the direction of the Burgers vector, b is the magnitude of the Burgers vector, and B is the drag coefficient [100]. The drag coefficient B can be given as [100]
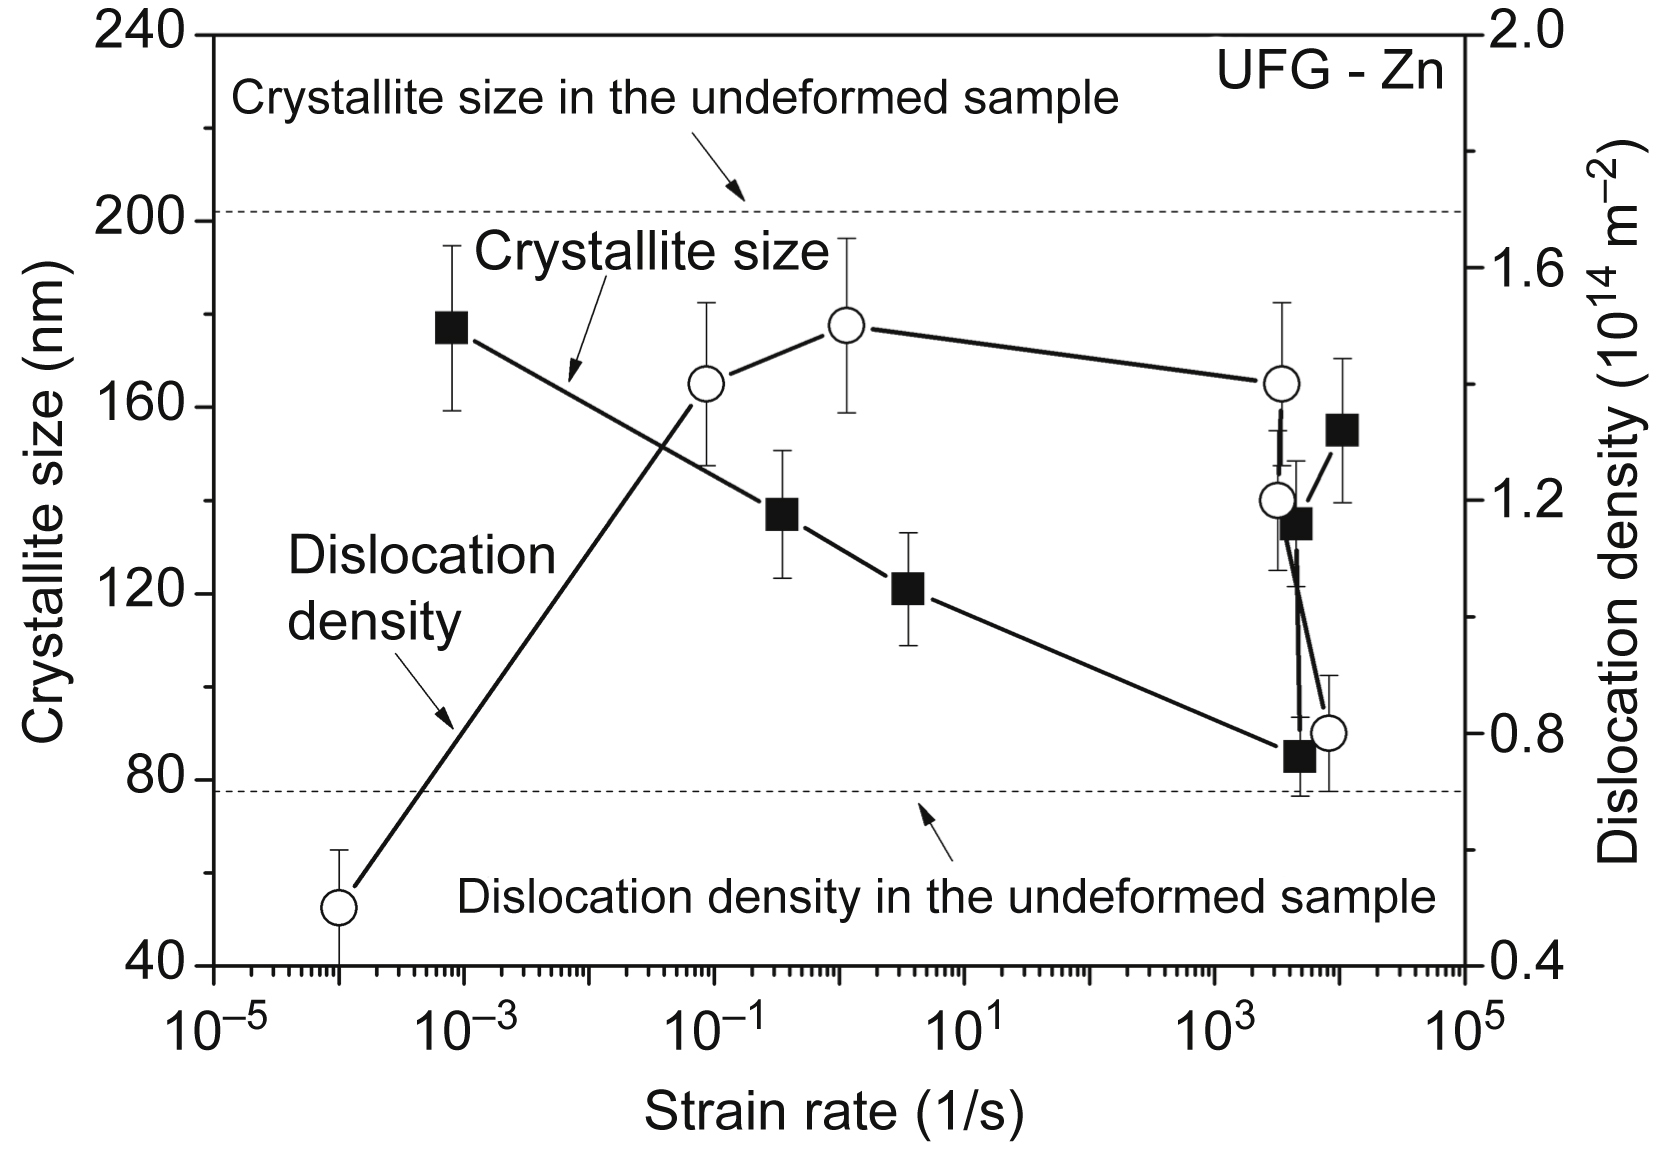
Figure 7.31 Evolution of crystallite size and dislocation density in ultrafine-grained (UFG)-Zn sintered from nanopowder due to compression as a function of strain rate. The dashed lines indicate the crystallite size and the dislocation density in the as-sintered material. The data were taken from G. Dirras, J. Gubicza, H. Couque, A. Ouarem, P. Jenei, Mechanical behaviour and underlying deformation mechanisms in coarse- and ultrafine-grained Zn over a wide range of strain rates, Materials Science and Engineering A 564 (2013) 273–283.
B=Be+Bp(T300),
![]() (7.18)
(7.18)
where T is the absolute temperature of deformation and the coefficients Be and Bp are associated with electron and phonon drags, respectively. The Bp is about one order of magnitude larger than Be, therefore the former one gives the main contribution to B at RT. The average velocity of dislocations can be related to the strain rate as
v=M˙ερmb,
![]() (7.19)
(7.19)
where ρm is the mobile dislocation density and M is the Taylor factor. Viscous drag is the dominant deformation mechanism if the dislocation velocity is higher than 0.1 × cs, where cs is the transversal sound velocity (the upper limit of dislocation velocity which is 2370 m/s for Zn). For UFG-Zn the steep increase of the flow stress was not observed even at very high strain rates (see Fig. 7.30), suggesting that viscous drag effects are negligible for this material. The lack of dislocation drag phenomenon in UFG-Zn can be explained by the relatively large dislocation density (∼1014 m−2 as shown in Fig. 7.31) and the small grain size (∼200 nm), as both dislocations and grain boundaries hinder the acceleration of dislocations to very high velocities which is necessary for the occurrence of viscous drag effects [98]. The velocity of dislocations in UFG-Zn is about 1 m/s (∼10−3 × cs) for the highest applied strain rate (∼104 s−1), as can be estimated from Eq. (7.19) with the assumption that the mobile dislocation density has the same order of magnitude as the total dislocation density (∼1014 m−2). Due to the high dislocation density in UFG-Zn, the high strain rate can be achieved by a slower motion of dislocations. The observed difference between the stress and strain-rate characteristics of UFG-Zn and CG-Zn at very high strain rates is in accordance with the results obtained for an electrodeposited nanostructured copper [101]. It is noted that during quasistatic straining of CG-Zn at RT in addition to dislocation slip, twinning also operates as it has been shown in previous works [102,103]. For UFG-Zn, considerable twinning activity was not observed at either low or high strain rate [98].
During high strain rate plastic deformation, the temperature of the compressed sample usually increases significantly, which influences the value of B according to Eq. (7.18). In addition, recovery and recrystallization may occur in the material due to the rise of temperature. Assuming that 90% of the plastic work (Wp) transforms into heat in an adiabatic compression, the increase of the sample temperature (ΔT) can be estimated from the following formula [98]:
ΔT=0.9Wpρmasscp,
![]() (7.20)
(7.20)
where ρmass is the mass density and cp is the specific heat. The plastic work can be determined from the stress–strain data, and using this value the calculated temperature rise is about 100–200 K at the highest applied strain rate (∼104 s−1). However, due to the high heat conductivity of the tungsten bars used as projectile and transmitted bars in the DIHPB set up, this temperature decreased very quickly to RT. Namely, this cooling period can be estimated as [98]:
Δt=ΔQxkAΔT,
![]() (7.21)
(7.21)
where the heat reduction of ΔQ equals to 0.9 Wp, k is the thermal conductivity, x is the thickness, and A is the area of the sample surface contacted with the bars at the end of compression. The cooling period obtained from Eq. (7.21) is about 5 × 10⁻² s which is much larger than the duration of compression (∼10−4 s). Therefore, first the temperature increases by about 100–200 K during DIHPB test, then it decreases to RT very quickly. The significant increase of the sample temperature most probably yields recovery of the microstructure which may be the reason of the reduction of the dislocation density and the increase of the crystallite size with increasing strain rate above ∼103 s−1 (see Fig. 7.31). These observations are also valid for other UFG materials.
For bimodal microstructures consisting of UFG and CG volumes, steep increase of flow stress can be observed at strain rates higher than ∼103 s−1 due to viscous drag effect in the CG regions, as demonstrated for impacted Ni in Ref. [97]. The material was sintered from a blend of Ni powders with nanometer- (∼50 nm) and micrometer- (∼5 μm) sized particles using SPS technique. The equivalent strain was about 1–2 at the end of the impact test. During impact deformation, there are dislocation multiplication and grain refinement in the CG volumes which yield hardening in these regions, as detected by nanoindentation. Simultaneously, the UFG regions soften due to formation of microcracks. Most probably, these cracks are formed due to the hindered plasticity and the incomplete particle bonding in the UFG volumes. The latter effect may be caused at least partially by the oxide phase at the UFG grain boundaries. Owing to hardening of the initially softer CG regions and softening of the harder UFG volumes, the initial bimodal nanohardness distribution becomes more homogeneous with increasing strain rate [97].
..................Content has been hidden....................
You can't read the all page of ebook, please click here login for view all page.