
Chapter 8
Defect Structure and Properties of Metal Matrix–Carbon Nanotube Composites
Abstract
Carbon nanotubes (CNTs) are promising disperse phase in metal matrix composites because of their high aspect ratio, elastic modulus and strength may yield to an increase of both Young's modulus and strength of the metallic ultrafine-grained matrix. In this chapter, the processing methods, the defect structure as well as the mechanical and electrical conductivity properties of metal matrix–CNT composites are overviewed. It is revealed that the high dispersity of CNTs and the strong interfacial bonding in the matrix are the most important criteria for processing composites with high strength and good ductility. The correlation between the flow stress and the dislocation density for Cu-CNT composites suggests that the CNT fragments strengthen the composite rather indirectly via the increase of the dislocation density. The conductivity and the strength-to-resistivity ratio are improved considerably with the addition of CNTs.
Keywords
Carbon nanotube; Composite; Dislocations; Electrical conductivity; Elongation to failure; Metal matrix; Strength; Twinning
8.1. Processing of Metal Matrix–Carbon Nanotube Composites
Carbon nanotubes (CNTs) have unique structure that gives special properties such as (1) extremely high elastic modulus (∼1 TPa), (2) large strength (∼40 GPa), (3) high aspect ratio (∼100–1000), (4) very low density (1.5–2 g/cm3), (5) excellent chemical and thermal stabilities (up to 750 and 2800 °C in air and vacuum, respectively), and (6) high thermal and electrical conductivities (thermal conductivity about twice as high as diamond, electric current–carrying capacity 1000 times higher than copper wires) [1,2]. In particular, this combination of properties makes CNTs ideal candidates as advanced filler materials in composites. The addition of CNTs into polymers or ceramics can yield significant increase of their conductivity resulting in conductive or antistatic polymer or ceramic composites. Even at low volume fractions of CNTs, they form a continuous network in the matrix, i.e., they have low percolation thresholds due to their high aspect ratio. For comparison, the percolation thresholds for conventionally used carbon black filler materials and CNTs are ∼16 and ∼0.01 vol.%, respectively. Taking advantage of their excellent conductivity and high aspect ratio, conductive polymers and ceramics can be produced with very low volume fractions of CNTs. For example, the electrical conductivity of alumina increased by a factor of 1015 with addition of 5.7 vol.% CNTs [2]. Another promising application of CNTs is their incorporation as reinforcing fillers into plastic [3], ceramic [4], and metal matrix [5] composites. The application of CNTs as a strengthening disperse phase in composites is very prosperous compared to other materials as they have high hardening effect even for low volume fractions due to their high aspect ratio. Although, different polymer–CNT composites have been synthesized successfully, producing metal matrix–CNT composites is rather challenging mainly due to the poor interfacial bonding between CNTs and metal matrix, as well as due to the agglomeration of CNTs in the interfaces of matrix particles. In this chapter, we focus on metal matrix–CNT composites where the matrix exhibits ultrafine-grained or nanocrystalline microstructure. First, a short survey of the processing routes of metal matrix–CNT composites is given.
Metal matrix–CNT composites are usually produced by powder metallurgy techniques [5–17], although electrodeposition [18] is also applied for this purpose. The powder metallurgy way has the following steps: (1) purification of CNTs by washing with acids to remove the amorphous carbon particles, (2) blending of CNTs with the powder of the metal matrix by high-energy milling, (3) precompaction of the blend, e.g., by cold isostatic pressing [13,17], and (4) consolidation to high density, e.g., by extrusion [10], rolling [9], high-pressure torsion (HPT) [16,17], shock-wave consolidation [7], or sintering [15]. In some cases, the purification and precompaction steps are missing. For instance, precompaction is not needed when the blend of metallic powders and CNTs are consolidated by plasma spray forming [19,20]. In this case, the metallic powder particles act as carrier of the lightweight CNTs during the spraying. The powder particles melt in the high-temperature plasma and are directed toward a rotating mandrel where they deposit and rapidly cool forming the desired shape as depicted in Fig. 8.1 [19]. It has been also shown that a modification of the accumulative roll-bonding may be used to disperse CNTs into an aluminum alloy [21]. After degreasing the aluminum and wire brushing the surfaces, the sheets were coated once with the concentrated CNT suspension and allowed to dry. The sheets were then stacked together making a 2.8-mm-thick sandwich that was accumulatively roll bonded four times at room temperature (RT) [21].
Metal-based CNT composites prepared by powder metallurgy process often show lower mechanical properties than expected, which is attributed to CNT agglomeration and also to some porosity in the composites. It is confirmed that the key issue to enhance the strength of CNT/metal nanocomposite is the homogeneous distribution of CNTs during the blending step [6]. The inhomogeneous dispersion of nanotubes in the blends yields clustering of CNTs as shown in Fig. 8.2 [20]. CNT clusters prevent sufficient bonding between the matrix particles, leading to fine pores and cracks in the nanocomposite. Subsequently, these fine cracks and pores act as nucleation sites for plastic instability, which account for the significant degradation of strain to failure of metal matrix–CNT composites [20]. The dispersion of the nanotubes can be improved by increasing the energy of milling during the mixing step of processing [11]. However, high-energy ball milling may yield damage of CNTs and reduction of their high aspect ratio which deteriorate the functional properties of CNT composites. Another strategy for increasing the dispersion of CNTs in the matrix material is the treatment of CNTs by surfactants [10]. For instance, sodium dodecyl sulfate (SDS) surfactant decreases the van der Walls force of attraction between CNTs. When ionic SDS is used as surfactant, the negative charges in SDS micelles that absorb on nanotubes prevent reaggregation of CNTs, thereby dispersing the CNTs in the matrix [10].

Figure 8.1 Schematic of plasma spray forming of a blend of Al–Si powder and CNTs. CNT, carbon nanotube. After T. Laha, A. Agarwal, T. McKechnie, S. Seal, Synthesis and characterization of plasma spray formed carbon nanotube reinforced aluminium composite, Materials Science and Engineering A 381 (2004) 249–258 with permission of Elsevier.

Figure 8.2 SEM image of fracture surface of plasma spray formed Al-CNT nanocomposite showing intergranular fracture and cluster of CNTs. CNT, carbon nanotube. Reprinted from T. Laha, Y. Chen, D. Lahiri, A. Agarwal, Tensile properties of carbon nanotube reinforced aluminium nanocomposite fabricated by plasma spray forming, Composites: Part A, Applied Science and Manufacturing 40 (2009) 589–594 with permission from Elsevier.
Functionalization of nanotubes by the atoms of the metal matrix is a very effective way to reach the high dispersity of CNTs in the matrix [15]. Additionally, in the functionalized nanotubes there is a strong interfacial bond between the atoms of CNTs and the matrix that may lead to an enhancement in mechanical properties. This “molecular level mixing” procedure involves the following steps: (1) attaching functional groups (e.g.,  COOH, COCl, or NO2 atomic group) onto the CNT surfaces, (2) suspending functionalized CNTs in a solvent (e.g., in water or ethanol), (3) mixing a salt containing Cu ions [e.g., copper acetate: Cu(CH3COO)2] with the CNT suspension that results in reaction between the Cu ions and the functional groups (see Fig. 8.3), (4) drying the solution by heating at 100–250 °C in air to remove the solvent and the ligands and oxidize Cu on CNTs to form copper oxide powder, and (5) calcination and reduction to Cu-CNT composite in hydrogen atmosphere [15]. This process produces Cu-CNT composite powders, whereby the CNTs are homogeneously implanted within the Cu powders as depicted schematically in Fig. 8.4. Finally, the Cu-CNT composite powders are consolidated by spark plasma sintering. As this process mixes Cu and CNTs at the molecular level, the dispersity of CNTs in the sintered composite is very high. The CNTs form a homogeneously distributed network within the Cu grains [15].

Figure 8.3 Schematic figure depicting the attachment of Cu ions to the functional groups on the surface of a CNT for the “molecular level mixing” process of Cu-CNT composite powders. CNT, carbon nanotube.
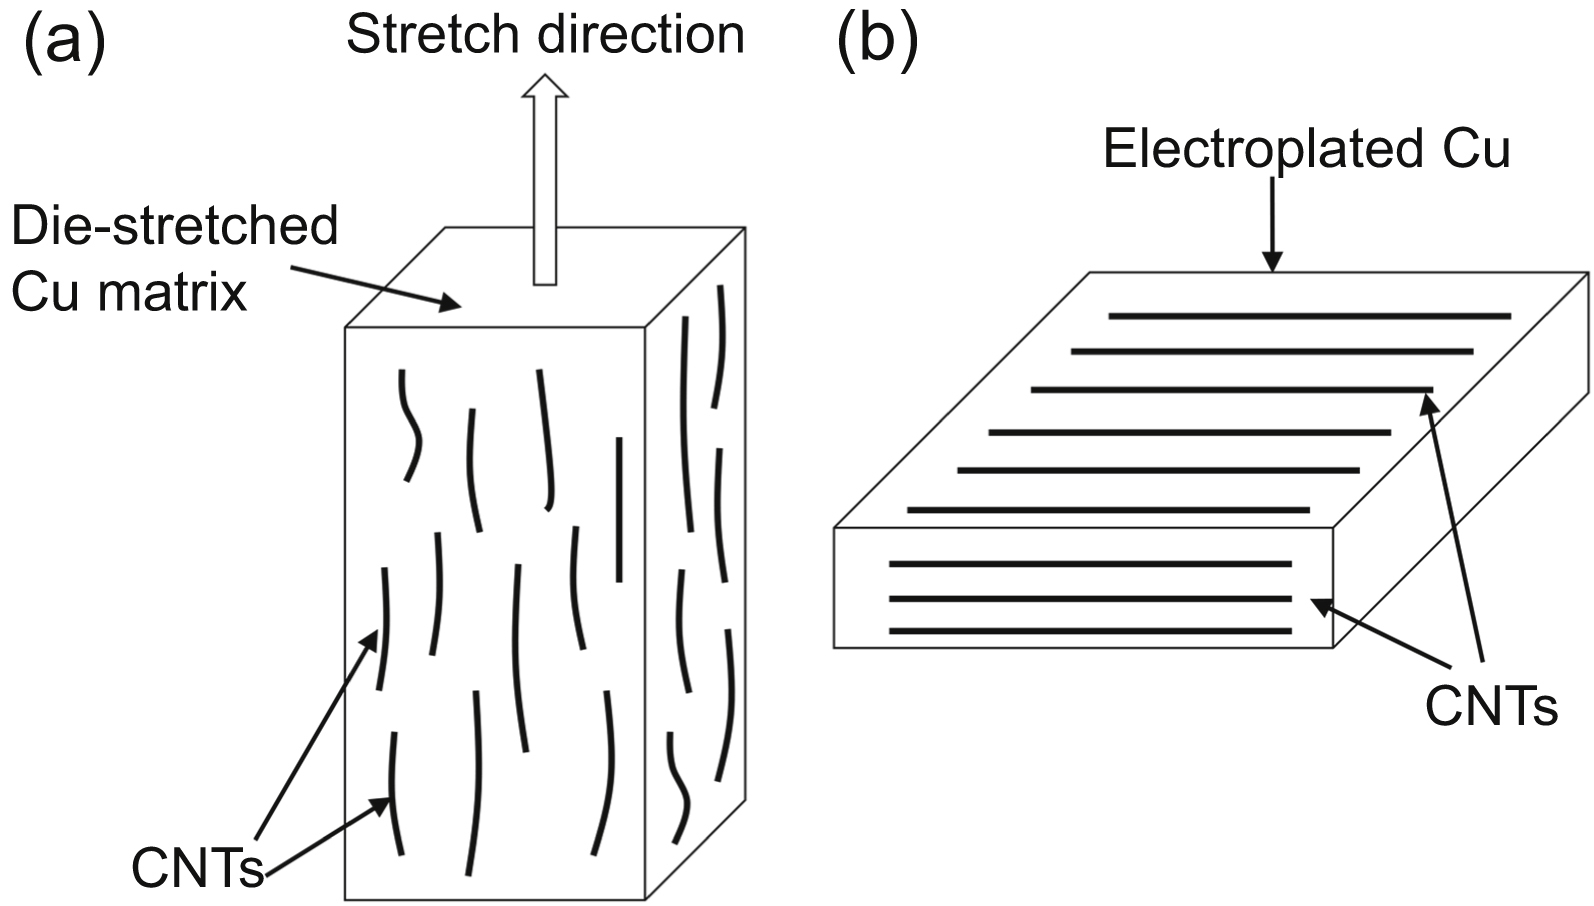
Strong interfacial bonding between CNTs and the Cu matrix can also be achieved by electroless plating of Ni/Cu bilayers on single-walled CNTs [22]. Electroless nickel plating is an autocatalytic reaction that deposits Ni layer on a substrate without the application of electric current. First a Ni layer is deposited on CNTs, which is then covered by Cu. The diameter of CNTs increases to about 250 nm due to electroless plating of Ni/Cu bilayers. The coated CNTs are dispersed in alcohol using ultrasonic method and then mixed with Cu powder. In the next step, the slurry is mechanically stirred and dried. After sintering the composite, the samples are forged and die-stretched, leading to an aligned CNT arrangement in the Cu matrix in which the nanotube axes are lying parallel to the stretch direction, as shown in Fig. 8.5a [22]. This method avoids damage of CNTs during processing of composites and assures strong interfacial bonding between nanotubes and the Cu matrix. The aligned arrangement of CNTs yields anisotropy in mechanical behavior, as well as in electric and thermal conductivities. In the stretch direction the tensile strength, thermal, and electric conductivities are 16%, 11%, and 9% higher, respectively, than in the perpendicular directions. Superaligned CNT-reinforced copper matrix laminar composites can be fabricated by means of electroplating process [23,24]. First, thin films of parallel multiwalled CNTs (MWNTs) are processed in which the attractive interaction between CNTs is caused by Van der Waals forces. Then, these films are electroplated by Cu, forming laminar Cu-CNT composites with the thickness of 60–80 μm. In these composites the nanotubes have highly oriented structure, in which the axes of CNTs are all lined up in one direction, as shown in Fig. 8.5b. This arrangement of CNTs leads to anisotropic behavior of the composite. It is noted that the laminar Cu-CNT composites processed by electroplating exhibits poor strength, although CNT addition improves the mechanical performance compared with pure Cu manufactured by the same technique. The relatively low strength is caused mainly by the weakness of the Cu matrix.

8.2. Morphology of Carbon Nanotubes and Porosity in Nanotube Composites
CNTs are used as a disperse phase in metal matrix nanocomposites with the fraction of 0.5–12 vol.%. In the X-ray diffractograms obtained on metal–CNT composites processed by powder metallurgy, peaks of CNTs are often not detected. This can be explained by the very small amount of CNTs and their fragmentation during blending with the metallic powders by high-energy milling and in further consolidation by severe plastic deformation. As an example, Fig. 8.6 shows a high-resolution transmission electron microscopy (HRTEM) image obtained on a Cu-CNT composite processed from micron sized Cu particles and 3 vol.% MWNTs by high-energy milling and subsequent two-step consolidation procedure including cold isostatic pressing and HPT at RT [17]. Complete MWNTs were not observed in the consolidated sample. At the same time, small graphite-like fragments were revealed from the interlayer spacing (about 0.34 nm). Both straight and curved CNT fragments were observed as indicated by the arrows in Fig. 8.6. HRTEM images of other Cu-CNT composites consolidated by HPT indicate the presence of CNTs or their fragments both at the grain boundaries and inside the Cu grains [5].

Figure 8.6 High-resolution transmission electron microscopy image taken at the half-radius of the Cu–CNT-RT disk. The arrows indicate fragments of CNTs. CNT, carbon nanotube. Reprinted from P. Jenei, E.Y. Yoon, J. Gubicza, H.S. Kim, J.L. Lábár, T. Ungár, Microstructure and hardness of copper-carbon nanotube composites consolidated by High Pressure Torsion, Materials Science and Engineering A 528 (2011) 4690–4695 with permission from Elsevier.
It was found for Al-CNT composites that during the milling step, the impact energy of the balls could induce the infiltration of Al atoms through the inherent atomic defects on the wall of MWNTs [9]. After milling for 6 h, the nanotubes seem to be filled with Al atoms, leading to the irregular shape of MWNTs [9]. As a consequence, the diameter of MWNTs increased from ∼10 to ∼35 nm.
In some cases, beside the metal matrix and CNTs other phases are also detected in the consolidated composite. For instance, in Cu-CNT composites processed by HPT X-ray diffraction analysis revealed the presence of copper oxide [17]. In the initial Cu powder, additional phase beside Cu was not detected. At the same time, in the center of the HPT disks processed from the blend of Cu powder and CNTs at both RT and 373 K a small amount of Cu2O with a relative intensity of 1% was observed. At the half-radius and the periphery of these disks, oxide phase was not detected [17]. Most probably, the Cu2O phase was formed by surface oxidation of the Cu particles during the high-energy mixing process of the Cu powder and CNTs. This oxide phase may be decayed due to severe plastic deformation by HPT that can explain its absence at the half-radius and the periphery of the disks where the imposed strain is much higher than in the center. In Al-CNT composites, Al4C3 carbides are formed in the reaction of CNTs and Al slightly above the melting temperature of Al [13]. Interfacial Al4C3 compound deteriorates the mechanical properties of Al-CNT composites, therefore the reaction of Al and CNTs should be avoided and the fabrication temperature of Al-CNT composites should be kept below the Al liquidus [13].
Most of the processes of metal–CNT composites are based on powder metallurgy, therefore the remaining porosity is an important factor in the determination of the mechanical performance of composites. The porosity of the consolidated samples is usually determined by density measurements using Archimedes' principle. According to the experimental results, the remaining porosity in consolidated metal matrix–CNT composites is usually between 1 and 3 vol.% [17].
8.3. Defect Structure in Metal–Nanotube Composites
The effect of CNTs on the lattice defect structure in metal matrix composites is illustrated on the example of Cu-CNT composites consolidated by HPT at RT and 373 K [17]. Cu powder of 99.5% purity with particle sizes less than 44 μm and 3 vol.% MWCNTs were mixed by high-energy milling. The diameter and the length of CNTs produced by catalytic chemical vapor deposition were 5–20 nm and 1–10 μm, respectively. The powder blend was precompacted by cold isostatic pressing. The precompacted disks were consolidated by HPT at RT and 373 K. The applied pressure and the number of revolutions were 2.5 GPa and 10, respectively, for all the three samples [17]. To study the effect of CNTs on microstructure, an additional sample was consolidated solely from the Cu powder at RT by the same way as in the case of the composite specimen. In the following, the samples processed from pure Cu, the blend of Cu, and CNTs at RT and 373 K are denoted as Cu, Cu–CNT-RT and Cu–CNT-373, respectively. The microstructure of the HPT-processed samples was investigated at the center, half-radius, and periphery by X-ray line profile analysis. The area-weighted mean crystallite size  , the dislocation density (ρ), and the twin boundary frequency (β) were plotted in Fig. 8.7a–c, respectively. Usually, the crystallite size is larger while the dislocation density and the twin boundary frequency are smaller in the center than at the half-radius or periphery due to the smaller imposed torsional strain. The curves lying on the measured data points in Fig. 8.7a–c are only guides for eyes. They reach the saturation values of the microstructural parameters between the center and the half-radius as suggested by the hardness investigations (see Section 8.4 in this chapter). For comparing the three samples, it is reasonable to use the values of the microstructural parameters determined at the half-radius of the disks.

Figure 8.7 The area-weighted mean crystallite size,  (a), the dislocation density, ρ (b), and the twin boundary frequency, β (c) at the center, half-radius, and periphery of the HPT-processed Cu, Cu–CNT-RT, and Cu–CNT-373 disks. CNT, carbon nanotube. Reprinted from P. Jenei, E.Y. Yoon, J. Gubicza, H.S. Kim, J.L. Lábár, T. Ungár, Microstructure and hardness of copper-carbon nanotube composites consolidated by High Pressure Torsion, Materials Science and Engineering A 528 (2011) 4690–4695 with permission from Elsevier.
The crystallite size, the dislocation density and the twin boundary frequency measured at the half-radius in sample Cu are 60 ± 6 nm, 43 ± 4 × 10¹⁴ m−2, and 0.0% ± 0.1%, respectively [17]. In sample Cu the mean grain size is 173 nm as determined from dark-field TEM images (see Fig. 8.8a). It is noted that in the case of sample Cu, the parameters of the microstructure only slightly change along the radius of the disk, indicating that the microstructure achieved the near saturation state in all locations of the sample. It is also worth to note that the crystallite size determined by X-ray line profile analysis is smaller than the grain size observed by TEM. This phenomenon has been usually observed for plastically deformed metals [25] and it can be attributed to the fact that the crystallite size determined from X-ray line profiles corresponds essentially to the mean size of cells/subgrains, which is usually smaller than the conventional grain size measured in metals by electron microscopy methods [26,27].

Figure 8.8 Dark-field TEM images for samples (a) Cu, (b) Cu–CNT-RT, and (c) Cu–CNT-373. Some twin boundaries in sample Cu–CNT-RT are indicated by white arrows in (d). CNT, carbon nanotube. Reprinted from P. Jenei, E.Y. Yoon, J. Gubicza, H.S. Kim, J.L. Lábár, T. Ungár, Microstructure and 2hardness of copper-carbon nanotube composites consolidated by High Pressure Torsion, Materials Science and Engineering A 528 (2011) 4690–4695 with permission from Elsevier.
The mean crystallite size of the composite sample Cu–CNT-RT (36 ± 4 nm) is half as large as that of pure Cu (60 ± 6 nm), while the dislocation density (111 ± 10 × 1014 m−2) is three times higher in the former sample at the half-radius of the disks (see Fig. 8.7a and b). Fig. 8.8b shows a dark-field TEM image of the grain structure for sample Cu–CNT-RT [17]. The average grain size in this specimen is 74 nm that is about half of the value obtained for pure Cu. The smaller crystallite and grain sizes as well as the much higher dislocation density in sample Cu–CNT-RT can be explained by the pinning effect of CNT fragments on lattice defects (dislocations and grain boundaries) during HPT that is especially significant where the imposed strain is higher, i.e., at the half-radius and the periphery of the disk. The principle of producing nanostructures by HPT is to form subgrain boundaries via dislocation accumulation and rearrangements under severe shear strain. These subgrain boundaries then develop into high-angle grain boundaries, resulting in grain refinement. At the same time, dynamic recovery and recrystallization reduce the dislocation density and may increase the grain size. The balance of these two opposite processes determines the final grain size. With the incorporated CNTs, the dislocation motion is blocked at CNT-Cu interfaces, therefore the dislocation accumulation is enhanced. As a consequence, the addition of CNTs leads to a decrease in grain size [5]. Fig. 8.7c shows that in contrast with the lack of observable twin boundaries in pure Cu, in sample Cu–CNT-RT the twin boundary frequency is high (1.1 ± 0.1%). The pinning effect of CNT fragments in sample Cu–CNT-RT hinders the escape of dislocations from pile-ups during HPT resulting in high stresses at glide obstacles such as Lomer–Cottrel barriers and grain boundaries. If the local stresses at these obstacles exceed the critical stress for twin nucleation, deformation twins are formed (see Chapter 4). Most probably, the small grain size has also contributed to the evolution of the very high twin boundary frequency. As it was shown in previous papers [28], the reduction in grain size of Cu led to an increasing contribution of twinning to plasticity at the expense of dislocation activity (see also Chapter 7). Some twin boundaries in sample Cu–CNT-RT are shown in Fig. 8.8d.
Fig. 8.7a–c reveal that when the Cu-CNT composite was processed by HPT at 373 K the crystallite size (49 ± 5 nm) is larger by 36%, while the dislocation density (66 ± 8 × 10¹⁴ m−2) and the twin boundary frequency (0.3% ± 0.1%) are one-half and one-third of the values obtained after processing at RT, respectively. This can be explained by the higher mobility of lattice defects at 373 K, yielding their easier annihilation during HPT-straining. Fig. 8.8c shows a dark-field TEM image of the microstructure in sample Cu–CNT-373. The average grain size is 83 nm that is larger than the value determined for sample Cu–CNT-RT [17].
8.4. Correlation Between Defect Structure and Mechanical Properties of Nanotube-Reinforced Composites
The extremely high elastic modulus (1 TPa) of CNTs along their axes yields a very large increment of Young's modulus with their addition to the metal matrix. As an example, Fig. 8.9 shows the measured Young's modulus of Al-CNT composites as a function of volume fraction of CNTs [9]. The modulus increases linearly with increasing the volume fraction of MWNTs. The experimental results are compared with the calculated Young's modulus values of the composites that are obtained from the expression [9].
![]() (8.1)
(8.1)
where Ec, ECNT, and Em are the Young's moduli of the composite, CNTs and the matrix, and VCNT and Vp are the volume fractions of CNTs and pores, respectively, and KCNT is a reinforcement factor. For example, if CNTs are randomly oriented within the matrix or they are aligned along the loading direction, KCNT is about 0.2 or 1, respectively [9]. The dashed line in Fig. 8.9 illustrates the moduli calculated from Eq. (8.1) for the case of KCNT = 1 taking ECNT = 1 TPa and Vp = 0. The experimental and calculated values are very well matched, that can be explained by the alignment of CNTs along the loading direction. These Al-CNT composites are consolidated from powder blends by hot rolling [9]. Most MWNTs in the final composites are aligned along the rolling direction, following the macroscopic variation of the powder container during rolling [9]. As in the tensile test the samples were loaded in the rolling direction, therefore CNTs were lying parallel to the loading direction. The Young's modulus values for different metal matrix–CNT composites are listed in Table 8.1. For comparison, the moduli of the matrix materials without CNTs are also given in the table. The ratio of the moduli of the CNT composites and their matrices are plotted as a function of volume fraction of CNTs in Fig. 8.10. The higher CNT content yields larger Young's modulus irrespectively of the matrix composition and the characteristics of CNTs (single- or multiwalled, diameter and length).

Figure 8.9 The Young's modulus and the yield strength as a function of the volume fraction of MWNTs in Al-CNT composites. CNT, carbon nanotube. The data are taken from H. Choi, J. Shin, B. Min, J. Park, D. Bae, Reinforcing effects of carbon nanotubes in structural aluminium matrix nanocomposites, Journal of Materials Research 24 (2009) 2610–2616.
The pinning effect of CNTs on the lattice defects (dislocations, grain boundaries) causes an increment in yield strength as shown in Fig. 8.9 for Al-CNT composites [9]. Table 8.1 lists the yield strength obtained on different metal–CNT composites together with the values determined on the matrix materials. Fig. 8.10 shows that the higher amount of CNTs usually results in larger increment in yield strength. The correlation between the yield strength and lattice defect structure was examined in details on Cu-CNT composites consolidated by HPT [17]. The processing and the defect structure in these materials are presented in Section 8.3 of this chapter. The samples processed from pure Cu, the blend of Cu, and 3 vol.% CNTs at RT and 373 K are denoted as Cu, Cu–CNT-RT, and Cu–CNT-373, respectively. The microhardness as a function of the distance from the center of the HPT-processed disks is plotted in Fig. 8.11a. It can be revealed that the hardness increases with increasing the distance from the center and gets saturated already at about 20% of the radius for all the three samples. The smaller hardness in the center can be explained by the smaller strain imposed during HPT compared to the other locations along the radius of the disk. Despite the linear dependence of the strain on the distance from the center, the hardness varies in a nonlinear manner due to decreasing work hardening with strain that is in agreement with previous observations [8,16]. It is noted that although the saturation hardness values of the Cu-CNT composites are higher than for the pure Cu sample, close to the disk center this relation is reversed (see Fig. 8.11a). It was shown in Section 8.3 that in the three samples near the center the dislocation density values are close to each other; therefore they have similar hardening effects. At the same time, the significant remaining porosity in the composite samples (about 3%) results in hardness reduction. Far from the center, the hardening effect of the much larger dislocation density in the composites overwhelms the influence of porosity leading to higher hardness than for the pure Cu sample. The hardness measured at 350 K also saturated already at about 20% of the radius for all the three samples (not shown here). The saturation hardness values determined at the half-radius of the disks for RT and 350 K are plotted in Fig. 8.11b. For all the three specimens the hardness reduced by about 20% when the temperature increased from RT to 350 K. This means that the relative hardening effect of CNTs was maintained at least till 350 K. The smaller grain size as well as the larger dislocation and twin boundary densities may explain the much higher hardness of specimen Cu–CNT-RT compared to pure Cu. The smaller defect densities and larger grain size in sample Cu–CNT-373 may yield smaller hardness compared with specimen Cu–CNT-RT.
Table 8.1
The features of the matrix and CNTs, the processing method, the Young' modulus, the yield and tensile strengths, and the elongation to failure for different metal matrix–CNT composites
Matrix Material/grain size | CNT characteristics Diameter/length/volume fraction | Processing method | Young's modulus (GPa) | Yield strength (MPa) | Tensile strength (MPa) | Elongation to failure (%) | References |
| Al/600 nm | 2–40 nm/1 μm/2 vol.% | Shock-wave consolidation | – | 130 (133) | – | 1.4 (6.5) | [7] |
| Al/100 nm | 1–2 nm/–/7.3 vol. % (5 wt.%) | Ultrasonic mixing + high-pressure torsion | – | 150 (100) | 210 (150) | 0.5 (0.8) | [8] |
| Al/150 nm | 10 nm/5 μm/1.5 vol.% | Ball milling + hot rolling | 83 (70) | 386 (262) | 391 (282) | 7 (13) | [9] |
| Al/150 nm | 10 nm/5 μm/3 vol.% | Ball milling + hot rolling | 95 (70) | 483 (262) | 491 (282) | 4 (13) | [9] |
| Al/150 nm | 10 nm/5 μm/4.5 vol.% | Ball milling + hot rolling | 110 (70) | 610 (262) | 615 (282) | 2 (13) | [9] |
| Al/1 μm | 10 nm/5–15 μm/0.75 vol.% (0.5 wt.%) | Mechanically mixed/Cold uniaxial pressing/Free-sintering/Hot extrusion | 62 | 114 (91) | 122 (98) | 2.2 (2.5) | [10] |
| Al/1 μm | 10 nm/5–15 μm/1.5 vol.% (1 wt.%) | Mechanically mixed/Cold uniaxial pressing/Free-sintering/Hot extrusion | 66 | 139 (91) | 151 (98) | 3.0 (2.5) | [10] |
| Al/1 μm | 10 nm/5–15 μm/3 vol.% (2 wt.%) | Mechanically mixed/Cold uniaxial pressing/Free-sintering/Hot extrusion | 75 | 176 (91) | 184 (98) | 2.7 (2.5) | [10] |
| Al/– | 140 nm/3–4 μm/0.75 vol.% (0.5 wt.%) | Blending by shaker mixer and planetary mill + hot rolling | 60 (50) | 100 (70) | 144 (130) | 19 (25) | [11] |
| Al/– | 140 nm/3–4 μm/1.5 vol.% (1 wt.%) | Blending by shaker mixer and planetary mill + hot rolling | 40 (50) | 68 (70) | 105 (130) | 7.5 (25) | [11] |
| Al/– | 140 nm/3–4 μm/3 vol.% (2 wt.%) | Blending by shaker mixer and planetary mill + hot rolling | 47 (50) | 44 (70) | 62 (130) | 2 (25) | [11] |
| Al/– | 40–100 nm/10 μm/0.75 vol.% (0.5 wt.%) | Milling + pressureless sintering + hot extrusion | – | 140 (160) | 180 (105) | 12 (20) | [12] |
| Table Continued | |||||||

Matrix Material/grain size | CNT characteristics Diameter/length/volume fraction | Processing method | Young's modulus (GPa) | Yield strength (MPa) | Tensile strength (MPa) | Elongation to failure (%) | References |
| Al/– | 40–100 nm/10 μm/2.2 vol.% (1.5 wt.%) | Milling + pressureless sintering + hot extrusion | – | 190 (160) | 240 (105) | 14 (20) | [12] |
| Al/– | 40–100 nm/10 μm/3 vol.% (2 wt.%) | Milling + pressureless sintering + hot extrusion | – | 180 (160) | 250 (105) | 16 (20) | [12] |
| Al/– | 10–20 nm/10 μm/1 vol.% | Milling + spark plasma sintering + hot extrusion | – | – | 170 (127) | 23 (20) | [29] |
| 93.5% Al – 4.4% Cu −1.5% Mg – 0.6% Mn (2024Al)/200 nm | 20–40 nm/10 μm/1.5 vol.% (1 wt.%) | Ball milling + cold isostatic pressing + extrusion | 88 (71) | 336 (289) | 474 (384) | 3 (16.5) | [13] |
| 74% Al – 23% Si – 2% Ni – 1% Cu/100 nm | 40–70 nm/0.5–2.0 μm/12 vol.% (10 wt.%) | Blending + plasma spray forming | 120 (68) | – | 83 (80) | 0.08 (0.2) | [19,20] |
| Ni/28 nm | 10–30 nm/1–2 μm/– | Electrodeposition | – | – | 1475 (1162) | 2.09 (2.39) | [18] |
| 90% Mg – 9% Al – 0.6% Zn – 0.4% Mn (AZ91D)/10 μm | 100 nm/5 μm/0.5 vol.% | Ball milling + hot press + extrusion | 43 (40) | 281 (232) | 383 (315) | 6 (14) | [14] |
| 90% Mg – 9% Al – 0.6% Zn – 0.4% Mn (AZ91D)/10 μm | 100 nm/5 μm/1 vol.% | Ball milling + hot press + extrusion | 49 (40) | 295 (232) | 388 (315) | 5 (14) | [14] |
| Table Continued | |||||||

Matrix Material/grain size | CNT characteristics Diameter/length/volume fraction | Processing method | Young's modulus (GPa) | Yield strength (MPa) | Tensile strength (MPa) | Elongation to failure (%) | References |
| 90% Mg – 9% Al – 0.6% Zn – 0.4% Mn (AZ91D)/10 μm | 100 nm/5 μm/3 vol.% | Ball milling + hot pressing + extrusion | 51 (40) | 284 (232) | 361 (315) | 3 (14) | [14] |
| 90% Mg – 9% Al – 0.6% Zn – 0.4% Mn (AZ91D)/10 μm | 100 nm/5 μm/5 vol.% | Ball milling + hot pressing + extrusion | 51 (40) | 277 (232) | 307 (315) | 1 (14) | [14] |
| 86% Mg – 5.9% Al – 0.7% Zn – 0.3% Mn – 6.8% O (AZ61)/21 μm | 8–15 nm/50 μm/1 vol.% | Ball milling + microwave sintering | – | 176 (110) | 307 (136) | – | [30] |
| 86% Mg – 5.9% Al – 0.7% Zn – 0.3% Mn – 6.8% O (AZ61)/24 μm | 8–15 nm/50 μm/2 vol.% | Ball milling + microwave sintering | – | 134 (110) | 211 (136) | – | [30] |
| 86% Mg – 5.9% Al – 0.7% Zn – 0.3% Mn – 6.8% O (AZ61)/35 μm | 8–15 nm/50 μm/3 vol.% | Ball milling + microwave sintering | – | 117 (110) | 218 (136) | – | [30] |
| AZ31 – 3 wt.% AA5083 hybrid alloy/3.8 μm | 40–70 nm/4–7 μm/1 vol.% | Disintegrated melt deposition + hot extrusion | – | 221 (203) | 321 (310) | 12 (8.7) | [31] |
| Cu/250 nm | 40 nm/1–2 μm/5 vol.% | Ball milling + spark plasma sintering + cold rolling | 127 (70) | 149 (135) | 220 (175) | 8 (14) | [6] |
| Table Continued | |||||||

Matrix Material/grain size | CNT characteristics Diameter/length/volume fraction | Processing method | Young's modulus (GPa) | Yield strength (MPa) | Tensile strength (MPa) | Elongation to failure (%) | References |
| Cu/250 nm | 40 nm/1–2 μm/10 vol.% | Ball milling + spark plasma sintering + cold rolling | 137 (70) | 197 (135) | 281 (175) | 6.5 (14) | [6] |
| Cu/100 nm | 40 nm/2 μm/5 vol.% (1 wt.%) | CNT surface functionalization by Cu + spark plasma sintering | 114 (82) | 350 (110) | – | – | [15] |
| Cu/100 nm | 40 nm/2 μm/10 vol.% (2.2 wt.%) | CNT surface functionalization by Cu + spark plasma sintering | 135 (82) | 450 (110) | – | – | [15] |
| Cu/22 nm | 10 nm/1 μm/4.76 vol.% (1 wt.%) | Ball milling + high-pressure torsion | 117 (91) | 1125 (738) | – | – | [5,16] |
| Cu/74 nm | 5–20 nm/1–10 μm/3 vol.% | High-energy milling + cold isostatic pressing + high-pressure torsion | – | 770 (580) | – | – | [17] |
| Cu/– | 2–6 nm/5–30 μm/5 vol.% | Electroless plating + ultrasonic dispersion + sintering + forging + die-stretching | – | – | 371 (327) | 5 (4) | [22] |
| Cu/– | 0.26 vol.% | Aligning of CNTs + electroplating of Cu | – | 145 (110) | 213 (195) | 9 (12.5) | [23] |
| Cu/– | 0.52 vol.% | Aligning of CNTs + electroplating of Cu | – | 180 (110) | 254 (195) | 6 (12.5) | [23] |
| Cu/– | 0.78 vol.% | Aligning of CNTs + electroplating of Cu | – | 190 (110) | 264 (195) | 5 (12.5) | [23] |
| Cu/– | 1.04 vol.% | Aligning of CNTs + electroplating of Cu | – | 214 (110) | 287 (195) | 3.5 (12.5) | [23] |


Figure 8.10 The ratio of the Young's moduli, the yield and tensile strengths and the elongations to failure in tension obtained for CNT composites and their pure matrices. CNT, carbon nanotube. The data are taken from Table 8.1.

Figure 8.11 The microhardness (HV) as a function of the distance from the center of the HPT-processed Cu, Cu–CNT-RT, and Cu–CNT-373 disks (a). The hardness values determined at the half-radius of the disks at RT and 350 K (b). CNT, carbon nanotube. Reprinted from P. Jenei, E.Y. Yoon, J. Gubicza, H.S. Kim, J.L. Lábár, T. Ungár, Microstructure and hardness of copper-carbon nanotube composites consolidated by High Pressure Torsion, Materials Science and Engineering A 528 (2011) 4690–4695 with permission from Elsevier.
The parameters of the microstructure and the yield strength are usually correlated using the Taylor and/or Hall–Petch formulas. The former and the latter equations express the hardening effects caused by dislocations and boundaries, respectively. The yield strength values of the samples Cu, Cu–CNT-RT, and Cu–CNT-373 were determined at the center, half-radius, and periphery as one-third of the hardness obtained at RT. These values are compared with the yield strength calculated from the dislocation density using the Taylor equation and corrected for the porosity as [32]:
![]() (8.2)
(8.2)
where σ0 is the friction stress (35 MPa [33]), α is a constant (0.22 [34]), G is the shear modulus (47 GPa [35]), b is the length of the Burgers vector (0.256 nm), MT is the Taylor factor (3.06 was selected as strong texture was not observed in the samples), and Vp is the porosity in percents (0% for Cu and 3% for Cu–CNT-RT and Cu–CNT-373). The measured and the calculated yield strength values are in good agreement as shown in Fig. 8.12. The yield strength was also calculated at the half-radius of the disks from the grain size (d) determined by TEM using the Hall–Petch formula corrected for the porosity:
![]() (8.3)
(8.3)
where k is the Hall–Petch slope (∼4100 MPa nm1/2 for UFG Cu [36]). Fig. 8.12 demonstrates that the yield strength determined from the grain size is much less than the experimental values in agreement with previous studies on Cu-CNT composites [16].
It seems that although the Taylor equation takes only the interaction between dislocations into account, it is capable solely to estimate the yield strength of the microstructure in the HPT-consolidated Cu and Cu-CNT composites. This can be explained by the severely deformed microstructures in these samples containing extremely high dislocation densities (in the order of 1016 m−2). First, in severely deformed structures the majority of grain and subgrain boundaries are built up from dislocations, therefore their strengthening contributions can be described by a Taylor-type equation as pointed out theoretically by Hughes and Hansen [37]. Secondly, the stress needed for passing a dislocation through the high density dislocation structure is so large that it is also enough for crossing the twin boundaries, therefore they have no additional strengthening contribution. It is also interesting to note that the graphite-like fragments would be expected to have an additional dispersion strengthening contribution to the flow stress but this effect cannot be detected since the yield strength determined by the Taylor formula agrees well with the measured values. This observation can be explained by the severe plastic deformation during sample production as follows. In HPT-processing, a very large number of dislocations passed through the CNT fragments, resulting in Orowan loops around them. When the consolidated samples are deformed subsequently in hardness testing, the gliding dislocations interact directly with these loops instead of the CNT fragments, therefore this strengthening effect is included in the Taylor equation. Therefore, the CNT fragments in Cu have no direct strengthening effect but rather they harden via the increase of the dislocation density.

Figure 8.12 The calculated yield strength versus the measured values obtained as one-third of the hardness at the center, half-radius, and periphery of the HPT-processed Cu, Cu–CNT-RT, and Cu–CNT-373 disks. The yield strength was calculated from the grain size obtained by TEM using the Hall–Petch formula and also from the dislocation density measured by X-ray line profile analysis using the Taylor equation. CNT, carbon nanotube. Reprinted from P. Jenei, E.Y. Yoon, J. Gubicza, H.S. Kim, J.L. Lábár, T. Ungár, Microstructure and hardness of copper-carbon nanotube composites consolidated by High Pressure Torsion, Materials Science and Engineering A 528 (2011) 4690–4695 with permission from Elsevier.
Although, the incorporation of CNTs into metallic matrices increases the elastic modulus and the yield strength with the nanotube volume fraction, the elongation to failure during tension is usually reduced with the addition of CNTs into the matrix materials. Table 8.1 shows the maximum elongation in tension for different metal matrix–CNT composites. The incomplete bonding between CNTs and the matrix grains, as well as porosity caused by clustering of nanotubes during blending may yield lower fracture toughness and therefore smaller ductility than that for the materials without CNTs. As a consequence, the maximum elongation is very sensitive to the processing conditions and solely the amount of CNTs is not determining the ductility as seen in Fig. 8.10. Similar argumentation can be applied for the tensile strength (see Fig. 8.10). It is noted that for a given processing technique and matrix material, the tendency of agglomeration of CNTs increases with increasing nanotube volume fraction that yields a lower ductility for higher CNT contents (see Table 8.1). The high dispersity of CNTs in the matrix can be achieved by “molecular level mixing” of nanotubes and the matrix material [10] or by decreasing the adhesion between CNTs using surfactants [15] as discussed in Section 8.1 of this chapter. The application of these processing steps increases the tensile strength and the strain to failure of the composites.
8.5. Electrical Conductivity of Metal–Carbon Nanotube Composites
The addition of CNTs to metal matrices may overcome the usual incompatibility between high strength and good electrical conductivity. Lattice defects and alloying increase strength, but reduce conductivity. At the same time, the highly conductive CNTs may increase both strength and conductivity of the matrix concomitantly. This effect is clearly demonstrated on laminar Cu-CNT composite film processed by electroplating (see Section 8.1). Table 8.2 lists the conductivity and the strength-to-resistivity ratio measured at RT for different values of CNT volume fraction [24]. The conductivity is expressed in terms of percentage IACS (International Annealed Copper Standard). IACS at 20 °C corresponds to conductivity of ∼5.8 × 10⁷ S/m or resistivity of ∼1.72 × 10⁻⁸ Ω m. The addition of CNTs increases both the conductivity and the strength-to-resistivity ratio of the Cu matrix. Fig. 8.13 shows the conductivity and the strength-to-resistivity ratio of the electroplated laminar Cu-CNT composites normalized with the values measured on pure Cu matrix processed by the same technique. The increase of the two quantities as a function of CNT volume fraction is nearly linear. For a given CNT content, the enhancement of strength-to-resistivity ratio is about eight times larger than the increase of conductivity. This indicates that the influence of CNT addition on strength is higher than its effect on conductivity. It should be noted, however, for these electroplated composites and pure Cu material both conductivity and strength-to-resistivity ratio have poor values compared to those obtained for other Cu nanomaterials and listed in Table 9.2 (see Chapter 9). Most probably, the applied electroplating technique introduces structural defects (e.g., porosity) and/or contamination into the as-processed films which deteriorate their electrical transport and mechanical performances. It is also noted that reduction of electrical conductivity due to CNT addition was also observed for a Cu matrix composite processed by die-stretching [22]. This technique is described in Section 8.1. Addition of 5 vol.% CNT resulted in a lower conductivity (about 81% IACS) than that for pure Cu matrix manufactured by the same method (102% IACS). It is assumed that the main reason of the poor conductivity of the composite is the large fraction of semiconductive single-walled CNTs in the pristine sample, since chiral separation of CNTs was not performed.
Table 8.2
Resistivity, conductivity, and strength-to-resistivity ratio measured at RT for different values of CNT volume fraction in laminar Cu-CNT composite films processed by electroplating [24]
| CNT volume fraction (%) | Resistivity (10−8 Ω m) | Conductivity in IACS (%) | Strength-to-resistivity ratio (1010 MPa/Ω m) |
| 0 | 2.5 | 69 | 0.44 |
| 0.26 | 2.4 | 70 | 0.59 |
| 0.52 | 2.3 | 74 | 0.77 |
| 0.78 | 2.4 | 73 | 0.80 |
| 1.04 | 2.1 | 81 | 1.00 |


..................Content has been hidden....................
You can't read the all page of ebook, please click here login for view all page.