
Chapter 12
Thermal Stability of Defect Structures in Nanomaterials
Abstract
The thermal stability of the defect structure in nanomaterials is of great importance from the point of view of practical applications of these materials. Thus, if the fine grains become coarsened or the high density of dislocations decreases during their service lifetime, their unique properties including the high strength will be lost. The high-temperature thermal stability is usually investigated by differential scanning calorimetry combined with the direct or indirect observations of the microstructure. At the same time, some nanomaterials with low stacking fault energy and/or low melting point (e.g., Ag or Pb–Sn alloy) tend to recover/recrystallize even during storage at the processing temperature (e.g., at room temperature), which is called self-annealing. In this chapter, the thermal stability at both high and room temperatures is discussed. At high temperatures, the activation energy of recovery/recrystallization in face-centered pure nanomaterials is close to the activation energy of grain boundary diffusion. The onset temperature of recovery/recrystallization and the released heat depend on the grain size and the defect density contrary to the activation energy. The low stacking fault energy promotes self-annealing as the recrystallized grains may be easily separated from the matrix by low-energy twin boundaries. In addition, the thermal stability of ultrafine-grained (UFG) Cu samples processed by severe plastic deformation and powder metallurgy is compared. The effect of carbon nanotube additive on recovery and recrystallization of the UFG Cu matrix is also investigated. Finally, the coarsening of Au nanoparticles and the development of their defect structure during their storage at room temperature are studied.
Keywords
Calorimetry; Dislocation density; Grain growth; Recovery; Recrystallization; Self-annealing; Softening; Vacancy annihilation
12.1. High-Temperature Thermal Stability of Nanostructures in Metallic Materials
The high-temperature thermal stability for various nanomaterials processed by severe plastic deformation (SPD) methods has been studied by differential scanning calorimetry (DSC). As an example, Fig. 12.1 shows DSC thermograms taken at the heating rate of 10 K/min on 99.995% (4N5) purity Ag processed by 1, 4, 8, and 16 passes of equal-channel angular pressing (ECAP). The grain size, the dislocation density, and the twin boundary frequency for these samples are presented in Section 3.2 of Chapter 3. The exothermic peak evolved during heating corresponds to the annihilation of lattice defects (vacancies, dislocations, grain boundaries) during recovery and recrystallization. Although the temperature of the peak maximum depends on the SPD-processing method, the imposed strain, and the heating rate, its value is usually between 0.3 and 0.4 × Tm, where Tm is the melting point in Kelvin degrees.
The maximum of the exothermic peak in the DSC trace shifted to lower temperature values and the heat released during the annealing increased with the increase in the number of ECAP passes up to eight passes (see Fig. 12.2). These trends have been also observed for other ultrafine-grained (UFG) metals processed by different methods of SPD [1–7] and can be explained by the increase in the amount of grain boundaries due to grain refinement and the increase in densities of other lattice defects such as dislocations, stacking faults, and vacancies. These defects increase the driving force for nucleation of new defect-free grains so that recrystallization is achieved at lower temperatures. The slight decrease in the released heat and the increase in peak temperature for Ag between 8 and 16 ECAP passes are attributed to the decrease in dislocation density due to dynamic recovery processes occurring at large strains of ECAP. The reduction in the dislocation density at large number of ECAP passes has also been observed for other UFG metals (see also Chapter 2) [8,9].
It was found for pure Cu and Ag samples processed by SPD that neither significant reduction in lattice defect densities nor grain growth occurs before the exothermic peak during annealing in DSC [4]. X-ray line profile analysis investigations revealed that at the temperature corresponding to the beginning of the DSC peak, each X-ray diffraction peak profile appears to be a sum of a narrow and a broad peak indicating a development of a bimodal grain structure [3,4]. This microstructure consists of recovered/recrystallized grains and volumes with unchanged defect structure resulting in broad and narrow X-ray diffraction peaks, respectively. The formation of bimodal microstructure during annealing of deformed Cu has been also observed by transmission electron microscopy (TEM) [10,11]. The variation of recovery/recrystallization rate in different locations of nanomaterials is caused by the inhomogeneous microstructure formed during processing. It is anticipated that the annihilation of lattice defects starts at lower temperatures in the volumes having larger defect densities. If the temperature range corresponds to the exothermic peaks, both recovery (annihilation of vacancies and dislocations) and recrystallization occur [3,4].

Figure 12.1 Differential scanning calorimetry thermograms taken at the heating rate of 10 K/min on 99.995% (4N5) purity Ag processed by 1, 4, 8, and 16 passes of equal-channel angular pressing (ECAP).

Figure 12.2 (a) The temperature of the maximum of the differential scanning calorimetry (DSC) peaks presented in Fig. 12.1 for 4N5 Ag processed by different number of passes of equal-channel angular pressing (ECAP). (b) The heat released in the DSC peaks and the activation energies determined by the Kissinger method as a function of number of ECAP passes.
Table 12.1
The average grain size determined by transmission electron microscopy, the mean crystallite size, the dislocation density, and the twin boundary frequency obtained from X-ray line profile analysis and the onset temperature of recovery/recrystallization (Tonset) measured by differential scanning calorimetry at a heating rate of 40 K/min for Cu processed by different severe plastic deformation methods
| Processing method | Grain size (nm) | Crystallite size (nm) | Dislocation density (1014 m−2) | Tonset (K) |
| 20 MDF | 225 | 142 ± 15 | 7 ± 1 | 581 ± 3 |
| 15 TE | 225 | 107 ± 12 | 10 ± 1 | 572 ± 3 |
| 25 ECAP | 215 | 101 ± 15 | 15 ± 1 | 469 ± 2 |
| 25 HPT | 160 | 75 ± 9 | 37 ± 4 | 419 ± 2 |

The effect of the processing method on the thermal stability of UFG materials was studied on oxygen-free copper (99.98% purity) [12]. Samples were processed by 15 passes of twist extrusion (TE), 20 cycles of multidirectional forging (MDF), 25 passes of ECAP, and 25 revolutions of high-pressure torsion (HPT) at room temperature (RT). The details of the processing conditions can be found in Ref. [12]. The thermal stability was monitored by DSC at a heating rate of 40 K/min. The average grain size determined by TEM, the mean crystallite size and the dislocation density obtained from X-ray line profile analysis, and the onset temperature of recovery/recrystallization measured by DSC are listed in Table 12.1 [12]. The twin boundary frequency for all samples was relatively low (0.1 ± 0.1%), close to the detection limit of this quantity for the applied experimental setup of X-ray line profile analysis. The very high dislocation density after HPT can be attributed to the high pressure (p = 4 GPa) applied during HPT that hinders vacancy migration thereby impeding the climb-controlled annihilation of dislocations. Table 12.1 reveals that despite the similar grain size values of the samples processed by various SPD methods, the onset temperatures of recovery/recrystallization are very different. It can be established that the higher the dislocation density and lower the crystallite size, the lower the onset temperature of recovery/recrystallization, i.e., the samples produced by MDF and TE show the highest thermal stability while the HPT-processed specimen has the lowest stability. It is noted that the very high dislocation density after HPT is most probably accompanied by very large long-range internal stresses. These stresses may assist annihilation of dislocations thereby resulting in lower temperature of recovery/recrystallization as it has been already suggested in previous papers (e.g., Ref. [13]). It is also noted that in addition to the grain size and the dislocation density other features of the microstructure (e.g., grain boundary character) may also influence the stability of the SPD-processed samples. Electron backscatter diffraction (EBSD) analysis (not shown here) revealed that the fraction of high-angle grain boundaries (HAGBs) has similar high values (80%–94%) for all the samples presented in Table 12.1; therefore, most probably it does not increase significantly the difference in stability.
Table 12.2
The average grain size determined by transmission electron microscopy, the mean crystallite size, and the dislocation density obtained from X-ray line profile analysis and the peak temperature of recovery/recrystallization (Tpeak) measured by differential scanning calorimetry at a heating rate of 40 K/min for Ni processed by different severe plastic deformation methods and electrodeposition
| Processing method | Grain size (nm) | Crystallite size (nm) | Dislocation density (1014 m−2) | Tpeak (K) |
| 8 ECAP | 350 | 71 ± 5 | 9 ± 1 | 673 |
| 8 ECAP + 85%CR | 300 | 38 ± 4 | 11 ± 1 | 647 |
| 5 HPT | 170 | 42 ± 4 | 17 ± 2 | 542 |
| 8 ECAP + 5 HPT | 140 | 48 ± 4 | 25 ± 2 | 570 |
| 8 ECAP + 85%CR + 5 HPT | 100 | 46 ± 3 | 20 ± 2 | 563 |
| Electrodeposition | 35 | 24 ± 3 | 82 ± 4 | 610 |

Table 12.2 shows a comparison between the parameters of the microstructure and the thermal stability of nanostructured Ni processed by different methods including ECAP, cold rolling (CR), HPT, their combinations, and electrodeposition [14]. The details of processing methods are given in Ref. [15]. For the SPD-processed Ni samples, the thermal stability decreases when different SPD procedures are combined due to the reduction in grain size and the increase in dislocation density. At the same time, the electrodeposited Ni has higher stability than the samples processed by SPD despite the much smaller grain size and much higher dislocation density in the former material. Most probably, this effect is caused by the higher impurity level in Ni sample produced by electrodeposition.
In commercially pure hexagonal UFG materials the annihilation of dislocations starts before the appearance of exothermic DSC peak as illustrated for Ti processed by eight ECAP passes in Fig. 12.3 where the mean crystallite size and the dislocation density as a function of annealing temperature are shown [3]. At 800 K, where the DSC peak starts, the dislocation density has already decreased from 28 × 1014 m−2 to 6.6 × 10¹⁴ m−2. The increase in the crystallite size is accelerated only after 800 K, and it reaches 164 nm at 850 K. The dislocation density decreases further after 800 K, and at 850 K it has a value of 5 × 10¹³ m−2. The change in the prevailing dislocation slip systems in the sample was also determined as a function of temperature by X-ray line profile analysis. The procedure is described in Chapter 2. The 11 dislocation slip systems can be classified into three groups based on their Burgers vectors: 
 ,
, 
 , and
, and 
 . In the ECAP-processed Ti sample the relative fractions of
  ,
,  , and
, and  Burgers vectors are 64 ± 2%, 2 ± 2%, and 34 ± 2%, respectively. The abundance of -type dislocations besides - and -type dislocations can be explained by their smallest Burgers vector. Fig. 12.4 shows that as the temperature increases the relative fraction of -type dislocations decreases down to about 2%, indicating that these dislocations disappear faster than - or -type ones [3]. This can be explained by the fact that -type dislocations have larger Burgers vector and consequently higher formation energy than other two types.

Figure 12.3 The mean crystallite size and the dislocation density as a function of annealing temperature for Ti processed by eight equal-channel angular pressing passes. The corresponding differential scanning calorimetry (DSC) thermogram is also presented.

Figure 12.4 The relative fractions of -, -, and -type dislocations as a function of annealing temperature.
The activation energy of recovery/recrystallization can be determined from the shift of the exothermic DSC peak corresponding to the variation of heating rate using the Kissinger equation [16]:
![]() (12.1)
(12.1)
where V is the heating rate, Tp is the peak temperature, Q is the activation energy, R is the universal gas constant, and A is a constant. It is noted that at atmospheric pressure the activation energy is very close to the activation enthalpy. The activation energies determined for various pure UFG and nanomaterials along with their processing method and grain size are listed in Table 12.3. The grain size was determined by TEM except for the Cu sample consolidated by cold compaction of sputtered nanocrystalline particles. In that case, the crystallite size was obtained by X-ray diffraction line profile analysis (XLPA). The heat released in the exothermic peak corresponding to recovery/recrystallization is also presented in the table as this value usually does not depend on the heating rate. It can be concluded that for the majority of materials the activation energy is about 0.5 ± 0.1 × Qself where Qself is the activation energy of self-diffusion, irrespectively of the type of material and the processing method. Previous studies have shown that the activation energy of diffusion along grain boundaries and dislocations is also about half of that for self-diffusion [37–40]. Therefore, the observed values of activation energy of recovery/recrystallization in nanomaterials can be explained by the large amount of dislocations and grain boundaries that can act as diffusion paths during annealing. The data in Table 12.3 reveal that the grain size has no significant effect on the activation energy. Fig. 12.2b also shows that the activation energy for Ag remains unchanged with increasing number of ECAP passes, i.e., its value is less sensitive to the actual defect structure. At the same time, the released heat increases steeply with decreasing grain size below 200 nm as illustrated in Fig. 12.5. It should be noted that in addition to grain boundaries, most probably vacancies and dislocations also contribute to the released heat.
In pure metals the annihilation of dislocations (recovery) and recrystallization usually occur in one exothermic peak in DSC experiments. However, for many solid solutions with higher solute content and precipitate-hardened alloys two exothermic peaks were observed [29,30]. The first peak is related to recovery while the second one corresponds to recrystallization and grain growth. This separation of recovery and recrystallization can be attributed to the segregation of alloying elements and/or formation of precipitates at grain boundaries. Then, these act as obstacles against grain boundary migration, thereby hindering recrystallization. The activation energy for the first “recovery” peak is usually smaller than that determined for the second “recrystallization” peak, as shown by numerous examples in Table 12.3. For Al–Li alloys, it was proved that with increasing the Li content from 0.7% to 1.6% the activation energy for the first exothermic peak increased significantly, whereas for the second exothermic peak it remained practically unchanged [30]. It is noted that the separation of the recovery and recrystallization (or grain growth) processes into two DSC peaks was also observed for nominally pure metals (e.g., for Cu with 99.5 wt.% purity) consolidated from powders (see Section 12.3) [20]. In this case the contamination on powder surface might be segregated at the grain boundaries in the sintered UFG and nanomaterials, which hindered the grain boundary motion during recrystallization and grain growth.
Table 12.3
The processing method, the grain size, the heat released in the exothermic peak, and the activation energy of recrystallization determined for various ultrafine-grained and nanomaterials
| Material | Processing method | Grain size (nm) | Released heat (J/g) | Activation energy of recrystallization (kJ/mol) | Ratio of the activation energy of recrystallization and the bulk diffusion activation energy | References |
| fcc metals and alloys | ||||||
| Cu 99.98 wt.% | ECAP, 5 passes | 300 | 1.39 | 121 | 0.61 | [17] |
| Cu 99.98 wt.% | ECAP, 8 passes | 250 | 0.88 | 119 | 0.60 | [17] |
| Cu OFHC | ECAP, 8 passes | 210 | 0.95 | 80 | 0.4 | [18] |
| Cu 99.99 wt.% | HPT, 4 GPa, 2 turns | – | 1.27 | 75 | 0.37 | [13] |
| Cu 99.99 wt.% | HPT, 3 GPa, 1 turn | 150 | – | 96 | 0.48 | [19] |
| Cu 99.98 wt.% | HPT, 4 GPa, 10 turns | 160 | 0.86 | 107 | 0.54 | [20] |
| Cu 99.5 wt.% | Consolidation from powder by HPT, 2.5 GPa, 10 turns | 174 | 0.44 (1st peak) 0.69 (2nd peak) | 131 (1st peak) 207 (2nd peak) | 0.66 (1st peak) 1.04 (2nd peak) | [20] |
| Cu | Cold compaction of sputtered particles | 9 (XLPA) | 23 | 100 | 0.50 | [21] |
| Cu | Uniaxial compaction of inert gas condensed particles | 40 | 5 | 83 | 0.42 | [22] |
| Cu–1 wt.% Cr–0.1 wt.% Zr | ECAP, 8 passes | – | 0.8 | 137 | 0.69 | [23] |
| Cu 98.51 wt.%–1.49 wt.% Si | HPT, 5 GPa, 1 turn | 470 | 1.12 | 94 | 0.47 | [1] |
| Ni 99.99 wt.% | ECAP, 8 passes | 350 | 1.0 | 108 | 0.39 | [14,24,25] |
| Ni 99.99 wt.% | ECAP, 8 passes + cold rolling (85%) | 300 | 1.27 | 106 | 0.38 | [14] |
| Ni 99.99 wt.% | HPT, 6 GPa, 5 turns | 170 | 1.75 | 89 | 0.32 | [14] |
| Table Continued | ||||||

| Material | Processing method | Grain size (nm) | Released heat (J/g) | Activation energy of recrystallization (kJ/mol) | Ratio of the activation energy of recrystallization and the bulk diffusion activation energy | References |
| Ni 99.998 wt.% | HPT, 4 GPa, 2 turns | – | 2.5 | 91 | 0.33 | [13] |
| Ni 99.99 wt.% | ECAP, 8 passes + HPT, 6 GPa, 5 turns | 140 | 3.19 | 99 | 0.35 | [14] |
| Ni 99.99 wt.% | ECAP, 8 passes + cold rolling (85%) + HPT, 6 GPa, 5 turns | 100 | 3.88 | 98 | 0.35 | [14] |
| Ni | Electrodeposition | 35 | 10.3 | 108 | 0.39 | [14] |
| Ni | Electrodeposition | 20 | 7 | 132 | 0.47 | [26] |
| Ag 99.995% | ECAP, 4 passes | 200 | 0.78 | 84 | 0.49 | [27] |
| Ag 99.99% | ECAP, 4 passes | 200 | 0.59 | 93 | 0.55 | [27] |
| Ag 99.99% | HPT, 6 GPa, 10 turns | 200 | 1.0 (two peaks) | – | – | [28] |
| Ag | Uniaxial compaction of inert gas condensed particles | 60 | 3 | 101 | 0.55 | [22] |
| Al–7.6 at.% Mg (solid sol.) | Powder cryomilled at 77 K | 25 | 16.7 (1st peak) 15.2 (2nd peak) | 121 (1st peak) 189 (2nd peak) | 0.87 (1st peak) 1.36 (2nd peak) | [29] |
| Al–0.7 wt.% Li | ECAP, 4 passes | 570 | – | 34 (1st peak) 113 (2nd peak) | 0.24 (1st peak) 0.81 (2nd peak) | [30] |
| Al–0.7 wt.% Li | Hydrostatic extrusion, strain: ∼3.8 | 530 | – | 47 (1st peak) 102 (2nd peak) | 0.34 (1st peak) 0.73 (2nd peak) | [30] |
| Table Continued | ||||||

| Material | Processing method | Grain size (nm) | Released heat (J/g) | Activation energy of recrystallization (kJ/mol) | Ratio of the activation energy of recrystallization and the bulk diffusion activation energy | References |
| Al–1.6 wt.% Li | ECAP, 4 passes | 400 | – | 76 (1st peak) 122 (2nd peak) | 0.38 (1st peak) 0.87 (2nd peak) | [30] |
| Al–1.6 wt.% Li | Hydrostatic extrusion, strain: ∼3.8 | 520 | – | 63 (1st peak) 112 (2nd peak) | 0.45 (1st peak) 0.80 (2nd peak) | [30] |
| bcc metals and alloys | ||||||
| Fe 99.999% | Cold rolling (80%) | – | 0.38 | 85 | 0.33 | [31] |
| Fe 99.985% (0.015% Nb) | Cold rolling (80%) | – | 0.84 | 206 | 0.79 | [31] |
| Fe 99.9% | Ball milling | 9 | 32 | 224 | 0.86 | [32] |
| IF steel 99.77% (0.15 wt.% Mn, 0.08 wt.% Ti) | ECAP, 8 passes | 430 | 7.9 | 554 | 2.1 | [33] |
| hcp metals and alloys | ||||||
| Co | Electrodeposition | 20 | – | 151 | 0.54 | [34] |
| Ti (grade 2 purity) | ECAP, 8 passes at 450 °C | 400 | – | 179 | 1.06 | [35] |
| Zn | Cryomilled at 77 K | 23 | 2.1 | 80 | 0.83 | [36] |

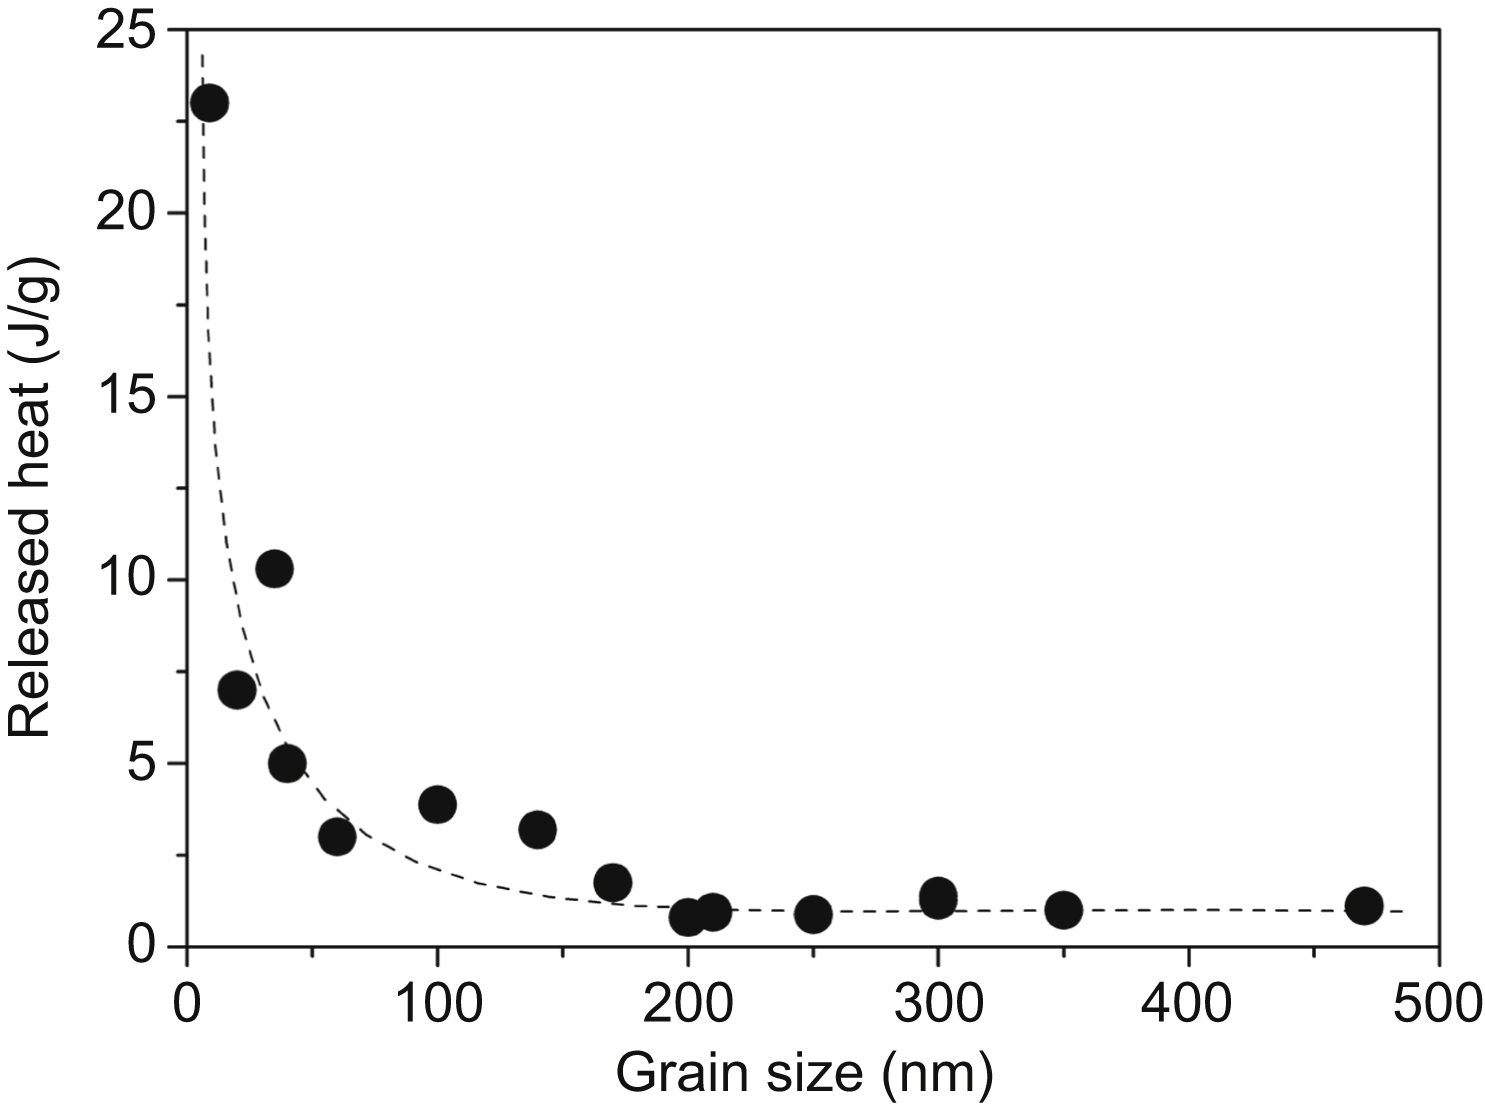
Figure 12.5 The released heat obtained in differential scanning calorimetry experiments as a function of grain size for pure face-centered cubic metals. The data are taken from Table 12.3.
For some HPT-processed UFG metals an additional peak was observed at low temperatures, which corresponded to the annihilation of single and double vacancies [6]. In the case of 99.998% and 99.99% purity Ni samples processed by HPT at RT, two exothermic peaks were detected on the DSC thermograms [6,13]. The first peak appearing at a lower temperature (about 120 °C at 10 K/min) corresponds to the disappearance of excess monovacancies while the larger second one (at about 275 °C) is associated with the annihilation of vacancy clusters and dislocations as well as recrystallization. The first peak was not observed for 99.99% Cu processed under the same conditions as most probably all the vacancies are clustered [6]. In the case of Ni, the high values of stacking fault energy (SFE) and melting point, and the large pressure during HPT retard the clustering of vacancies. The heat released in the first DSC peak was about one order of magnitude smaller (∼0.2 J/g) than that for the second peak (∼2 J/g). The concentration of vacancies annihilated during the first peak has been determined from the released heat using the formula [6]:
![]() (12.2)
(12.2)
where evac is the formation energy of a vacancy (0.29 × 10⁻¹⁸ J for Ni), NA is the Avogadro's number (6 × 10²³ mol−1), and Mmol is the molar mass for Ni (58.93 g/mol). The vacancy concentration was found to be about 10−4, which is close to the equilibrium value at the melting point. With increasing the number of HPT revolutions, the temperature of the first peak remained more or less constant while the second one shifted to lower temperatures, similarly as shown in Fig. 12.1. This difference can be attributed to the short- and long-range strain fields of vacancies and dislocations, as they decrease as r−3 and r−1, respectively, where r is the distance from the defect. With increase in the number of HPT revolutions, the dislocation density increases resulting in higher interaction stresses between them, which facilitates their annihilation and shifts the DSC peak to lower temperature. Due to the short-range strain field around vacancies, this effect is negligible when their concentration increases; therefore, the temperature of the first DSC peak does not change significantly with increase in the number of HPT revolutions [6,13]. The activation energies evaluated by the Kissinger analysis are 62 and 91 kJ/mol for the processes occurring in the first (monovacancy annihilation) and second (vacancy cluster and dislocation annihilation as well as recrystallization) peaks, respectively. Neither the number of HPT revolutions nor the impurity level affected significantly the values of activation energies.
12.2. Contributions of the Different Lattice Defects to the Energy Released in Calorimetry
The energy released during annealing of UFG and nanocrystalline materials in DSC is caused by the annihilation of different lattice defects, such as vacancies, dislocations, and grain boundaries. The fractions of the contributions of the different lattice defects to the released heat were investigated in 4N5 purity UFG Ag processed by ECAP [27]. The specimen was processed by four passes of ECAP at RT. On the DSC thermograms taken at a heating rate of 10 K/min, a single exothermic peak evolved, which corresponds to the recovery and recrystallization of the UFG microstructure as shown later. The maximum of the exothermic peak appeared at 408 K and the area under the peak was 0.78 ± 0.05 J/g. To reveal the contributions of the different lattice defects to the heat released, a detailed study of the microstructure was undertaken before and after the DSC peak.
In Chapter 4 the ECAP-processed microstructure for 4N5 Ag samples was investigated in detail. The grain size after four passes of ECAP was ∼200 nm as determined by TEM (see Fig. 12.6a). The dislocation density and the twin boundary frequency values obtained by XLPA were 37 ± 4 × 10¹⁴ m−2 and 0.7 ± 0.1%, respectively. Fig. 12.6b shows an EBSD image taken on the sample annealed up to the end of the exothermic DSC peak. Most of the grains are larger than several microns and have straight boundaries as in recrystallized volumes. However, some remaining UFG regions with an average grain size of ∼300–700 nm are visible as indicated by the black arrows in Fig. 12.6b. From the investigation of several IQ maps the fraction of these UFG regions was about 10%.
XLPA investigations were also carried out just before and after the DSC peak. It was found that during annealing up to the beginning of the exothermic peak the dislocation density decreased only by ∼10%–20% from 37 ± 4 × 10¹⁴ m−2 to 32 ± 4 × 10¹⁴ m−2. After the DSC peak, the values of both the dislocation density and the twin boundary frequency were lower than the detection limits of XLPA (1013 m−2 and 0.05%, respectively), indicating that the majority of dislocations were annihilated in the temperature range corresponding to the DSC peak.

Figure 12.6 The microstructure of 4N5 purity Ag (a) immediately after equal-channel angular pressing processing and (b) after the differential scanning calorimetry peak as determined by transmission electron microscope and electron backscatter diffraction, respectively. Reprinted from Z. Hegedűs, J. Gubicza, M. Kawasaki, N.Q. Chinh, K. Süvegh, Z. Fogarassy, T.G. Langdon, High temperature thermal stability of ultrafine-grained silver processed by equal-channel angular pressing, Journal of Materials Science 48 (2013) 1675–1684 with permission from Elsevier.
Dislocation loops with a size of several nanometers are invisible by XLPA due to their strongly shielded strain fields. Therefore, an additional TEM study was performed for the investigation of these defects. Fig. 12.7 shows a TEM image of the interior of a recrystallized grain in the sample annealed up to the end of the DSC peak. Careful inspection of the image using the extinction rule for dislocations showed that the dark spots are dislocation loops with Burgers vectors of  or
or  . The relative fractions of dislocations with Burgers vectors of and were 81% and 19%, respectively. Dislocations with Burgers vectors of are sessile Frank loops, which bound two-dimensional vacancy agglomerates on {111} planes. Clustering of vacancies into two-dimensional configurations on {111} planes is energetically more favorable in Ag than in other face-centered cubic (fcc) metals due to the low SFE [41,42]. The diameters of the dislocation loops are between 3 and 14 nm (the average diameter is ∼7 nm), irrespective of their Burgers vectors. The volume density of the dislocation loops was about 8 ± 2 × 10²² m−3.
The present TEM observation reveals that after the DSC peak a considerable number of dislocation loops remain in the material even in the recrystallized volumes. It is noted that dark spots are also observed inside the grains immediately after ECAP (see Fig. 12.6a). These spots probably also correspond to dislocation loops, which are formed during four passes of ECAP. However, an evaluation of the types of these loops using the extinction rule was unsuccessful due to the highly distorted microstructures. The densities of the loops before and after the DSC peak were similar.

Figure 12.7 Transmission electron microscope image of the interior of a recrystallized grain in equal-channel angular pressing–processed Ag heat-treated up to the end of the exothermic differential scanning calorimetry peak. The black spots indicate small dislocation loops. Reprinted from Z. Hegedűs, J. Gubicza, M. Kawasaki, N.Q. Chinh, K. Süvegh, Z. Fogarassy, T.G. Langdon, High temperature thermal stability of ultrafine-grained silver processed by equal-channel angular pressing, Journal of Materials Science 48 (2013) 1675–1684 with permission from Elsevier.
The change in vacancy concentration during the evolution of the exothermic DSC peak was investigated by positrion annihilation spectroscopy (PAS). The experimental lifetimes of positrons annihilated at defects in ECAP-processed Ag before and after the DSC peak are between 181 and 201 ps. These values are close to the positron lifetime of monovacancies in plastically deformed Ag (196 ps, [43]). However, even at the beginning of the exothermic peak, at ∼380 K, the temperature is too high for monovacancies to exist. At the same time, the lifetime of positrons annihilated at two-dimensional vacancy clusters is only slightly smaller than the value for monovacancies [44,45]. These two-dimensional vacancy clusters usually form on {111} planes and these agglomerates may be regarded as a stacking fault bordered by a Frank dislocation loop with a Burgers vector of . In addition, the positron lifetime for free volumes of approximately the size of a monovacancy in the grain boundaries is also close to the value characteristic for monovacancies [46]. Therefore, it is expected that the concentration obtained by PAS describes vacancies in two-dimensional vacancy clusters and grain boundaries. At the beginning of the exothermic peak, at ∼380 K, the vacancy concentration was larger than the detection limit in the PAS experiments (∼5 × 10⁻⁵). During the evolution of the DSC peak, the vacancy concentration decreased from a value higher than 5 × 10⁻⁵ to 0.7 ± 0.1 × 10⁻⁵.
Table 12.4
The balance table for stored energies calculated for the different lattice defects (dislocations, high-angle grain boundaries, twin faults, small dislocation loops, and vacancies) in equal-channel angular pressing–processed 4N5 purity Ag before and after the differential scanning calorimetry (DSC) peak
| Before DSC (J/g) | After DSC (J/g) | Difference (J/g) | Fraction (%) | |
| Edisl | 0.28 | 0 | 0.28 | 36 |
| EHAGB | 0.36 | 0.01 | 0.35 | 45 |
| Etwin | 0.02 | 0 | 0.02 | 2 |
| Eloop | 0.10 | 0.10 | 0 | 0 |
| Evac | 0.14 | 0.01 | 0.13 | 17 |
| Sum | 0.90 | 0.12 | 0.78 | 100 |

The contribution of the different lattice defects to the released heat can be determined as the difference between the stored energies calculated before and after the DSC peak for the lattice defects (grain boundaries, dislocations, twin faults, small dislocation loops, and vacancies) investigated in the previous sections. These stored energy values are summarized in Table 12.4, which are rounded to the precision of the measured released heat (two decimal places). The energy stored in dislocations (Edisl) can be determined from the dislocation density using the following relationship [5]:
 (12.3)
where G is the shear modulus (30 GPa), b is the magnitude of Burgers vector (0.29 nm), ρ is the dislocation density, ρm is the mass density (10.5 × 10⁶ gm−3), and A denotes a factor that depends on the edge/screw character of the dislocations. The value of A is equal to (4π)−1 and [4π(1−ν)]−1 for screw and edge dislocations, respectively, where ν is Poisson's ratio (taken as 0.3). The parameter q determined by XLPA describes the edge/screw character of the dislocations. The theoretically calculated values of q for pure edge and screw dislocations in Ag are 1.62 and 2.35, respectively. In practice, the value of A was obtained from the experimentally determined q of 2.2 using a simple rule of mixtures [12]:
![]() (12.4)
(12.4)
The energy stored in dislocations calculated from the dislocation density determined by XLPA is 0.28 J/g before the DSC peak. After this peak in the recrystallized region, the dislocation density was smaller than the detection limit of XLPA (1013 m−2), which is two orders of magnitude lower than the value determined before the DSC peak. Therefore, this contribution to the stored energy may be neglected. In the remaining UFG region, the dislocation density is most probably higher than the detection limit, but its value is not easily determined by XLPA due to the relatively small volume fraction of this region. Nevertheless, as the UFG fraction after the DSC peak is smaller than 10% and the dislocation density most probably decreased at least by one order of magnitude, the energy stored in dislocations after the DSC peak is negligible compared to the value determined before the exothermic peak.
The interfaces between the grains can be classified as low- and high-angle grain boundaries (LAGBs and HAGBs, respectively). The LAGBs usually consist of dislocations, and XLPA measures dislocations in both the boundaries and the interiors of the grains so that the contribution of LAGBs to the stored energy is incorporated in Eq. (12.3). The energy of the HAGBs (EHAGB) is given as [47]:
![]() (12.5)
(12.5)
where γGB is the average HAGB energy in Ag (0.5 J/m2 [48]), h is the fraction of HAGBs (about 0.5 for fcc metals processed by four passes of ECAP [49]), and d is the average grain size. Before the DSC peak, the average grain size was ∼200 nm, which gives 0.36 J/g for the grain boundary energy. After the DSC peak, the microstructure consists of recrystallized coarse grains and the remaining UFG regions with average grain sizes of ∼5 μm and ∼500 nm, respectively. The energy stored in HAGBs in the recrystallized fraction is negligible since, as shown in Fig. 12.6b, most HAGBs are twin boundaries having very low energy (0.008 J/m2 [42]). Taking into account that the relative fraction of the remaining UFG regions was 10%, the energies stored in the HAGBs after the DSC peak is ∼0.01 J/g.
![]() (12.6)
(12.6)
where γtwin is the twin boundary energy in Ag, β is the twin-fault probability determined by XLPA (0.7 ± 0.1% before the DSC peak), d111 is the spacing between the neighboring {111} planes (0.24 nm), and dtwin is the mean twin boundary spacing, which can be expressed as d111/β. The value of Etwin is ∼0.02 J/g before the DSC peak and practically zero after the peak due to the very large mean twin boundary spacing (>1 μm).
The energy stored in the small dislocation loops (Eloop) with Burgers vector of after the DSC peak may be expressed by modifying Eq. (12.3) as:
 (12.7)
It was taken into account in the derivation of Eq. (12.7) that the loop concentrations were equal in the recrystallized and the remaining UFG volumes. The outer cutoff radius of dislocations of the loops was selected as the average diameter of the loops (D = 7 nm as determined by TEM), ρloop is the total length of dislocations in the loops in a unit volume (i.e., the dislocation density in the loops with Burgers vector of either or ), and f is the fraction of dislocation loops with Burgers vector of (f = 0.81). The loops with Burgers vector of are practically collapsed vacancy clusters; therefore, their stored energy will be included in the energy stored in vacancies (see the next paragraph). The value of ρloop was determined as the product of the average length of a loop (Dπ) and the volume density of the dislocation loops (rloop = 8 × 10²² m−3). Calculating the energies stored in the loops in the recrystallized volumes after the DSC peak using Eq. (12.7), a value of ∼0.1 J/g was obtained. As the density and the size of the dislocation loops immediately after ECAP appear similar to the values after the DSC peak, the same stored energies were assumed for the loops both before and after the DSC peak (see Table 12.4). This means that the loops make a negligible contribution to the released heat despite their high density.
The energy stored in vacancies can be calculated from the vacancy concentration using Eq. (12.2) where evac is the formation energy of a vacancy in Ag (1.1 eV = 0.176 × 10⁻¹⁸ J) and Mmol is the molar mass for Ag (107.87 g/mol). As it was shown earlier, the vacancy concentration at the end of the DSC peak was 0.7 × 10⁻⁵ as determined by PAS, which corresponds to the stored energy of 0.1 J/g. However, before the DSC peak the vacancy concentration was larger than the detection limit of this method (5 × 10⁻⁵). Therefore, the energy stored in vacancies in the beginning of the DSC peak was determined from the balance between the measured and the calculated released heat. Summing up the stored energies calculated for the different lattice defects, the total energy stored in the 4N5 Ag specimen before and after the DSC peak is listed in Table 12.4. Assuming an agreement between the calculated and the measured values of the heat release, the vacancy concentration before the DSC peak can be determined from Eq. (12.2) as ∼1.4 × 10⁻⁴. This value has the same order of magnitude as the vacancy concentrations obtained for other SPD-processed metals (see Table 3.2 in Chapter 3). It is emphasized that the vacancy concentration obtained by PAS includes also the free volumes in the grain boundaries.
Table 12.4 shows that the largest contributions to the stored energy before the DSC peak are given by HAGBs and dislocations in 4N5 Ag processed by four passes of ECAP. After the DSC peak, about 13% of the stored energy is retained in the material mainly due to the remaining dislocation loops in the recrystallized volumes. The percentage fractions of the contributions of the different lattice defects to the released heat are listed in the last column of Table 12.4. About 45% and 36% of the released heat are related to the annihilation of grain boundaries and dislocations, respectively. The third largest contribution to the released heat was given by vacancies with the fraction of ∼17%.
12.3. Comparison of the Thermal Stability of Ultrafine-Grained Cu Processed by Severe Plastic Deformation and Powder Metallurgy
The thermal stability of the UFG microstructures in Cu processed by bottom-up and top-down techniques was compared [20]. A bulk UFG sample with the grain size of ∼160 nm was produced from a cast coarse-grained oxygen-free copper material with 99.98% purity using HPT under 4 GPa for 10 revolutions at RT. Another sample was consolidated from a Cu powder with 99.5% purity and an average particle size less than 44 μm (325 mesh). This specimen was precompacted by cold isostatic pressing, and then it was consolidated by HPT at RT. The applied pressure and the number of revolutions were 2.5 GPa and 10, respectively. The final grain size of this sample was similar (∼174 nm) to the specimen processed from cast bulk material by HPT (∼160 nm). In the following text, the UFG samples processed from cast Cu and Cu powder are referred to as bulk-Cu and consolidated-Cu, respectively. The difference between bulk-Cu and consolidated-Cu samples is emphasized again: in the first case, only grain refinement occurred during HPT while in the second case both consolidation and grain refinement were performed in HPT processing. Despite the different processing methods, both the grain size and the defect structure were similar in the two materials. In bulk-Cu and consolidated-Cu samples the dislocation density values were 42 ± 4 × 10¹⁴ m−2 and 43 ± 4 × 10¹⁴ m−2, respectively. The twin-fault probability was zero for both samples, as determined by XLPA method. The samples were subjected to DSC annealing at a heating rate of 40 K/min to compare the stability of the UFG microstructures in the SPD-processed bulk- and consolidated-Cu materials.
Fig. 12.8 shows the DSC thermograms measured for the bulk- and consolidated-Cu samples [20]. For the bulk-Cu sample one exothermic peak was observed, which starts at ∼400 K and ends at ∼540 K with the maximum at ∼485 K. In the case of the consolidated-Cu sample the DSC thermogram comprises two main exothermic peaks. The first peak starts at ∼500 K and has a maximum at ∼580 K. This peak has long tail at the right side. The second peak starts at ∼750 K and ends at ∼880 K with the maximum at ∼810 K. The crystallite size and the dislocation density were determined by XLPA at characteristic temperatures of the DSC thermograms and presented in Fig. 12.9a and b, respectively. In the case of bulk-Cu, the crystallite size and the dislocation density did not change up to the temperature corresponding to the beginning of the DSC peak. At the same time, after the DSC peak the dislocation density was lower while the crystallite size was larger than the detection limit of XLPA for the present experimental setup (∼1013 m−2 and 800 nm, respectively). Therefore, in the case of bulk-Cu, both recovery and recrystallization occurred in the temperature range corresponding to the DSC peak.
The heat released (H) during recovery and recrystallization of the bulk-Cu specimen was 0.86 ± 0.13 J/g as obtained by integrating the area under the DSC peak. This value can be correlated to the change in the energy stored in dislocations and grain boundaries, as shown in Section 12.2. The energy stored in dislocations (Edisl) was determined from Eqs. (12.3) and (12.4) using the following parameters: G = 47 GPa, b = 0.25 nm, and ρm = 8.96 × 10⁶ gm−3. The value of q obtained for bulk-Cu sample was 2.2, indicating a rather screw character of dislocations. The energy stored in dislocations in the bulk-Cu sample was 0.50 ± 0.06 J/g [20].

Figure 12.8 Differential scanning calorimetry thermograms for high-pressure torsion (HPT)–processed bulk-Cu and the counterpart consolidated by HPT from a microcrystalline Cu powder. Reprinted from P. Jenei, J. Gubicza, E.Y. Yoon, H.S. Kim, J.L. Lábár, High temperature thermal stability of pure copper and copper – carbon nanotube composites consolidated by high pressure torsion, Composites: A 51 (2013) 71–79 with permission from Elsevier.

Figure 12.9 Evolution of crystallite size (a) and dislocation density (b) in high-pressure torsion (HPT)–processed bulk-Cu and the counterpart consolidated by HPT from a microcrystalline Cu powder, as determined by X-ray diffraction line profile analysis (XLPA). The notation “recryst.” indicates the occurrence of recrystallization, which made the XLPA evaluation impossible. Adapted from P. Jenei, J. Gubicza, E.Y. Yoon, H.S. Kim, J.L. Lábár, High temperature thermal stability of pure copper and copper – carbon nanotube composites consolidated by high pressure torsion, Composites: A 51 (2013) 71–79.
The interfaces between the grains can be classified as low- and high-angle grain boundaries (LAGBs and HAGBs, respectively). HAGBs have angle of misorientation higher than 15 degrees. LAGBs usually consist of dislocations, and XLPA measures dislocations in both the boundaries and the interiors of the grains so that the contribution of LAGBs to the stored energy is incorporated in the dislocation term. The energy of the HAGBs (EHAGB) was determined from Eq. (12.5) using γGB = 0.6 J/m2 [18]. Previous experiments [50] have shown that the value of h varies between 0.2 and 0.75 in HPT-processed Cu disks, depending on the number of revolutions and the location along the disk radius. Therefore, an average value of 0.5 was used for h in Eq. (12.5). Before the DSC peak, the energy stored in HAGBs for bulk-Cu specimen was 0.63 ± 0.08 J/g as obtained from Eq. (12.5). The sum of the energies stored in dislocations and HAGBs before the DSC peak is 1.13 J/g, which is slightly larger than the experimental value of 0.86 ± 0.13 J/g. This difference can be attributed to the remaining UFG fraction whose existence was proved by the homogeneous parts between the high intensity spots in the Debye–Scherrer rings (see earlier discussion). Since the recrystallized grains cannot be included in the XLPA evaluation, the average crystallite size and dislocation density in bulk-Cu after the DSC peak were not determined, and their very high and low values are indicated by steeply increasing and decreasing curves in Fig. 12.9a and b, respectively.
In the case of the consolidated-Cu sample, the Debye–Scherrer rings remained homogeneous until the beginning of the second DSC peak, suggesting that recrystallization did not occur or it is marginal up to ∼750 K. At the same time, the Debye–Scherrer rings obtained at the end of the second DSC peak (at ∼880 K) contain high-intensity spots, indicating considerable recrystallization between 750 and 880 K. Therefore, it is reasonable to cut the DSC thermogram for consolidated-Cu into two sections: in the first section between 500 and 750 K only recovery was observed while during the second section from 750 to 880 K both recovery and recrystallization were detected. This behavior is different from that observed for bulk-Cu sample where the recovery and recrystallization occurred in one step [20]. Additionally, despite its similar microstructure in the as-received state, the consolidated-Cu specimen showed much better thermal stability than bulk-Cu, since at ∼500 K in the consolidated-Cu sample neither significant recovery nor recrystallization was observed while the latter material was almost fully recrystallized (compare the thermograms in Fig. 12.8). The more stable microstructure in the consolidated-Cu sample might be attributed to impurities and oxide dispersoids, which are usually unavoidable in powder metallurgy [51] and have a pinning effect on lattice defects. It should be noted that although oxide phase was not detected in the consolidated-Cu by X-ray diffraction, its existence with a small amount cannot be excluded even if its diffraction peaks are missing, as demonstrated in a previous experiment [52]. Zhou and coworkers [53] have already shown that the oxidation of powder particle surfaces has an obstructive influence on grain growth.
The evolution of the crystallite size and the dislocation density during the recovery in the consolidated-Cu specimen for first annealing section are shown in Fig. 12.9a and b, respectively [20]. The values of the dislocation density are also indicated in the thermogram of Fig. 12.8. The dislocation density only slightly decreased from ∼43 × 1014 m−2 to ∼38 × 1014 m−2 due to heating the sample up to the beginning of the first peak (at ∼500 K). At the end of the first annealing section (at ∼750 K), the dislocation density decreased to ∼17 × 1014 m−2, the crystallite size increased from ∼60 to ∼80 nm, and the grain size increased from ∼174 to ∼332 nm, as revealed by the evaluation of TEM images. Above 750 K, neither the average dislocation density nor the crystallite size was determined by XLPA due to the spotty Debye–Scherrer rings. The grain size cannot be evaluated from the TEM micrographs at 1000 K due to the very limited number of visible grains, but it is evident that the grain size is larger than 1–2 μm. The heat released in the consolidated-Cu sample was 1.13 ± 0.13 J/g, as determined from the sum of the areas under the two peaks. The energies stored in dislocations and HAGBs are 0.43 ± 0.05 J/g and 0.58 ± 0.07 J/g as calculated from Eqs. (12.3) and (12.5), respectively.The sum of these two contributions of the stored energies equals 1.01 ± 0.12 J/g, which agrees well with the measured released heat (1.13 ± 0.13 J/g) [20].
In the samples processed by powder metallurgy, the porosity was investigated by scanning electron microscopy (SEM) [20]. The pores were randomly distributed on the surface with the size between 20 and 200 nm. It is noted that neither the amount nor the size of the pores showed significant dependence on the location along the radius for all the HPT-processed disks. The porosity in the consolidated-Cu specimen was ∼0.5 vol.%, which increased to ∼1.0 vol.% at the end of the first annealing section (at 750 K). After the heat treatment up to 1000 K the porosity increased to ∼1.4 vol.% and additionally some large cracks with the length of ∼30 μm were formed. The increase in the porosity during the heat treatment is mainly attributed to the lack of degassing step between the precompaction and the consolidation processes, thereby leaving air in the closed pores in the sintered specimens. The volume of the pores increased due to the expansion of the closed air with increasing temperature. Additionally, at high temperatures the pores were coalesced leading to the formation of large voids and cracks.
12.4. Effect of Carbon Nanotubes on the Stability of Metal Matrix Nanostructures
The influence of carbon nanotubes (CNTs) on the thermal stability of UFG microstructure in copper was investigated by comparing samples consolidated from Cu powder with and without CNT additive [20]. Copper powder with 99.5% purity and an average particle size less than 44 μm (325 mesh) was consolidated by HPT at RT. In Section 12.3 the thermal stability of this sample (referred to as “consolidated-Cu”) was investigated by DSC and XLPA (see Figs. 12.8 and 12.9). An additional sample with 3 vol.% multiwalled CNTs (MWCNTs) was also prepared. In the fabrication of this specimen, first the Cu powder and the CNTs were mixed by high-energy milling. The diameter and the length of the CNTs produced by catalytic chemical vapor deposition (CCVD) were 5–20 nm and 1–10 μm, respectively. The powder blend was precompacted by cold isostatic pressing. The precompacted disks having a diameter of 19 mm and a height of 3 mm were consolidated by HPT at RT. The applied pressure and the number of revolutions were 2.5 GPa and 10, respectively. The HPT-processed disks were 20 mm in diameter and 0.7 mm in thickness. In the following, the UFG sample processed from the blend of Cu and CNTs at RT is referred to as Cu-CNT.

Figure 12.10 Differential scanning calorimetry thermograms measured at 40 K/min for consolidated-Cu and Cu–carbon nanotube (CNT) samples. Reprinted from P. Jenei, J. Gubicza, E.Y. Yoon, H.S. Kim, J.L. Lábár, High temperature thermal stability of pure copper and copper – carbon nanotube composites consolidated by high pressure torsion, Composites: A 51 (2013) 71–79 with permission from Elsevier.
The thermal stability of the Cu-CNT sample was investigated by DSC [20]. Fig. 12.10 shows the DSC thermograms measured at a heating rate of 40 K/min for the consolidated-Cu and Cu-CNT samples. The DSC thermogram obtained for the consolidated-Cu specimen was evaluated in Section 12.3. In the case of the Cu-CNT sample an exothermic peak between 480 and 620 K was observed. Fig. 12.11 reveals that in this temperature range the crystallite size did not change significantly, while the dislocation density decreased from ∼111 × 1014 m−2 to ∼66 × 1014 m−2 for sample Cu-CNT. The twin boundary frequency decreased from ∼1.1% to ∼0.8% in sample Cu-CNT heated up to 620 K. These microstructural observations suggest that mainly recovery occurred in the temperature range related to the DSC peak. The change in the stored energy between 480 and 620 K was calculated from the reduction of the dislocation density using Eq. (12.3), and ∼0.40 J/g was obtained for sample Cu-CNT, which is in good agreement with the heat released in the DSC peak (0.43 J/g). Fig. 12.11 shows that after 620 K the crystallite size slightly increased, while the dislocation density and the twin boundary frequency decreased with increasing temperature. At 1000 K, which is the maximum temperature achievable by the present experimental setup, the Debye–Scherrer rings obtained by X-ray diffraction remained homogeneous, indicating the lack of recrystallization. This is in accordance with the very small increase in the crystallite size measured by XLPA. The XLPA results are supported by the TEM images taken on sample Cu-CNT immediately after HPT processing and after subsequent annealing up to 750 and 1000 K (see Fig. 12.12). The mean grain size increased only slightly from 74 to 87 nm due to annealing up to 750 K, and the microstructure remained fine with the grain size of 107 nm even at 1000 K. The TEM images also prove the lack of considerable recrystallization during annealing of the specimen Cu-CNT. Without the addition of CNTs the heat treatment yielded a significant grain growth in the consolidated-Cu sample, and at 1000 K the grain size was about one order of magnitude larger (1–2 μm) than immediately after HPT processing (174 nm), as shown by the TEM images in Fig. 12.12. Additionally, the dislocation density remained very high even at 1000 K, ∼40 × 1014 m−2 for sample Cu-CNT. The much better thermal stability of the UFG microstructure in the composite sample can be attributed to the hindering effect of CNTs on recovery and recrystallization.

Figure 12.11 The average crystallite size (a), the dislocation density (b), and the twin-fault probability (c) in consolidated-Cu and Cu–carbon nanotube samples obtained by X-ray diffraction line profile analysis (XLPA) as a function of the temperature in differential scanning calorimetry annealing at a heating rate of 40 K/min. “Recryst.” indicates the occurrence of recrystallization, which yielded higher crystallite size and lower dislocation density than the detection limits of XLPA. Adapted from P. Jenei, J. Gubicza, E.Y. Yoon, H.S. Kim, J.L. Lábár, High temperature thermal stability of pure copper and copper – carbon nanotube composites consolidated by high pressure torsion, Composites: A 51 (2013) 71–79.

Figure 12.12 Dark field transmission electron microscopy micrographs taken on consolidated-Cu specimen (a) immediately after high-pressure torsion (HPT) and after subsequent heating up to (b) 750 K and (c) 1000 K, as well as on Cu–carbon nanotube composite (d) immediately after HPT and after subsequent heating up to (e) 750 K and (f) 1000 K. Reprinted from P. Jenei, J. Gubicza, E.Y. Yoon, H.S. Kim, J.L. Lábár, High temperature thermal stability of pure copper and copper – carbon nanotube composites consolidated by high pressure torsion, Composites: A 51 (2013) 71–79 with permission from Elsevier.
Fig. 12.10 also shows that above ∼700 K there was a sharp decrease in the measured heat flow. This can be explained by the formation of large voids and cracks with the length of 100–200 μm and the thickness of 30–50 μm in specimen Cu-CNT (see Fig. 12.13), which yielded the bloating of the samples, leading to an abrupt reduction of the contact area between the specimens and the sample holder in the calorimeter [20]. Therefore, the heat released due to recovery and recrystallization cannot be determined from the DSC experiments above ∼700 K. It is noted that the cracks are also formed in the pure consolidated-Cu sample, but they were one order of magnitude smaller than in the Cu-CNT specimen (see Fig. 12.13). Therefore, they did not cause considerable change in the shape of the specimen during DSC heat treatment. It should also be noted that significant porosity was found already in the as-consolidated pure Cu and Cu-CNT samples with the pore size between 20 and 200 nm. However, the volume fraction of pores was much higher (1.8 vol.%) in the initial Cu-CNT specimen than in the consolidated-Cu sample (0.5 vol.%), as determined from SEM images [20]. The higher porosity in specimen Cu-CNT compared to the pure consolidated-Cu can be explained by the difficult dispersion of CNTs in the Cu matrix (see Chapter 8). The clustered CNTs prevent sufficient bonding between the matrix particles, leading to fine pores and cracks in the nanocomposites. Annealing yielded the increase in porosity and the formation of cracks in both samples. Fig. 12.13b illustrates the appearance of both open and closed cracks in specimen Cu-CNT annealed up to 1000 K.
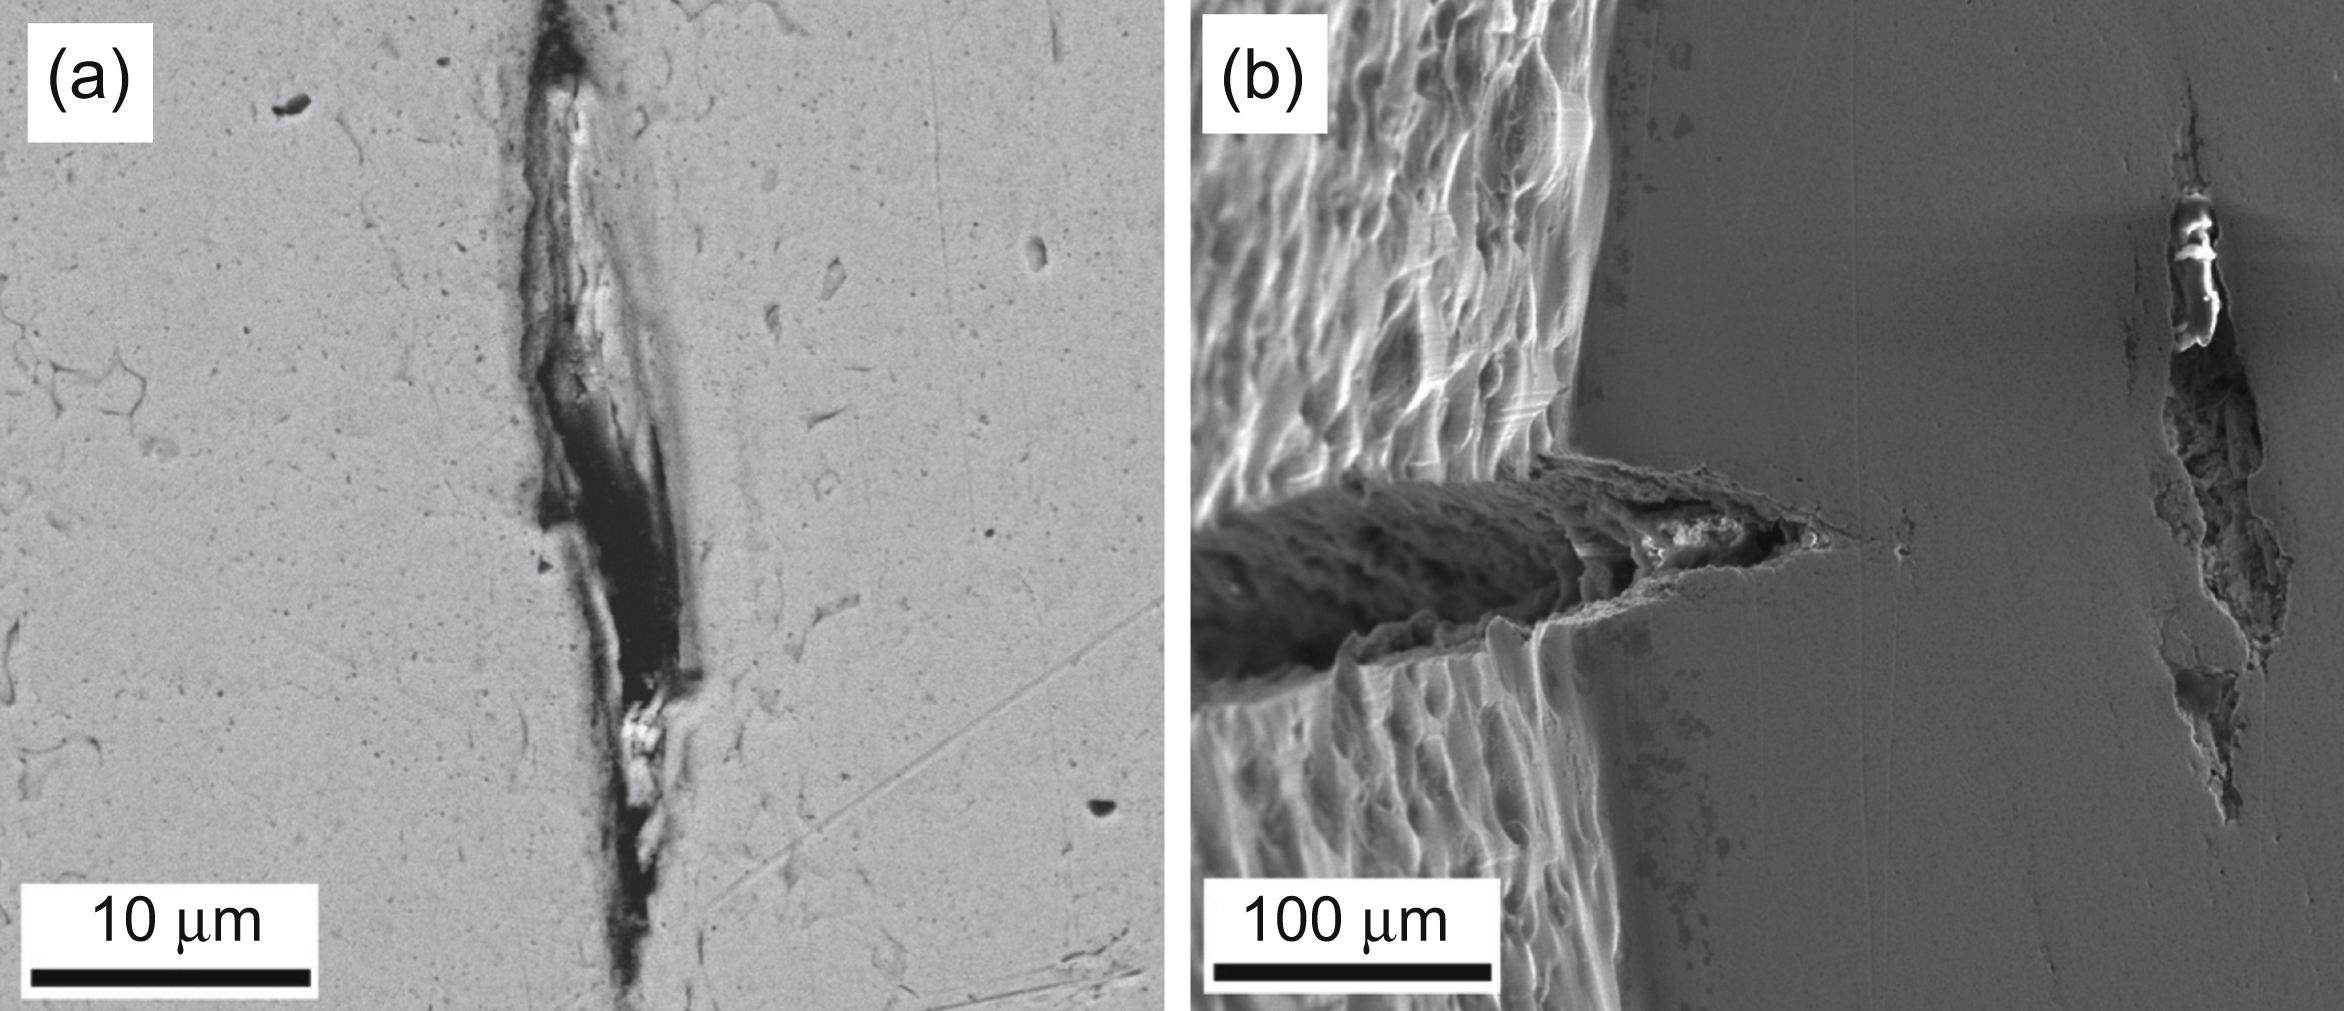
Figure 12.13 Scanning electron microscopy images of the polished cross sections at the half-radius of the high-pressure torsion processed disks after heating up to 1000 K: (a) consolidated-Cu and (b) Cu–carbon nanotube composite. Reprinted from P. Jenei, J. Gubicza, E.Y. Yoon, H.S. Kim, J.L. Lábár, High temperature thermal stability of pure copper and copper – carbon nanotube composites consolidated by high pressure torsion, Composites: A 51 (2013) 71–79 with permission from Elsevier.
The influence of CNT addition on the thermal stability of UFG Cu was also studied by monitoring the hardness evolution as a function of DSC temperature [20]. Fig. 12.14 shows that the hardness of sample Cu-CNT is higher than for the consolidated-Cu specimen at any temperature up to 1000 K. This can be explained by the hardening effect of the much higher defect density in sample Cu-CNT, which could not be overwhelmed by the softening effect of the larger porosity. Although a large decrement in the dislocation density for specimen Cu-CNT occurred between 480 and 620 K, the strong reduction of the hardness was observed above ∼700 K. The latter value also corresponds to the temperature where the heat flow in the DSC thermograms started to fall down (see Fig. 12.10), which was related to the formation of large voids and cracks. The large decrease in hardness is mainly explained by the increased porosity since an extensive recrystallization can be excluded on the basis of the TEM images, the lack of high intensity spots on the Debye–Scherrer rings detected by X-ray diffraction, and a slight increase in the crystallite size up to 1000 K. It can be concluded that the addition of CNTs to Cu at RT yielded a better stability of the defect structure inside the grains due to the pinning effect of nanotubes on dislocations and grain boundaries; however, CNTs weakened the interfaces between the grains due to a more extensive void and crack formation. Our study proved that the former effect is stronger; therefore the addition of CNTs has an overall benefit to the hardness in the temperature range between 300 and 1000 K.

Figure 12.14 The hardness as a function of temperature for consolidated-Cu and Cu–carbon nanotube (CNT) composite specimens in differential scanning calorimetry annealing at a heating rate of 40 K/min. Adapted from P. Jenei, J. Gubicza, E.Y. Yoon, H.S. Kim, J.L. Lábár, High temperature thermal stability of pure copper and copper – carbon nanotube composites consolidated by high pressure torsion, Composites: A 51 (2013) 71–79.
12.5. Inhomogeneous Thermal Stability of Ultrafine-Grained Silver Processed by High-Pressure Torsion
An inhomogeneous recrystallization along the axial direction of an HPT-processed UFG Ag was observed [28]. First, a 99.99% (4N) purity silver disk was annealed at 741 K for 1 h. The mean grain size of this initial material was ∼56 μm [54]. Then, the annealed sample was deformed by HPT up to 10 turns. The applied load was 6.0 GPa and the processing was carried out at RT with a rotation rate of 1 rpm. The two anvils of the HPT device had shallow central depressions on their outer surfaces, with depth of 0.25 mm and diameter of 10 mm at the bottom and with slightly inclined walls having outer inclinations of 22 degrees, as shown in an earlier report [54]. The thickness of the HPT-processed disks was ∼0.65 mm. All disks were processed under quasiconstrained conditions in which there is a small outflow of material between the two anvils during the processing operation [55,56].

Figure 12.15 Differential scanning calorimetry thermogram obtained at a heating rate of 10 K/min for 4N purity Ag sample processed by 10 revolutions of high-pressure torsion. The temperatures of heat treatments are indicated by solid circles. Reprinted from Z. Hegedűs, J. Gubicza, P. Szommer, N.Q. Chinh, Y. Huang, T.G. Langdon, Inhomogeneous softening during annealing of ultrafine-grained silver processed by HPT, Journal of Materials Science 48 (2013) 7384–7391 with permission from Springer.
To study the softening of the UFG microstructure obtained by HPT, the as-processed disk was annealed up to 650 K in DSC at a heating rate of 10 K/min. The DSC thermogram obtained on a silver disk processed by 10 revolutions of HPT is shown in Fig. 12.15. Two overlapping exothermic peaks were detected between 400 and 500 K, which correspond to the recovery and recrystallization of the UFG microstructure (see later discussion). Without HPT processing there were no DSC peaks as the material was pure without any phase transformations. The first peak begins around 400 K and ends at 440–450 K, where the second peak begins. The end of the second peak is at ∼497 K.To reveal the reason for the double DSC peaks, samples were heat-treated up to the temperatures corresponding to the end of the first peak, as well as to the middle and the end of the second peak (440, 460, and 497 K, respectively), at a heating rate of 10 K/min.
The local softening in the different regions of the annealed samples was studied by nanoindentation. The hardness measurements were carried out using a Berkovich indenter and a maximum load of 5 mN. For each annealed specimen a series of 400 indentations were recorded with the indents arranged in a 10 × 40 matrix with the distance of 15 μm between neighboring indents, as shown schematically in Fig. 12.16. The indentation measurements were started and finished at a distance of ∼25 μm from the top and bottom surfaces of the disk and 40 indentations were made parallel to the axial direction, which corresponds to the total thickness of the disk (650 μm). This process was repeated 10 times, giving 10 hardness values at each position along the axial direction. These values were then averaged and plotted as a function of the distance from the bottom of the disk.

Figure 12.16 Nanoindentation layout on the cross section of the high-pressure torsion (HPT)-processed Ag disk. Reprinted from Z. Hegedűs, J. Gubicza, P. Szommer, N.Q. Chinh, Y. Huang, T.G. Langdon, Inhomogeneous softening during annealing of ultrafine-grained silver processed by HPT, Journal of Materials Science 48 (2013) 7384–7391 with permission from Springer.
The nanohardness distributions obtained on the cross sections of the HPT-processed and the heat-treated disks are plotted as a function of the distance from the bottom surface in Fig. 12.17. It can be seen that after HPT the nanohardness distribution is homogeneous along the axial direction of the disk with a value of 1.8 GPa. After annealing up to the end of the first exothermic DSC peak (∼440 K), a relatively wide region of 250–300 μm in the middle of the disk shows a significant softening to a lower hardness value of 1.1 GPa while the surface layers remain almost as hard as after HPT processing. There are clearly visible sharp transitions between the internal and surface regions. During the second exothermic peak (between 440 and 497 K), the surface regions of the disk also softened from about 1.8 to 1.3 GPa. However, the sharp transitions observed at 440 K disappeared at 460 K, and instead the hardness increases almost linearly from the former transition layers to the surfaces. This result suggests that the softening of the surface region commences at the transition layers during the second exothermic peak [28].
The evolution of the grain structure during annealing of the HPT-processed disk was followed by EBSD on the cross section at the half-radius [28]. Fig. 12.18a and b shows EBSD images obtained before the first DSC peak (400 K) and after the second DSC peak (497 K), respectively. At 400 K the average grain size was ∼200 nm throughout the sample if only the volumes with misorientations higher than 15 degrees were considered as separate grains. This value agrees within the experimental error with the grain size determined immediately after HPT processing. After the second exothermic peak at 497 K, a fully recrystallized microstructure was observed throughout the disk with a characteristic grain size of ∼50 μm (see Fig. 12.18b). The recrystallized grains contain a large number of subgrains with a size of ∼1 μm, which are bounded by twin boundaries. The presence of these twinned volumes is explained by the very low twin boundary energy of silver (∼8 mJ/m2).

Figure 12.17 Nanohardness distributions as a function of the distance from the bottom of the high-pressure torsion (HPT)–processed Ag disk measured on the cross section in the axial direction. The lines serve only as guides to the distributions. The typical error bar is illustrated on the left side of the figure. Reprinted from Z. Hegedűs, J. Gubicza, P. Szommer, N.Q. Chinh, Y. Huang, T.G. Langdon, Inhomogeneous softening during annealing of ultrafine-grained silver processed by HPT, Journal of Materials Science 48 (2013) 7384–7391 with permission from Springer.
Between the two exothermic peaks at about 440 K the nanohardness measurements showed a very narrow transition layer ∼170 μm under both the bottom and the top surfaces of the disk (see Fig. 12.17). The EBSD image in Fig. 12.18c was taken in this region after the heat treatment up to 440 K. The position of the transition layer is denoted by a dashed line. On the left side of Fig. 12.18c a part of a recrystallized grain with a size larger than the linear dimension of the image can be seen from the middle region of the disk. There are numerous small subgrains inside the large grain, which are bounded by twin boundaries. The inset in Fig. 12.18c shows a higher magnification EBSD image of these fine subgrains taken from the designated square on the left of the dashed line. The right side of Fig. 12.18c corresponds to the surface region of the disk, which remains as a UFG microstructure even after the heat treatment up to 440 K. The presence of a UFG structure is confirmed at the higher magnification in Fig. 12.18d. The average grain size in the surface region at 440 K with misorientation limits of 15 degrees was 180 nm. In addition, there is only a negligible change in the misorientation distribution for the surface regions when the temperature increases from 400 to 440 K. These observations suggest that the surface layers with the thickness of ∼170 μm are stable against annealing related to the first exothermic peak. The hardness and EBSD observations suggest that the first exothermic DSC peak is primarily caused by recovery and recrystallization in the middle of the disk, while the second peak corresponds to recovery and recrystallization of the surface regions of the HPT-processed disk. These results demonstrate that the UFG microstructure in the interior of the disk processed by 10 revolutions of HPT is less stable than the surface regions, leading to an inhomogeneous softening during the heat treatment in DSC. The energy released in the second exothermic peak was smaller than that related to the first one, which can be explained by remaining UFG regions in the recrystallized microstructure. Similar regions are shown for ECAP-processed Ag after annealing in Fig. 12.6b. This is in accordance with the higher hardness in the surface regions after the second exothermic peak (see Fig. 12.17) [28].

Figure 12.18 Electron backscatter diffraction micrographs showing the ultrafine-grained (UFG) microstructure before the exothermic differential scanning calorimetry (DSC) peaks at 400 K (a) and after the second peak at 497 K (b). The microstructure after the first DSC peak at 440 K is shown in (c) where the transition layer between the recrystallized interior and the UFG surface layer is indicated by a dashed line. The inset in (c) shows a part of the recrystallized grain in a higher magnification, illustrating that the large grain contains smaller twinned subgrains. A part of the UFG microstructure in the surface region is shown in a higher magnification in (d). Reprinted from Z. Hegedűs, J. Gubicza, P. Szommer, N.Q. Chinh, Y. Huang, T.G. Langdon, Inhomogeneous softening during annealing of ultrafine-grained silver processed by HPT, Journal of Materials Science 48 (2013) 7384–7391 with permission from Springer.
In the middle of HPT-processed disks (located midway between the top and bottom surfaces) the strain is larger than in the surface regions, as shown by model calculations [57], and this is due to the outflow of material between the anvils in quasiconstrained processing [58]. As a consequence there was an axial inhomogeneity of the lattice defect structure in the HPT-processed Ag sample. The average dislocation density at the surface of the disk (∼109 × 1014 m−2) was larger than that in the middle of the disk (∼79 × 1014 m−2) [28]. Due to the larger dislocation density in the interior of the disk, it is anticipated that the number of glide obstacles is larger there than in the surface regions, yielding larger twinning activity. This assumption was proved by X-ray line profile analysis, which gave 1.3%–1.6% and 0.7%–0.9% for the twin-fault probability in the middle and the surface regions of the disk, respectively. The larger twin-fault probability gave a weaker stability of the UFG microstructure against recrystallization. This effect is attributed to the very low energy of twin boundaries. In the volumes where twin boundaries were formed at the expense of dislocations, the stored energy decreased locally by comparison with the neighboring regions. These volumes act as nuclei of defect-free new grains during subsequent annealing, thereby accelerating the recrystallization process. Consequently, both the low SFE and the variation of the strain in the axial direction during HPT are necessary prerequisites for the observation of a double exothermic DSC peak for HPT-processed Ag [28].
12.6. Stability of Nanostructured Cu During Storage at Room Temperature
Nanostructured materials have nonequilibrium microstructures with a high-stored enthalpy due to the large amount of lattice defects (vacancies, dislocations, planar faults, and grain boundaries). The high enthalpy acts as a driving force in annihilation of lattice defects, i.e., reduction in vacancy concentration, dislocation density, and grain growth. Despite the high driving force for recovery and recrystallization, the nanostructures formed in commercially pure materials are usually stable at the temperature of processing due to the retarding effect of impurities and alloying elements. At the same time, in pure nanomaterials annihilation of lattice defects may occur during their storage at the processing temperature (usually at RT). For instance, in the case of 99.98% purity Cu processed by ECAP, the area under the exothermic DSC peak was reduced by a factor of 2–3 during the storage for 4 years at RT indicating a decrease of the energy stored in the microstructure [59]. Fig. 12.19 shows DSC thermograms taken at 40 K/min heating rate immediately after ECAP and storage for 4 years at RT for Cu samples processed by 1 and 10 passes. Similar phenomenon was observed for the samples processed by 3 and 25 passes.

Figure 12.19 Differential scanning calorimetry thermograms obtained immediately after equal-channel angular pressing (ECAP) and storage at room temperature for 4 years in the case of Cu samples processed by 1 and 10 passes. Reprinted from J. Gubicza, S.V. Dobatkin, E. Khosravi, Microstructural stability of Cu processed by different routes of severe plastic deformation, Materials Science and Engineering, A 527 (2010) 6102–6104 with permission from Elsevier.
The reduction in the stored energy indicates the annihilation of lattice defects. After 4 years of storage the parameters of the microstructure determinable by X-ray line profile analysis (crystallite size, dislocation density, edge/screw character, and arrangement of dislocations and twin boundary frequency) remained unchanged within the experimental error, which indicates that recrystallization did not occur or it is marginal during storage for 4 years. If a significant amount of new, dislocation-free grains had been formed, the average dislocation density would have decreased. It should be noted that annihilation of dislocations and recrystallization may occur during longer storage of these Cu samples similarly as reported in previous studies, e.g., in Ref. [60]. The results of X-ray line profile analysis show that the reduction in the stored energy during storage is most probably attributed to the annihilation of lattice defects, which cannot be evaluated by line profile analysis. These defects may be point defects such as vacancies or vacancy agglomerates, which form in a high concentration during SPD as shown in previous papers [5,13,61]. The relation between the stored energy of vacancies per unit mass and the vacancy concentration (cv) is given by Eq. (12.2) where evac and Mmol are 0.195 × 10⁻¹⁸ J [6] and 63.55 g/mol, respectively, for Cu. Assuming that the reduction in the stored energy is attributed solely to the loss of vacancies, the decrease of vacancy concentration during the storage for 4 years was determined from the change of stored energy using Eq. (12.2). The change of cv is plotted as a function of number of ECAP passes in Fig. 12.20. Former studies [6] have shown that in the case of SPD-processed UFG Cu, the vacancies agglomerated into clusters during SPD; therefore most probably mainly clustered vacancies are annihilated during storage at RT.
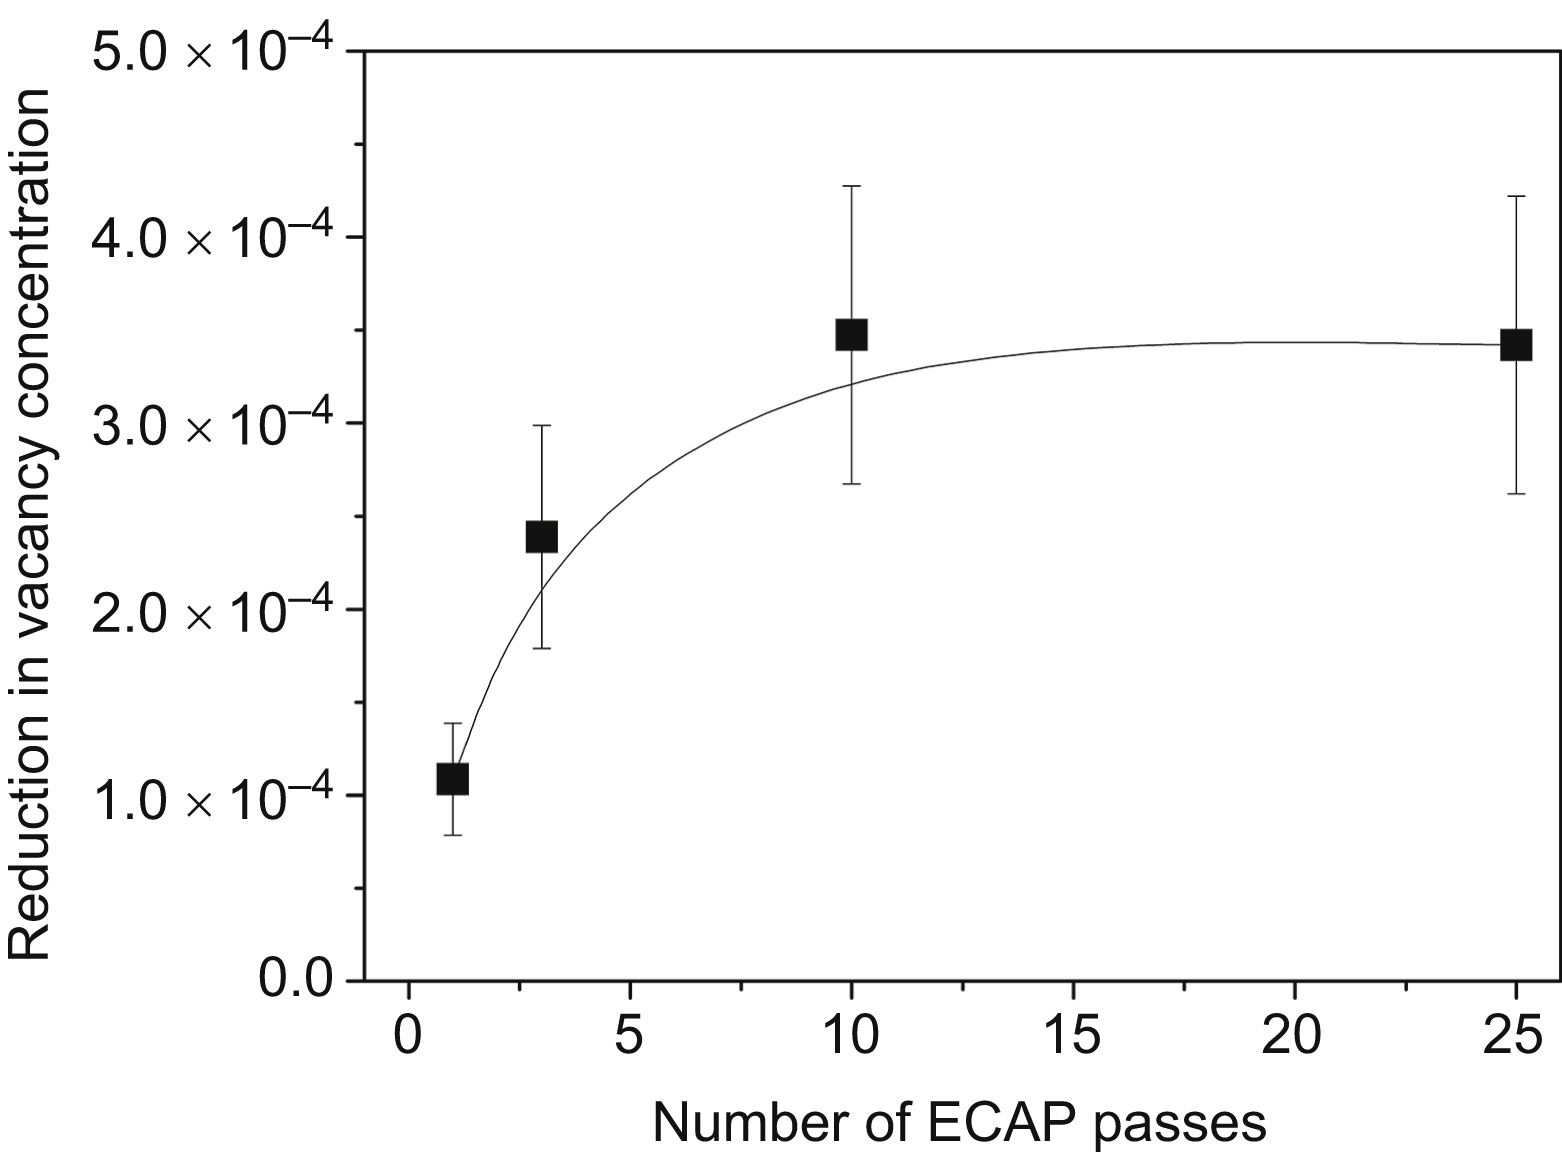
Figure 12.20 The reduction in vacancy concentration determined from the decrease of stored energy in Cu as a function of number of equal-channel angular pressing (ECAP) passes. Reprinted from J. Gubicza, S.V. Dobatkin, E. Khosravi, Microstructural stability of Cu processed by different routes of severe plastic deformation, Materials Science and Engineering, A 527 (2010) 6102–6104 with permission from Elsevier.
The loss of vacancy concentration (∼1–3 × 10⁻⁴) has a similar value as the vacancy content determined previously for Cu samples immediately after ECAP by electrical resistivity measurement or a combination of X-ray line profile analysis and calorimetry (see also Chapter 3) [5]. Therefore, most probably the majority of vacancies formed during ECAP disappeared during storage for 4 years at RT. For supporting this assumption, the stored energy of dislocations (Edisl) was determined from the dislocation density listed in Table 12.5 using Eq. (12.3) [5]. In this equation A stands for the factor depending on the edge/screw character of dislocations, which can be calculated from Eq. (12.4). In that formula parameter q determined from X-ray line profile analysis describes the edge/screw character of dislocations. The theoretically calculated values of q for pure edge and screw dislocations in Cu are 1.68 and 2.37, respectively [62]. The values of q obtained for the samples processed by different number of ECAP passes are given in Table 12.5. The values of stored energy of dislocations (Edisl) calculated from Eqs. (12.3) and (12.4) are also listed in Table 12.5. The values of Edisl are smaller than the released heat measured after 4 years (H4y). The difference (H4y−Edisl) can be attributed to the grain boundaries and the remaining vacancies. As this difference is 4–9 times smaller than the stored energy of vacancies annihilated during 4 years (HECAP–H4y), the remaining vacancy concentration should be much smaller than that of the vacancies disappeared during 4 years, i.e., the values of cv plotted in Fig. 12.20 approximate well the concentrations of vacancies formed during ECAP.
Table 12.5
The crystallite size, the dislocation density (ρ), and the parameter q describing the edge/screw character of dislocations obtained by X-ray line profile analysis
| ECAP passes | Crystallite size (nm) | ρ (1014 m−2) | q | HECAP (J/g) | H4y (J/g) | Edisl (J/g) |
| 1 | 87 ± 9 | 15 ± 2 | 2.0 ± 0.1 | 0.48 ± 0.04 | 0.28 ± 0.03 | 0.23 ± 0.03 |
| 3 | 75 ± 8 | 21 ± 2 | 2.0 ± 0.1 | 0.85 ± 0.09 | 0.41 ± 0.04 | 0.31 ± 0.04 |
| 10 | 64 ± 7 | 20 ± 2 | 1.9 ± 0.1 | 1.0 ± 0.1 | 0.38 ± 0.04 | 0.31 ± 0.04 |
| 25 | 101 ± 10 | 15 ± 2 | 1.7 ± 0.1 | 1.0 ± 0.1 | 0.37 ± 0.04 | 0.27 ± 0.04 |

It is worth to note that the values of cv obtained in this evaluation have the same order of magnitude as the equilibrium vacancy concentration near the melting point. Taking 1.28 eV as the value of vacancy formation energy and 12.2 as the preexponential factor in the Arrhenius-type formula of vacancy concentration [63], 4 × 10⁻²¹ and 2 × 10⁻⁴ are obtained for the equilibrium vacancy concentrations at RT and the melting point, respectively. This means that the vacancy concentration after ECAP at RT is 17 orders of magnitude larger than its equilibrium value. The very large excess of vacancies was most probably formed due to SPD during ECAP. During storage of the ECAP-processed samples, the vacancy concentration might decrease by migration along the boundaries of UFG grains to the free surface and/or by sinking at small dislocation loops. In the latter case, the sink of vacancies is accompanied by the annihilation of dislocation loops. These small loops having a dimension of about 1–2 nm may be formed when mobile dislocations intersect immobile dislocation dipoles. These loops are also invisible by X-ray line profile analysis due to their strongly shielded strain fields and small dimensions. If a large number of loops act as sinks of vacancies, the annihilation of these loops also contributes to the decrease of the stored energy during storage of the samples; therefore the loss of vacancies may be lower than the values plotted in Fig. 12.20. It is noted that the large reduction in vacancy concentration did not yield significant change of the hardness (1.28 GPa) for the ECAP-processed sample during storage for 4 years.
The UFG 99.98% purity Cu processed by 25 HPT revolutions exhibited even stronger recovery during storage at RT, which is accompanied by softening [12]. Generally, the phenomenon when a nanostructure softens due to recovery and recrystallization during storage at the temperature of processing is called “self-annealing.” Fig. 12.21a and b shows TEM images taken immediately after HPT processing of Cu and 4 years of storage, respectively. The comparison of the images revealed a growth of the mean grain size from about 160 to 250 nm. It is noted that some relatively large grains with the size of about 600 nm were also observed after storage for 4 years. X-ray line profile analysis showed that the average crystallite size increased from 75 ± 9 to 122 ± 15 nm while the dislocation density decreased from 37 ± 4 × 10¹⁴ to 13 ± 2 × 10¹⁴ m−2 during storage for 4 years. Simultaneously, the twin boundary frequency increased from 0.1 ± 0.1% to 0.3 ± 0.1%. In the TEM image of Fig. 12.21b some twin boundaries are indicated by white arrows. These changes in the microstructure indicate recovery and/or recrystallization during storage of the sample. As it was discussed in Chapter 3, the high pressure applied during HPT hinders the annihilation processes of dislocations resulting in very high dislocation density and small grain size. During storage of the sample, this extremely high dislocation density and the very small grain size are the driving force of the microstructure transformation. The high density of dislocations results in large internal stresses. Therefore, when the pressure was released after HPT, the vacancy diffusion became faster resulting in annihilation of edge dislocations by climb. Moreover, the internal stresses most probably also cause cross slip of dissociated screw dislocations after HPT. The dislocation density can also decrease by twinning at dislocation pileups developed at glide obstacles. If the local stresses at these obstacles exceed the critical stress required for twin nucleation, after an incubation time twins are formed at the expense of dislocations in the pileups (see Chapter 4) [64]. The operation of this mechanism is supported by the increase in twin boundary frequency from 0.1 ± 0.1% to 0.3 ± 0.1% during storage. It is noted, however, that partial recrystallization may also contribute to the higher twin boundary frequency as twinning usually occurs during recrystallization of fcc metals. The hardness of the HPT-processed sample decreased from 1.69 ± 0.06 to 1.07 ± 0.12 GPa during storage for 4 years as a result of recovery/recrystallization of the microstructure.

Figure 12.21 Transmission electron microscopy images taken immediately after high-pressure torsion processing (a) and 4 years of storage (b). Reprinted from J. Gubicza, S.V. Dobatkin, E. Khosravi, A.A. Kuznetsov, J.L. Lábár, Microstructural stability of Cu processed by different routes of severe plastic deformation, Materials Science and Engineering, A 528 (2011) 1828–1832 with permission from Elsevier.
It is noted that self-annealing was also observed previously in ECAP-processed Cu at RT [60,65,66]. For example, large recrystallized grains were observed in 99.96% purity Cu 8 years after processing by ECAP [60]. Experiments on 5N purity Cu showed that recrystallization occurred only 2 months after ECAP, and the lower recrystallization time for the purer material was explained by the nonavailability of the pinning effect of alloying elements on grain boundaries and dislocations [65]. Nanocrystalline Cu and Ag samples processed by the consolidation of nanopowders also show self-annealing at RT during periods of several days after their production [67,68]. Additionally, it was shown for nanocrystalline Cu and Ag layers, having a thickness of ∼1–20 μm and processed by electroplating, that recrystallization occurs at RT within ∼1–2 days of their production [27,69–73]. It was suggested that during layer processing the organic additives pin the grain boundaries thereby stabilizing the small grain size [69,70]. However, the additives disappear from the layers in several hours after plating, and this leads to recrystallization of the nanostructures. It was found that the reduction of the film thickness from 5 to 2 μm decreased the rate of self-annealing in Ag films [73]. Below the thickness of 300 nm self-annealing was not observed in Cu films [70].
12.7. Self-annealing in Nanostructured Silver: The Significance of a Very Low Stacking Fault Energy
The low SFE in pure materials decreases the stability of nanostructures. First, the smaller the SFE, the larger the distance between partials in dissociated dislocations. The high degree of dislocation dissociation hinders the annihilation by either cross slip or climb that leads to a very large dislocation density during grain refinement by SPD (see Chapter 4). Secondly, the low SFE is associated with a small value of twin boundary energy. For instance, in fcc structures the twin boundary energy is about half of SFE. The low SFE facilitates the formation of recrystallized grains as the nuclei can be separated by low energy twin boundaries from the parent grains. The latter effect gives a smaller stability of nanostructures prepared by either SPD-processing methods or procedures without SPD. It is noted that the low stability of nanomaterials having small SFE can be effectively increased by alloying.
Silver has the lowest SFE among fcc metals; therefore the self-annealing was studied on high-purity UFG 99.995% Ag processed by ECAP [74]. Silver billets were pressed through totals of 1, 4, 8, and 16 passes of ECAP at RT with a pressing velocity of 8 mm/s. Following ECAP, the billets were stored at RT, and the microstructures and mechanical behavior were examined as a function of the time of storage for periods up to a total of 4 months. Fig. 12.22 shows the microhardness of samples processed by different numbers of ECAP passes as a function of the time of storage at RT, where the lower horizontal line denotes the hardness of the initial sample. It is apparent that the hardness after one pass remains unchanged within experimental error even after storage for 4 months. By contrast, the hardness gradually decreases with increasing storage time for the samples processed by 4, 8, and 16 passes thereby demonstrating that the severely deformed microstructure was self-annealed during long-term storage at RT. Compression experiments also confirmed the softening of the samples during storage [74].

Figure 12.22 The microhardness of samples processed by different numbers of equal-channel angular pressing (ECAP) passes as a function of the time of storage at room temperature. Reprinted from J. Gubicza, N.Q. Chinh, J.L. Lábár, Z. Hegedűs, T.G. Langdon, Principles of self-annealing in silver processed by equal-channel angular pressing: the significance of a very low stacking fault energy, Materials Science and Engineering, A 527 (2010) 752–760 with permission from Elsevier.
Complementary XLPA and TEM investigations revealed that the softening in UFG Ag during storage is caused by both recovery and recrystallization [74]. Fig. 12.23a shows a Debye–Scherrer diffraction ring of the 220 reflection obtained immediately after eight passes of ECAP. In this condition the intensity distribution around the ring is relatively homogeneous, thereby indicating a high degree of homogeneity within the microstructure. After 4 months of storage at RT, high intensity spots were observed on the Debye–Scherrer rings for the samples processed through 4, 8, and 16 passes. Fig. 12.23b shows an example for the 220 reflection obtained after processing through eight passes and storing for 4 months. The inhomogeneous intensity distributions in the Debye–Scherrer rings suggest there is a fluctuation in the degree of self-annealing within the microstructure. Since the breadths of the individual high intensity spots were close to the instrumental broadening, it was not feasible to evaluate these parts of the diffraction rings quantitatively. However, these high-intensity spots are most probably scattered from recrystallized grains having larger sizes and lower dislocation densities than the detection limits of the line profile analysis (∼800 nm and ∼1013 m−2 for the crystallite size and the dislocation density, respectively), and the rather homogeneous portions of the Debye–Scherrer rings are most probably related to the recovered volumes. The comparison of the TEM images taken immediately after eight passes and storage for 4 months in Fig. 12.24 proves the occurrence of recrystallization [74]. The ECAP-processed sample has an average grain size of about 200 nm while in the recrystallized volumes the size increased to ∼1 μm. The Debye–Scherrer rings for the samples processed for 4 and 16 passes also became inhomogeneous during storage at RT, whereas the diffraction rings remained homogeneous in the sample processed by one pass even after storage for 4 months.

Figure 12.23 Debye–Scherrer rings for the 220 reflections of X-rays (a) immediately after eight equal-channel angular pressing (ECAP) passes and (b) after eight ECAP passes and storage at room temperature for 4 months. Reprinted from J. Gubicza, N.Q. Chinh, J.L. Lábár, Z. Hegedűs, T.G. Langdon, Principles of self-annealing in silver processed by equal-channel angular pressing: the significance of a very low stacking fault energy, Materials Science and Engineering, A 527 (2010) 752–760 with permission from Elsevier.
The dislocation density and the twin boundary frequency evaluated from the homogeneous portions of the rings are shown as a function of the storage time in Fig. 12.25a and b, respectively [74]. For the sample processed by one pass the dislocation density in Fig. 12.25a remains essentially unchanged, whereas after 4, 8, and 16 passes the dislocation density decreases with the time at different rates. The reduction rate in the dislocation density increases in the order of 16, 4, and 8 passes of ECAP that follows the trend in the initial dislocation density determined immediately after ECAP processing. The higher the initial dislocation density, the faster the recovery. With increasing time of storage, the dislocation density for each specimen converges to the value characteristic of the sample pressed through only one pass (∼16 × 1014 m−2). Fig. 12.25b shows that the twin boundary frequency remains practically unchanged for specimens processed through 1, 4, and 8 passes, but for the 16 passes sample the twin boundary frequency decreases from ∼1.5 ± 0.1% to ∼1.1 ± 0.1% during the first month of storage and thereafter remains unchanged. It is emphasized that the defect densities plotted in Fig. 12.25 were determined from the homogeneous parts of the Debye–Scherrer rings, which are free from the large-intensity spots. Consequently, these values are characteristic only of the recovered parts of the samples, and most probably the mean dislocation density and twin boundary frequency are lower for the whole specimens because of contributions from the recrystallized fractions of the samples.

Figure 12.24 Bright field transmission electron microscopy images from a sample processed through eight equal-channel angular pressing passes (a) and after storage at room temperature for 4 months (b). Reprinted from J. Gubicza, N.Q. Chinh, J.L. Lábár, Z. Hegedűs, T.G. Langdon, Principles of self-annealing in silver processed by equal-channel angular pressing: the significance of a very low stacking fault energy, Materials Science and Engineering, A 527 (2010) 752–760 with permission from Elsevier.

Figure 12.25 (a) The dislocation density and (b) the twin boundary frequency in the recovered volumes of samples stored at room temperature up to 4 months after processing by equal-channel angular pressing (ECAP) through 1, 4, 8, and 16 passes. Reprinted from J. Gubicza, N.Q. Chinh, J.L. Lábár, Z. Hegedűs, T.G. Langdon, Principles of self-annealing in silver processed by equal-channel angular pressing: the significance of a very low stacking fault energy, Materials Science and Engineering, A 527 (2010) 752–760 with permission from Elsevier.
The recovery of the severely deformed microstructure in Ag may occur by cross slip and/or climb of dislocations. It is well known that both mechanisms are thermally activated and stress-assisted processes, and the probability of their occurrence decreases with increasing degree of dislocation dissociation [75,76]. The large splitting distance between partials in Ag leads to a low probability of cross slip and climb, which initially impedes the annihilation of dislocations during ECAP processing thereby resulting in very high dislocation density, but this process may occur by thermal activation after sufficiently long times. In the absence of any assisting stresses, the waiting time for cross slip in Ag is of the order of ∼1013 years, which means that in practice cross slip cannot occur in Ag without assisting stresses (see Chapter 4). In a severely deformed microstructure, however, there are significant internal stresses, originating primarily from the very high density of dislocations, and these stresses will assist the cross slip and climb processes. For example, assuming a value for the assisting stresses of ∼10 MPa, the waiting time for cross slip in silver is reduced to ∼107 s. This means in practice that cross slip may occur some months after the SPD processing thereby giving a delayed recovery for the dislocation structures in Ag processed by ECAP in agreement with the experimental observations. The inhomogeneous recovery of the dislocation structure is attributed to the stress sensitivity of the probability of cross slip and climb [76]. In severely deformed polycrystals, the magnitude of the remaining stresses acting on the glide planes after deformation will change from grain to grain due to the distributions of the dislocations and other defects, such as twins, so that the driving force for cross slip and climb will depend on the specific location within the specimen. As a result, it is anticipated that there will be fluctuations in the waiting times for annihilation of dislocations, and therefore the recovery starts inhomogeneously within the sample. It is apparent from Fig. 12.25a that higher dislocation densities after ECAP are associated with faster rates of recovery so that shorter times are then needed to achieve the stable dislocation density during storage at RT. For all ECAP samples, the stable dislocation density is close to the value obtained immediately after one pass (∼16 × 1014 m−2). The higher initial dislocation density corresponds to a shorter mean spacing between dislocations and therefore higher assisting stresses and consequently faster annihilation. For the sample processed by one pass, the lower dislocation density explains the lack of any significant recovery and also the termination in recovery in the samples processed by four and eight passes when the dislocation density reaches the value characteristic for one pass. It should be noted that an apparent decrease of the dislocation density in the recovered but nonrecrystallized fraction of the samples may also occur if the recrystallization starts in the volumes having the highest dislocation density.
X-ray line profile analysis shows that in the recovered volumes of samples processed through 4–16 passes the dislocation density and the twin boundary frequency do not decrease below the value characteristic of the sample pressed through one pass (Fig. 12.25) while the hardness (Fig. 12.22) for the samples for 4–16 passes fall below the values for one pass after storage for 4 months. This apparent dichotomy is readily explained by the partial recrystallization in the samples processed through 4–16 passes. By increasing the numbers of passes up to 8, the mean dislocation density measured immediately after ECAP increases. The higher dislocation densities in the nonrecovered volumes of the samples will lead to higher driving forces for recrystallization, and accordingly the rate of recrystallization should be faster after larger numbers of passes. At the same time, the mean dislocation density measured immediately after 16 passes is smaller than after eight passes while after 4 months the hardness reduction is the highest for the sample processed by 16 passes. This is attributed to the higher degree of recrystallization in this sample. Processing by ECAP between 8 and 16 passes gives an increase in the twin boundary frequency together with a decrease in the total dislocation density. In locations where the twin boundary frequency increases at the expense of dislocations, the stored energy will decrease as the twin-fault energy in Ag is very low (∼8 mJ/m2 [42]). These volumes will then act as the nuclei in recrystallization, and therefore the time required for grain nucleation will be the shortest for the sample processed by 16 passes. In this case the strongly twinned regions are recrystallized first; therefore, twin boundary frequency decreases in the recovered but nonrecrystallized volumes for the sample processed by 16 passes, which is in line with the experimental results. This is also consistent with observations that the nuclei of recrystallized grains form primarily at deformation twins in low SFE metals such as Ag [77].
The formation of regions where twinning occurs at the expense of dislocations will increase the degree of inhomogeneity in the microstructure and introduce fluctuations in the stored energy in the sample processed by 16 passes. This is consistent with other studies suggesting that heterogeneities in the microstructure may promote recrystallization due to the higher strain energy gradients [65,78]. It is noted that the lower grain boundary energy associated with the larger grain size in the sample processed by only one pass (∼30 μm) than in the specimens processed by 4–16 passes (∼200 nm) may also contribute to the lack of recrystallization in the former material. It should be also noticed that a recent study of annealing in Cu processed by ECAP showed that recrystallization starts heterogeneously primarily in regions where grain boundaries have high angles of misorientation [79]. Since the angle of misorientation at grain boundaries usually increases with increasing numbers of passes in ECAP [49,80], it is reasonable to anticipate that recrystallization in Ag will be faster after larger numbers of passes. It is noted that self-annealing was also observed in HPT-processed high-purity Ag (99.99%) and Au (99.999%) samples [81].
It should be noted that the impurity content has a strong influence on the self-annealing phenomenon. When the purity level in ECAP-processed Ag changed from 4N5 to 4N, the degree of self-annealing was reduced [82]. The hardness as a function of storage time for 4N purity samples is shown in Fig. 12.26. The two times higher impurity content in 4N specimens yielded a considerably better stability in the UFG Ag samples produced by ECAP compared to the 4N5 purity specimens. The hardness of the sample processed by one pass remained unchanged within the experimental error similar to the case of higher purity material. At the same time, and contrary to the 4N5 material, the hardness of 4N purity Ag specimens after 4, 8, and 16 passes did not fall below the value obtained after one pass. The much better stability of the UFG microstructure in the less pure samples is confirmed by a comparison of the TEM images of Fig. 12.27 taken on specimens processed by eight passes and stored at RT [82]. Fig. 12.27a shows that in the 4N5 purity sample only fully recrystallized volumes are detected after 4 months of storage while in the 4N purity specimen remaining UFG regions are also observed even after 1 year of storage, as illustrated in Fig. 12.27b. The higher stability of the ECAP-processed 4N purity samples can be attributed to the larger impurity content that retards recovery and recrystallization processes during storage of the samples. In addition, as the twinned volumes in ECAP-processed Ag may act as nuclei for recrystallization, the lower twin-fault probability in the 4N purity samples processed by 8 and 16 ECAP passes compared to 4N5 purity counterparts (see Chapter 4) may contribute to the better stability at RT.

Figure 12.26 Values of the microhardness after processing by equal-channel angular pressing (ECAP) for 1, 4, 8, and 16 passes as a function of the storage time at room temperature for 4N purity Ag. Reprinted from Z. Hegedűs, J. Gubicza, M. Kawasaki, N.Q. Chinh, Z. Fogarassy, T.G. Langdon, The effect of impurity level on ultrafine-grained microstructures and their stability in low stacking fault energy silver, Materials Science and Engineering, A 528 (2011) 8694–8699 with permission from Elsevier.

Figure 12.27 Bright field transmission electron microscopy images showing the microstructures of (a) the 4N5 purity sample processed through eight equal-channel angular pressing (ECAP) passes and stored at room temperature for 4 months and (b) the 4N purity specimen after eight ECAP passes and storage for 1 year. Reprinted from Z. Hegedűs, J. Gubicza, M. Kawasaki, N.Q. Chinh, Z. Fogarassy, T.G. Langdon, The effect of impurity level on ultrafine-grained microstructures and their stability in low stacking fault energy silver, Materials Science and Engineering, A 528 (2011) 8694–8699 with permission from Elsevier.
12.8. Self-annealing in Severe Plastic Deformation–Processed Alloys With Low Melting Point
The change of the microstructure during storage at RT was observed not only for pure UFG metals but also for SPD-processed alloys, such as Zn–Al and Pb–Sn alloys [83,84]. In these alloys the recovery and recrystallization of the UFG microstructure occurred due to their low melting points and not owing to the medium or low SFE as in the case of Cu or Ag. The other important difference between the self-annealing in low SFE pure metals and alloys with low melting points is that in the latter case the grain growth yielded hardening at RT contrary to the trend observed in pure metals.
The UFG Zn–22% Al eutectoid and Pb–62% Sn eutectic two-phase alloys were produced by HPT at RT under quasiconstrained conditions at a pressure of 3 GPa and a rotational speed of 1 rpm [83]. The number of turns was 1. After HPT processing, the disks were stored at RT for about 1 month to study the change of microstructure. In the case of the Zn–Al alloy the grain size before HPT was ∼1.4 μm for both phases. Due to one turn of HPT the grain size was refined to ∼200 nm at the periphery of the HPT-processed disk. As the imposed strain decreases with increasing the distance from the periphery along the disk radius, there is probably a lower degree of grain refinement close to the sample center. Fig. 12.28 shows a schematic graph of the hardness distribution along the disk diameter. Immediately after one turn of HPT the hardness in the center is only slightly higher than the value measured before HPT processing. This hardening was most probably caused by the increased dislocation density. During storage of the HPT-processed sample at RT, the hardness slightly reduced at the disk center most probably due to the annihilation of dislocations. Owing to the low melting point of the investigated Zn–Al alloy, the temperature of storage (RT) corresponded to a low homologous temperature; therefore recovery and recrystallization occurred easily.

Figure 12.28 Schematic graph of the hardness distribution along the diameter of the Zn–22% Al disk processed by one turn of high-pressure torsion (HPT). The hardness before HPT and the evolution of the hardness distribution due to storage at room temperature are also shown [83].
Fig. 12.28 shows that immediately after HPT the hardness decreases by increasing the distance from the disk center. This behavior differs from the trend observed for metals and alloys with high melting point. For those materials the hardness usually increases by increasing the distance from the center since the higher dislocation density and the smaller grain size impede more effectively the motion of dislocations inside the grains. In UFG Zn–22% Al alloy, the diffusion is fast due to the fine grain size and the low melting point; therefore, the diffusion-controlled deformation mechanisms, such as grain boundary sliding, became important during plastic deformation. As these mechanisms require lower stress than the dislocation motion through the glide obstacles, the material softened due to HPT at the periphery of the disk. This phenomenon is referred to as strain softening, and it was also observed for pure Sn, Pb, Al, In, and Zn [85]. The degree of softening in the HPT-processed disk increased with increasing the distance from the center owing to the stronger grain refinement [83]. The storage for 33 days led to a growth of both Zn and Al grains to ∼450 nm at the disk periphery. The grain coarsening yielded a reduction of the role of grain boundary diffusion in plastic deformation, thereby increasing the hardness during storage (see Fig. 12.28). It should be noted that the contribution of diffusion-controlled mechanisms to plasticity depends not only on the homologous temperature of deformation but also on the strain rate. As diffusion requires time, the higher the strain rate, the lower the contribution of diffusion to plasticity. Therefore, at the periphery of the disk the strength reduction due to HPT might be smaller if the hardness measurement was carried out at higher deformation rate. This is also valid for the hardness change caused by self-annealing at the disk periphery: the increment in hardness during storage at RT might be lower if it was measured at a higher rate. Moreover, at high strain rates when dislocation motion is the main deformation mechanism, the hardness may decrease due to grain growth during the storage of the HPT-processed UFG Zn–22% Al disks.
For the HPT-processed Pb–62% Sn eutectic two-phase alloy, similar grain growth was observed during storage at RT as for Zn–22% Al alloy [83]. The initial average grain sizes prior to HPT were ∼2.9 and ∼1.9 μm for the Sn- and Pb-rich phases, respectively. HPT processing yielded a reduction in grain size to ∼1.4 μm in the Sn-rich phase and ∼800 nm in the Pb-rich phase at the disk periphery. After 11 days of storage the grain sizes in the Sn- and Pb-rich phases increased to ∼2.0 and ∼1.3 μm, respectively, at the peripheral part of the HPT-processed disk. The hardness distribution along the disk diameter and its evolution during storage at RT showed the same trends as for Zn–22% Al alloy. It was also proved that HPT yielded an increment in the fraction of HAGBs [83], which also facilitated the occurrence of grain boundary sliding in hardness measurement. It also worth to note that in these two-phase alloys the grain coarsening seemed to occur by dissolution of small grains [83]. The hardness increment at the periphery of the HPT-processed Zn–22% Al and Pb–62% Sn disks were 50% and 400%, respectively, during about 1 month of storage. The higher softening for Pb–62% Sn alloy can be explained by the larger homologous temperature of HPT, compared to the case of Zn–22% Al alloy, namely, RT corresponds to the homologous temperatures of 0.43 and 0.65 for Zn–22% Al and Pb–62% Sn alloys, respectively. It was also shown [84] that HPT increased the strain rate sensitivity for Pb–62% Sn alloy from ∼0.2 to ∼0.4, which is in accordance with the stronger role of grain boundary sliding in plastic deformation (e.g., in hardness measurement) of the HPT-processed sample.
12.9. Evolution of Size and Shape of Gold Nanoparticles During Their Storage at Room Temperature
It has been shown that the size and shape of Ag, Pd, and Au nanoparticles with the initial size of a few nanometers change during their storage at RT [86–90]. These nanoparticles attract considerable attention due to their unusual behavior, such as localized surface plasmon resonance (LSPR), which predestine their novel practical applications in different important fields, e.g., in cancer diagnosis and therapy. When coated with specific antibodies, Au nanocrystals can be used to probe the presence and position of antigens on cell surfaces as well as to potentially deliver therapeutic agents selectively. For instance, cetyltrimethylammonium bromide (CTAB)–coated gold nanoparticles has been successfully applied in breast cancer diagnosis. The size and shape of noble metal nanoparticles influence their functional properties; therefore, the stability of the nanoparticle morphology is important from the point of view of practical applications. It is noted that CTAB can effectively stabilize the small size of gold crystals, but it also plays a very important role in controlling the shape of nanoparticles during their growth.
The stability of CTAB-coated gold nanoparticles was studied during their storage at RT [90]. The size of the as-processed spherical nanoparticles was between 2 and 5 nm as it is shown in the TEM image of Fig. 12.29a. The Au–CTAB nanoparticles were dispersed and stored in distilled water at RT. After storage for 1 year, nanoparticles taken from the solution were investigated by TEM, revealing a particle coarsening as shown in Fig. 12.29b. The size of the coarsened nanoparticles was between 15 and 40 nm (the average size was 25 nm), and there was a large variety in their shapes: spheres and regular shapes with two-, three-, five-, or sixfold symmetry were observed.

Figure 12.29 Transmission electron microscopy images obtained on Au–cetyltrimethylammonium bromide nanoparticles. (a) Immediately after production the size of the spherical Au nanoparticles was 2–5 nm, and (b) after 1 year of storage the gold particles grew to about 25 nm and exhibited different shapes. Reprinted from J. Gubicza, J.L. Lábár, L.M. Quynh, N.H. Nam, N.H. Luong, Evolution of size and shape of gold nanoparticles during long-time ageing, Materials Chemistry and Physics 138 (2013) 449–453 with permission from Elsevier.

Figure 12.30 Transmission electron microscopy images showing the different types nanoparticles with regular morphology after 1 year of storage. (a) Decahedron (D) and triangular plate (TP). (b) Deca-tetrahedron (DT) and rod (R). The inset shows a schematic drawing of the three-dimensional morphology of a DT. (c) Bipyramid (BP). (d) The arrow indicates that the twin boundaries in a rod are lying parallel to its longitudinal axis. Reprinted from J. Gubicza, J.L. Lábár, L.M. Quynh, N.H. Nam, N.H. Luong, Evolution of size and shape of gold nanoparticles during long-time ageing, Materials Chemistry and Physics 138 (2013) 449–453 with permission from Elsevier.
Fig. 12.30 shows magnified view of particles with regular shapes. The nanoparticles exhibiting three- and fivefold symmetries are triangular plates and decahedrons denoted by TP and D in Fig. 12.30a, respectively. A fivefold twinned, decahedral nanoparticle can be considered as an assembly of five single-crystal tetrahedral units sharing a common edge. Each tetrahedron is separated from its two neighbors by twin boundaries on {111} planes [91]. Since the theoretical angle between two {111} planes of a tetrahedron is 70.53 degrees, five tetrahedrons joined with {111} twin planes will leave a gap of 7.35 degrees; therefore, after joining the tetrahedra, large elastic stresses are developed. This stress field can be described as the stress field of a disclination [92], which can be released by formation of dislocations. It has been shown that decahedral fcc nanoparticles did not develop through assembling of tetrahedra formed separately but rather produced via the stepwise growth of tetrahedral units on the {111} facets of intermediate species [93]. It has been also revealed that another route of this growth mechanism may result in icosahedron particles comprising 20 tetrahedrons. Intermediates of these icosahedral particles, which arise from a combination of 10 tetrahedral units (deca-tetrahedra), were observed among the Au–CTAB nanoparticles after 1 year of storage. For instance, the particle with sixfold symmetry in Fig. 12.30b is a deca-tetrahedron (denoted by DT) where the six triangular faces are the {111} facets of six tetrahedra from the 10 units building up the particle (see the schematic drawing in the inset of Fig. 12.30b). These tetrahedra are separated by twin boundaries. Both decahedron and icosahedron are thermodynamically favorable shape of Au and Ag nanocrystals since they are enclosed by very low energy {111} facets [93]. In general, in fcc nanocrystals the low-index crystallographic facets have the smallest specific surface energies (e.g., {111} and {100}); therefore, they usually encase the nanocrystals [94]. Since {111} facets have the lowest energy [91] and the twin-fault energy is also very low for Au and Ag [47], the free energies of twinned decahedron and icosahedron nanocrystals are lower than those of a single-crystal Wulff polyhedron (a truncated octahedron enclosed by a mix of {111} and {100} facets). It is noted that the Au particles in Fig. 12.30 have rounded vertices, suggesting that the total surface energy of this morphology is lower than that for the nanocrystals with perfect regular shape due to the smaller total surface area in the former case.
Besides the thermodynamical viewpoint, the kinetics of crystal growth can also influence the shape of Au nanoparticles [95]. When the initial nanocrystal contains a stacking fault, the Au atoms add preferentially to the vicinity of the fault, thereby yielding a fast crystal growth parallel to the stacking fault [91]. Finally, a trigonal thin plate will form with the top and bottom faces being {111} facets [87]. The side surfaces are usually also {111} facets. It is emphasized that the growing of platelike nanocrystals is never favored in terms of thermodynamics. The formation of triangular plates during aging of Au–CTAB sample is proved by the TEM image in Fig. 12.30a. When the initial crystal is singly twinned, then it will most probably grow into right-bipyramid, which is a nanocrystal consisting of two right tetrahedrons symmetrically placed base-to-base and enclosed by {100} facets [96]. Fig. 12.30c shows some bipyramids denoted as BP.
The presence of a capping agent (e.g., CTAB) on the surface of nanocrystals can also influence the shape of the growing particles since the binding affinity of the capping agent can be different for the various crystal facets [91]. The strong binding of the capping agent to a particular facet can effectively hinder the addition of atoms; therefore, the adatoms rather join other facets and the crystal will grow perpendicular to the latter faces. As a consequence, the facets with a lower addition rate will occupy more space on the surface of the nanoparticle. For example, bromide ions in CTAB bind most strongly to the {100} facets; therefore, Au atoms will add preferentially to the poorly passivated {111} facets. Then, these adatoms migrate to the face edges, resulting in an elongation of the {100} facets and a formation of rods or beams [97]. Some rods in the present Au–CTAB specimen are shown in Fig. 12.30b and d. The diameter and the length of the rods are 10–20 and 25–110 nm, respectively, while the aspect ratio varies between 2 and 9. It has been shown that similar rods can grow from both single-twinned bipyramids [98] and multiply twinned decahedrons [97].
The evolution of the particle size and morphology during storage is most probably initiated by a reduction in coverage of the surfaces of particles by CTAB. This capping agent stabilized the shape of the initial nanocrystals for a while; however, their degradation or gradual release into the solution enables the dissolution of the smallest gold nanoparticles and the growth of the larger particles, similar to Ostwald ripening. Ostwald ripening of CTAB-stabilized gold nanoparticles was reported after 7 days storage in hydrogen peroxide (H2O2) at RT [99]. In that case, H2O2 redox induced simultaneous dissolution and growth of gold nanoparticles and bromide (Br−) from CTAB helped to form AuBr2− in aqueous solution at RT. The TEM image in Fig. 12.31 shows that during storage of Au–CTAB nanoparticles besides growth via atomic addition, the nanoparticles can directly merge into larger objects via agglomeration (the arrow indicates the joint surface). The factors influencing the shape of fcc nanoparticles and the resulted crystal morphologies are summarized in Fig. 12.32.

Figure 12.31 Transmission electron microscopy image of fused Au nanoparticles after storing them for 1 year. The arrow indicates the joint surface of two fused nanoparticles. Reprinted from J. Gubicza, J.L. Lábár, L.M. Quynh, N.H. Nam, N.H. Luong, Evolution of size and shape of gold nanoparticles during long-time ageing, Materials Chemistry and Physics 138 (2013) 449–453 with permission from Elsevier.
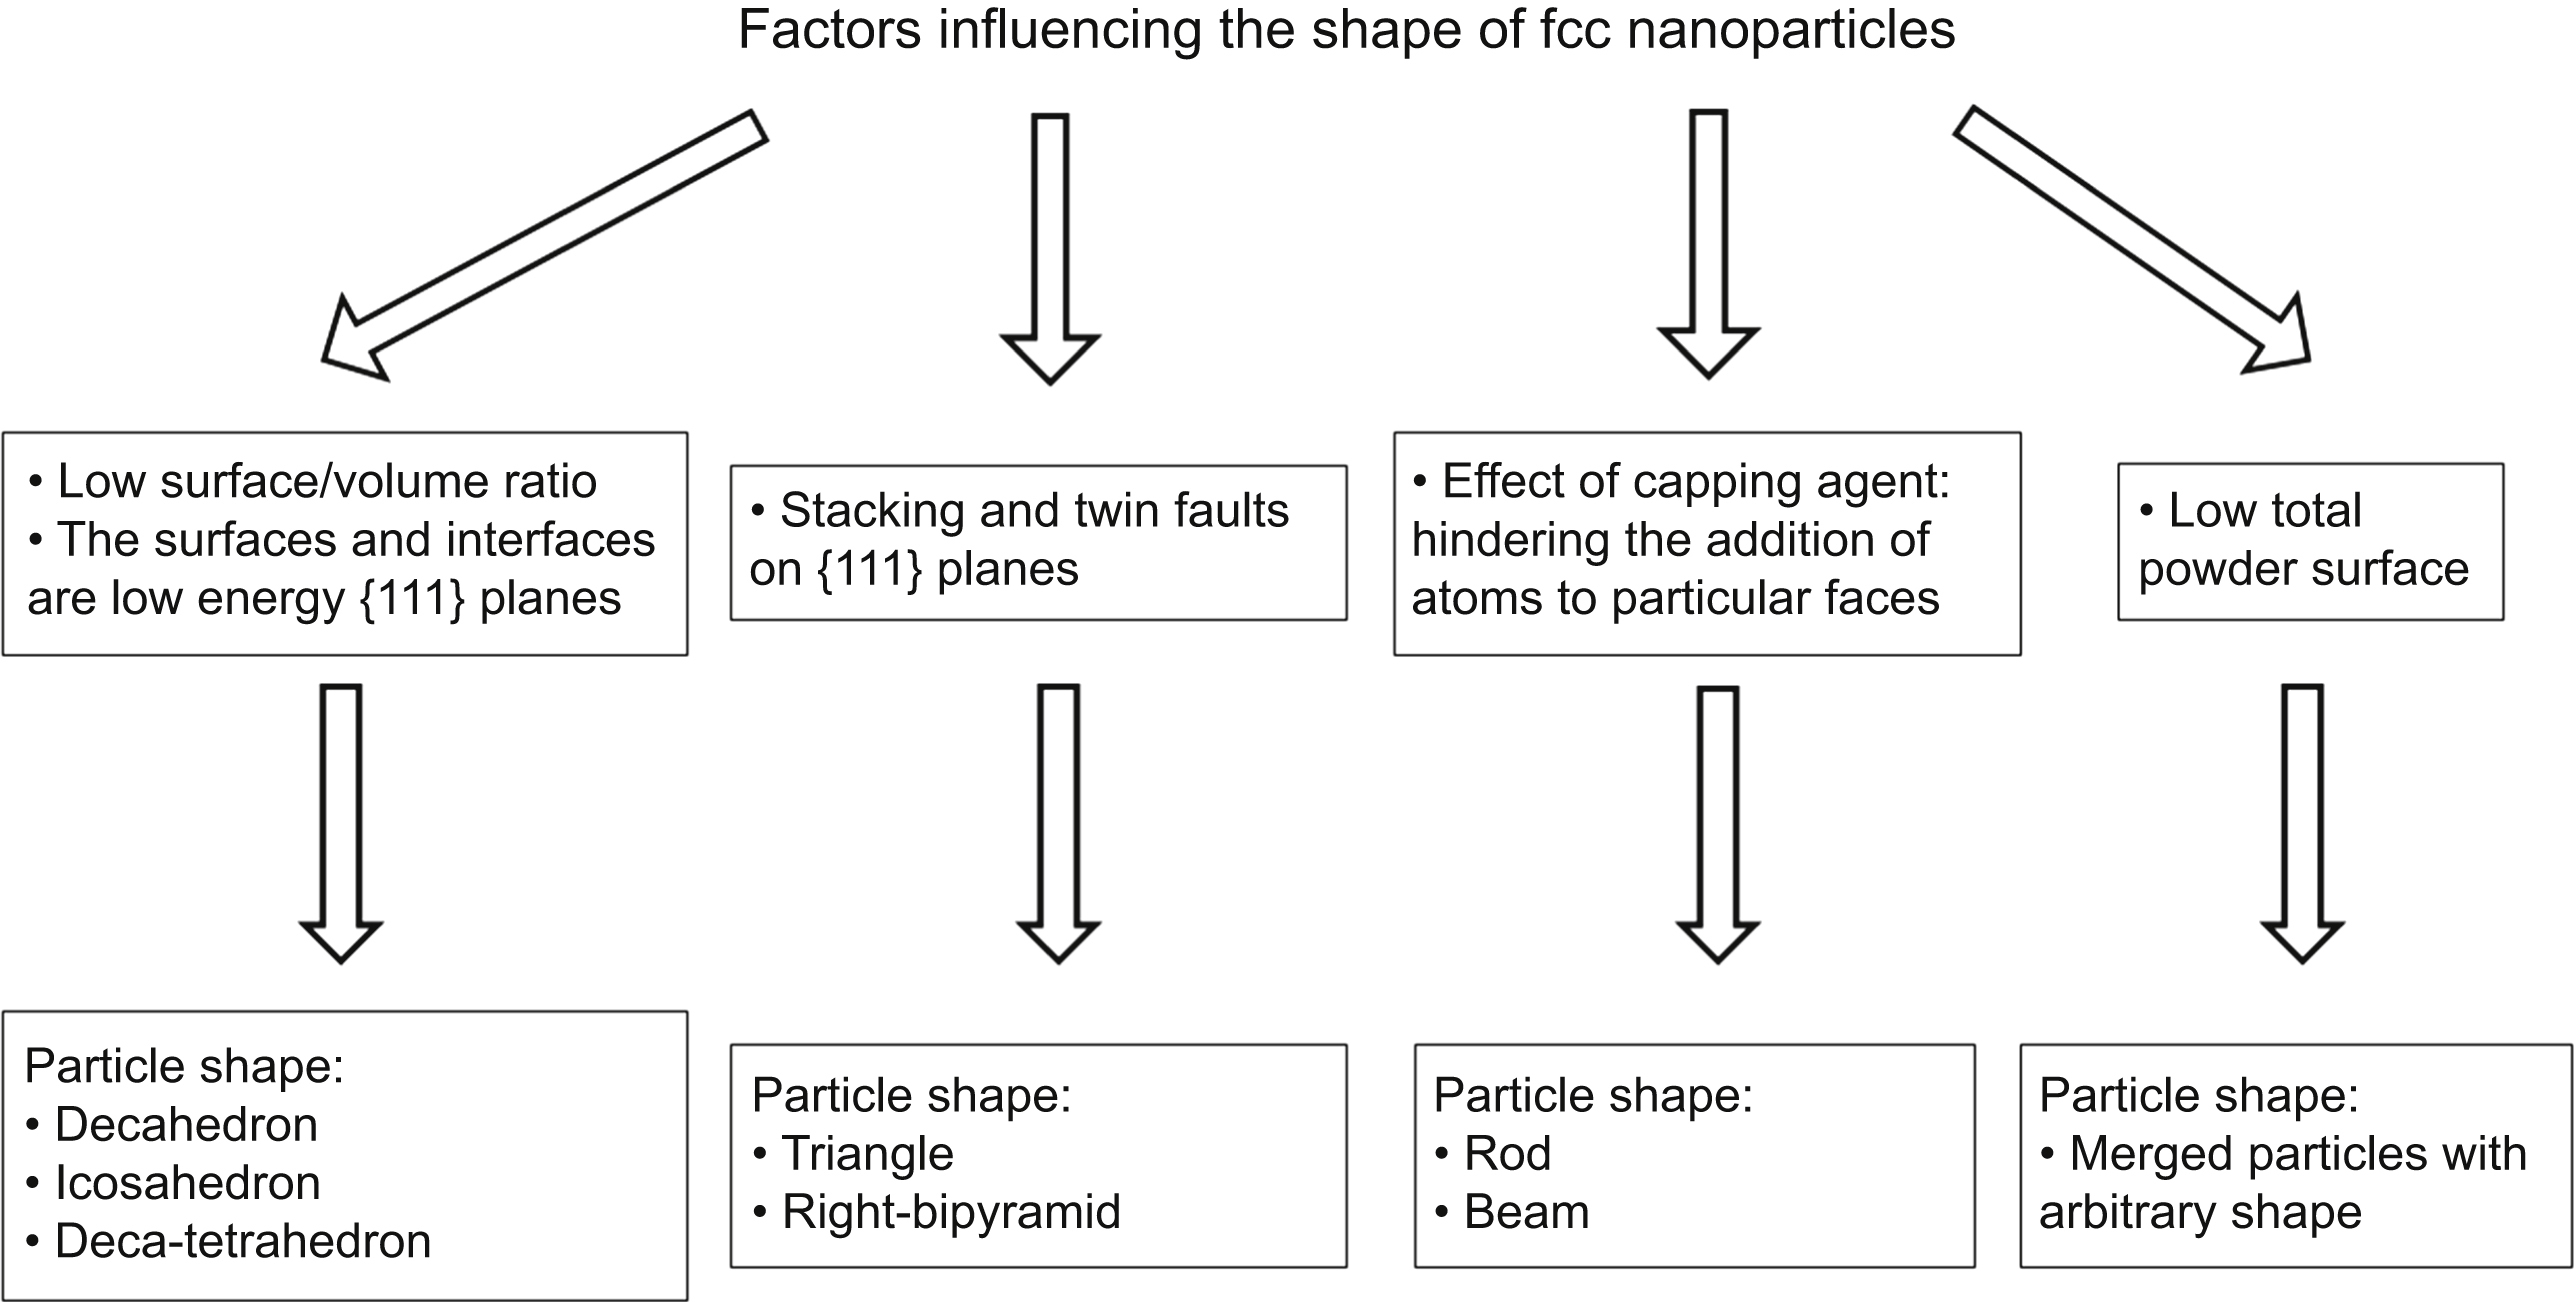
Figure 12.32 The factors influencing the shape of face-centered cubic nanoparticles and the resulted crystal morphologies.
The TEM images in Fig. 12.30 reveal that there was a very high density of twin boundaries in the Au nanoparticles stored for 1 year. These twin boundaries separate the tetrahedral units in the decahedra, deca-tetrahedra, and bipyramids. The twin boundaries in the rods are lying parallel to the long axis. To characterize the frequency of twin boundaries quantitatively, X-ray line profile analysis was performed on Au nanoparticles. The full width at half maximum of the X-ray diffraction peaks as a function of the length of the diffraction vector (g = 2sinθ/λ, where θ and λ are the diffraction angle and the wavelength of X-rays, respectively) are plotted in Fig. 12.33 (Williamson–Hall plot, see Section 2.2). Since the majority of nanoparticles have equiaxed shape, the much larger broadening of (200) and (400) reflections compared to other peaks is a fingerprint of the very high amount of twin boundaries. The twin boundary frequency was determined by fitting the experimental diffraction pattern by the convolutional multiple whole profile method (see Section 2.2). The evaluation gives 5.3 ± 0.6% for the twin boundary frequency, which means that every 20th {111} plane is a twin fault. Taking into account that the distance between the neighboring {111} planes in Au is d111 = 0.235 nm, the twin boundary frequency (β) can be transformed into a mean twin spacing as 100·d111/β. For the present gold nanoparticles the mean twin spacing obtained by X-ray line profile analysis is 4.4 nm, which is in accordance with the TEM observations. The mean crystallite size ( ) obtained from the pattern fitting is 25 ± 3 nm, which is in good correlation with the average particle size obtained by TEM. Fig. 12.32 also reveals that the broadening of the higher-order peak in a harmonic reflection pair is larger [compare (200) and (400) or (111) and (222) reflection pairs], which indicates lattice strain inside the nanoparticles. The average elastic strain calculated by X-ray line profile analysis was about 0.4% [90].

Figure 12.33 Williamson–Hall plot of the full width at half maximum (FWHM) of the X-ray diffraction peaks as a function of the length of the diffraction vector (g) for Au nanoparticles after 1 year of storage. Reprinted from J. Gubicza, J.L. Lábár, L.M. Quynh, N.H. Nam, N.H. Luong, Evolution of size and shape of gold nanoparticles during long-time ageing, Materials Chemistry and Physics 138 (2013) 449–453 with permission from Elsevier.
..................Content has been hidden....................
You can't read the all page of ebook, please click here login for view all page.