
Chapter 10
Lattice Defects and Diffusion in Nanomaterials
Abstract
The diffusion rate in nanomaterials is influenced strongly by the type and densities of lattice defects. Generally, dislocations and grain boundaries are paths for fast diffusion; however, the actual atomic arrangement around these defects also influences the diffusion along them. In this chapter, the most important models, formulas, and methods for the evaluation of diffusion along grain boundaries and dislocations are overviewed. The effect of solute segregation and misorientation on grain boundary self-diffusion is revealed. It was found that the larger the free volume and the energy of grain boundaries, the faster the grain boundary diffusion. In ultrafine-grained metallic materials processed by severe plastic deformation (SPD), a hierarchical microstructure develops with nonequilibrium and relaxed grain boundaries, which are paths for fast and slow grain boundary diffusion, respectively. As the fraction of boundaries exhibiting fast diffusion is very small (under 0.5%), the diffusion rate in nanomaterials is determined by the relaxed boundaries. The diffusivity for these boundaries is very close to that observed for grain boundaries in coarse-grained materials. Therefore, the faster diffusion in nanomaterials compared to coarse-grained counterparts is caused basically by the larger amount of grain boundaries and not by their different quality. In nanomaterials processed by SPD, the fastest diffusion path is provided by the percolating pores at grain boundaries formed by agglomeration of excess vacancies. However, the contribution of these defects to the total diffusivity is very small due to their marginal volume fraction. In nanomaterials processed by powder metallurgy, the diffusivity for interagglomerate interfaces between particles and pores is several orders of magnitude larger than that for intraagglomerate boundaries. Similar bimodal diffusivity is observed for nanomaterials obtained by crystallization of amorphous materials. Here, the slow and fast diffusion pathways are the amorphous and conventional crystalline interfaces. The diffusion along amorphous boundaries is slower than that for crystalline interfaces.
Keywords
Activation energy; Grain boundary diffusion; Interagglomerate and intraagglomerate interfaces; Nonequilibrium grain boundary; Relaxed grain boundary; Slow and fast diffusion paths
10.1. Effect of Lattice Defects on Diffusion
In nanostructured materials, the mass transport is faster than in coarse-grained counterparts due to the large amount of lattice defects, such as dislocations, grain boundaries, and interfaces. Along these defects the atomic diffusion is more rapid than in the bulk material. First, let us overview briefly the influence of lattice defects on diffusion. The rate of diffusion is usually characterized by the diffusion coefficient, D (also referred to as diffusivity). If the basic step of the diffusion of an atom is the position exchange with a vacancy, D can be expressed as:
![]() (10.1)
(10.1)
where dL is the spacing between the atomic sites (i.e., the lattice spacing) in the direction of diffusion, cv is the vacancy concentration, ν0 is the frequency of thermal vibrations of atoms in the lattice, GVM is the Gibbs free energy for vacancy migration, R is the universal gas constant, and T is the absolute temperature in Kelvin degrees. If the studied material is in thermal equilibrium, the vacancy concentration can be given as:
![]() (10.2)
(10.2)
where GVF is the Gibbs free energy for vacancy formation. In this case the diffusion coefficient can be expressed by the following simple formula:
![]() (10.3)
(10.3)
where D0 is the frequency factor, EVF and EVM are the formation and migration energies of vacancies, respectively, and p is the pressure. VVF and VVM are the formation and migration volumes of vacancies, respectively. For atmospheric pressure the term p(VVF + VVM) is about five orders of magnitude smaller than EVF or EVM, therefore it can be neglected in Eq. (10.3). The sum of EVF or EVM is referred to as the activation energy of diffusion and denoted as Q, therefore Eq. (10.3) can be written as (Arrhenius equation):
![]() (10.4)
(10.4)
Eq. (10.1) indicates that a larger vacancy concentration yields a higher diffusivity. Therefore, excess vacancies (i.e., the vacancy concentration above the equilibrium value) may result in a much higher diffusion coefficient than the value determined from Eq. (10.4). Large concentration of excess vacancies may develop during grain refinement in metallic materials processed by severe plastic deformation (SPD). It is noted that the Gibbs free energy of lattice self-diffusion is about 40% of the cohesive energy for pure face-centered cubic (fcc), body-centered cubic (bcc), and hexagonal close-packed (hcp) materials [1]. For interstitial diffusion, vacancy is not needed for atomic migration, therefore Q = EIM, where EIM is the migration energy of interstitials. The fast diffusion of interstitials is attributed to their low Q values.
For self-diffusion and migration of substitutional atoms, the order of magnitude of Q is 1–3 eV (96–288 kJ/mol); however, its value depends on the atomic environment of diffusing element. For instance, the diffusion along lattice defects with free volumes (e.g., dilational sides of edge dislocations or incoherent grain boundaries) is faster than in the bulk material. The variation of the logarithm of self-diffusion coefficient as a function of the reciprocal of temperature for bulk lattice, general grain boundaries, and free surface is illustrated schematically in Fig. 10.1. The lower slope corresponds to smaller activation energy of diffusion. The activation energy of diffusion along grain boundaries is about two times smaller than for lattice diffusion. Grain boundary self-diffusion in metals is about four to six orders of magnitude faster than bulk lattice diffusion, depending on the temperature (the difference is larger for lower temperatures) [2]. The large difference between the bulk and grain boundary diffusion coefficients is mainly caused by the difference in the activation energies, while the preexponential factors DL0 and DGB0 are only slightly different. It is noted that at temperatures close to the melting point the grain boundary diffusion coefficient approximates the diffusion coefficient in the melt. The diffusion activation energy along dislocations is similar to grain boundaries. The easiest atomic migration can be observed on the free surface that is indicated by the four times smaller activation energy compared to the value determined for lattice diffusion. For pure fcc metals, the lattice self-diffusion activation energy has a linear relationship with the melting point (Tm):
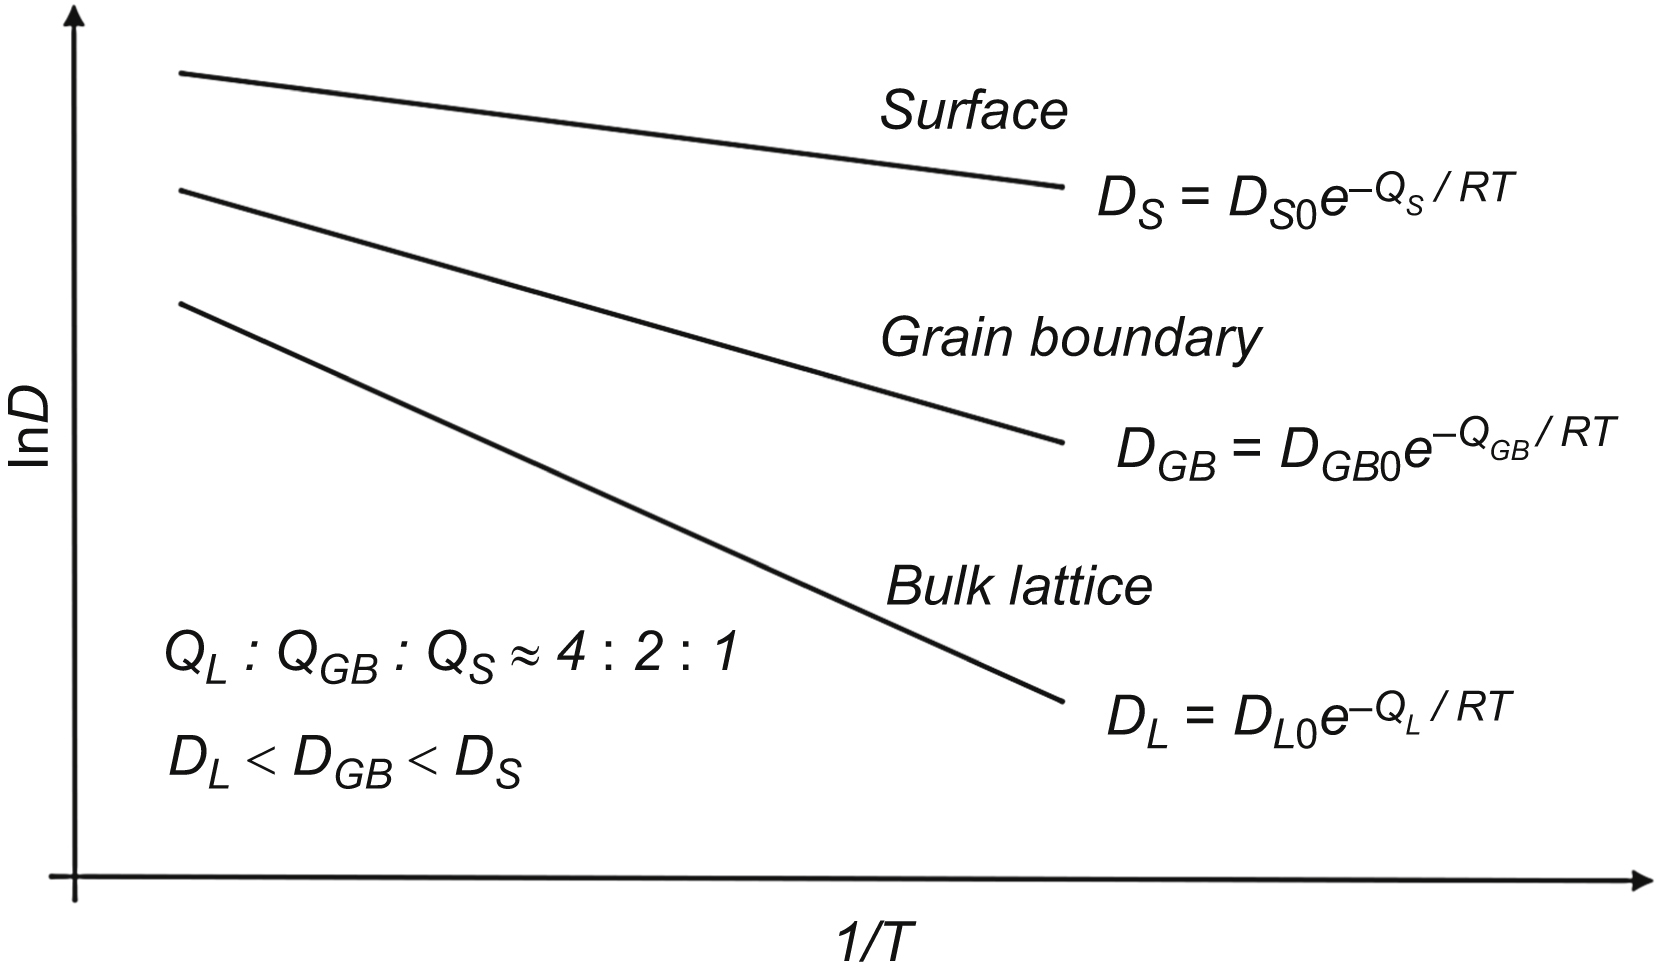
Figure 10.1 Schematic of diffusion coefficient (D) versus reciprocal of temperature (T) for bulk lattice, general grain boundaries (GBs), and free surface. The diffusion coefficient is plotted in logarithmic scale. DS, DGB, and DL stand for the diffusion coefficients for surface, grain boundary and lattice diffusion.
![]() (10.5)
(10.5)
where CL ≈ 0.155 kJ mol−1 K−1. In the case of grain boundary self-diffusion in fcc metals, a similar relationship holds (QGB = CGB × Tm) with CGB of about 0.078 kJ mol−1 K−1. For bcc and hcp metals the values of CGB are equal to 0.092 and 0.087 kJ mol−1 K−1, respectively [2].
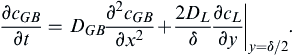
Because of the fast diffusion along grain boundaries, they can be considered as short-circuit diffusion paths in materials. However, the diffusion usually occurs in both bulk lattice (inside the grains) and grain boundaries concomitantly. When the grain boundary self-diffusion of a material is investigated experimentally, a tracer atom layer is deposited on the surface and the tracer atom distribution is investigated as a function of time at a given temperature. Fig. 10.2a shows the basic processes and the tracer atom diffusion profile developed in the vicinity of a grain boundary during simultaneous lattice and grain boundary diffusion. The following processes operate during the migration of tracer atoms from the deposited layers: direct lattice diffusion from the surface, diffusion along the grain boundaries, partial leakage from the grain boundaries to the grain interiors, and the subsequent bulk diffusion near the grain boundaries (Fisher's model) [2–5]. In the leakage process, a fraction of atoms diffusing along the grain boundary leaves it and migrates in the bulk lattice adjacent to the boundary. As the grain boundary diffusion is faster than the atomic migration in the bulk lattice, therefore the penetration depth of tracer atoms is larger in the grain boundary than in the bulk lattice, as indicated in Fig. 10.2a. It is assumed that the tracer concentration is constant along the thickness of the grain boundary, i.e., it does not depend on the coordinate y (see Fig. 10.2a). The thickness of the grain boundary is denoted as δ, and its value can be approximated as 0.5 nm [2]. According to the diffusion processes, the tracer concentrations in the boundary and the bulk lattice [denoted as cGB(x, t) and cL(x, y, t), respectively, where t is the time, and coordinates x and y are shown in Fig. 10.2a] can be obtained by solving the following equations:

Figure 10.2 (a) Schematic showing the basic diffusion processes and the tracer atom diffusion profile (indicated by light gray color) developed in the vicinity of a grain boundary due to simultaneous lattice and grain boundary (GB) diffusion. δ is the thickness of the grain boundary. Plot of  versus x6/5 gives a straight tail part for large x values, which is characteristic for grain boundary diffusion, as shown in (b). This straight line can be used for the determination of grain boundary diffusion coefficient (see the text for details).
 (10.6)
and
 (10.7)
The first and the second terms on the right side of Eq. (10.7) correspond to the diffusion along the grain boundary and the leakage from grain boundary to the bulk lattice.
During a diffusion experiment, the penetrated tracer concentration is determined by serial sectioning method. In this procedure, thin layers parallel to the diffusion source film are removed from the sample and the tracer concentrations in these sections are measured. This concentration is an average perpendicular to axis x and denoted as  . Model calculations using Eqs. (10.6) and (10.7) revealed that depends linearly from x6/5. Therefore, plotting versus x6/5 may provide the grain boundary diffusion coefficient. In practice, because of the lattice diffusion at the deposited source layer, this evaluation procedure works only for large x values where grain boundary diffusion dominates, as shown in Fig. 10.2b. Thus, the grain boundary diffusion coefficient can be determined from the absolute value of the slope of the straight line fitted to the right tail part of versus x6/5 plot (m) as (Whipple–Le Claire equation):
 (10.8)
where t is the time of experiment and A is a constant depending on the type of tracer source. For constant and instantaneous source types the value of A are 1.322 and 1.308, respectively [2]. The first condition means that the tracer concentration is constant at the surface (x = 0), irrespective of time. The second source type is also referred to as thin layer condition for which all tracer atoms are in the deposited layer at t = 0, and during the diffusion experiment, they are completely consumed by the specimen. For the constant source condition, Eq. (10.8) applies only if (1) the lattice diffusion length  is at least 10 times larger than the half thickness of the boundary (δ/2) and (2) the grain boundary diffusion coefficient is at least 100 times larger than the lattice diffusion coefficient. For the instantaneous source, Eq. (10.8) is strictly valid only if the ratio of the grain boundary and lattice diffusion coefficients is at least 105. For the determination of DGB from Eq. (10.8), the lattice diffusion coefficient and the grain boundary thickness must be known from independent experiments. In general, δ = 0.5 nm is a reasonable approximation for the grain boundary thickness [2]. The measurement of DGB at different temperatures yields the grain boundary diffusion activation energy (QGB) in accordance with Eq. (10.4). The values of QGB are 40%–50% of the lattice self-diffusion activation energies. It is noted that for impurity diffusion in the equations and conditions presented above, δ must be substituted by sδ where s is the equilibrium impurity segregation factor. This factor describes the segregation of impurities at the grain boundaries, and it can be obtained from the following coupling condition at the periphery of the grain boundary (at y = ±δ/2): cGB(x, t) = s × cL(x, ±δ/2,t). The value of s is one for grain boundary self-diffusion. In practice, δDGB or sδDGB is determined from Eq. (10.8), and DGB can be obtained only if s and δ are known from other experiments.
The kinetics of the combined lattice and grain boundary diffusion are usually classified into three groups [2–4,6]. Fig. 10.3 shows the three basic tracer spatial distribution types A, B, and C that evolve due to the different contributions of bulk and grain boundary diffusion (Harrison's classification). The diffusion measurements can be performed in different regimes (A, B, or C) by an appropriate selection of experimental conditions, such as temperature and measuring time. For type A diffusion kinetics, the bulk diffusion regions around the neighboring grain boundaries strongly overlap and the faster diffusion along the grain boundaries is not reflected in the concentration profile. This diffusion type develops when the lattice diffusion length is much larger than the spacing between the grain boundaries (d). The above condition is fulfilled when the temperature is high, the duration of experiment is long, and/or the grain size is small. For type B diffusion kinetics, although there are simultaneous grain boundary and lattice diffusion processes, the lattice diffusion regions at the neighboring grain boundaries do not overlap (see Fig. 10.3). This diffusion type occurs if the lattice diffusion length  is much smaller than the boundary spacing but larger than the grain boundary thickness (or sδ for impurity diffusion). In the diffusion regime, referred to as type C, the bulk lattice diffusion is negligible compared to grain boundary diffusion, therefore diffusion takes place only along the grain boundaries without any considerable leakage to the bulk lattice. This condition is fulfilled if the lattice diffusion length is much smaller than the grain boundary thickness (at least by a factor of 10), which can be achieved in low temperature and short time experiments. As a consequence, Eq. (10.8) cannot be applied in the evaluation of diffusion profile in regime C. Instead, the classical Gaussian or error function must be used for the characterization of the diffusion profile for the instantaneous or constant source, respectively. In this case, is plotted as a function of x2 that yields directly the value of DGB. Table 10.1 summarizes the three grain boundary diffusion types and the conditions required for their occurrence.

Figure 10.3 Schematic of the three basic tracer spatial distribution types: A, B, and C. The tracer atoms diffuse from the surface layer at the right side. The volumes containing larger amount of tracer atoms than a given concentration are indicated by gray color (tracer profile) [6].
If grain boundary diffusion experiments are performed in regime type B, only the product δDGB or sδDGB can be obtained from the profile evaluation for self-diffusion or impurity diffusion, respectively. Although, δ = 0.5 nm is a reasonable approximation for the grain boundary thickness, the value of s is usually difficult to determine. In addition, s varies with temperature following an Arrhenius law; therefore the apparent grain boundary diffusion activation energy obtained from the profile evaluation is the sum of the real grain boundary diffusion activation energy and the impurity segregation energy [2]. For instance, if we consider Te diffusion in Ag, the values of grain boundary diffusion activation and impurity segregation energies are comparable (87 and −43 kJ/mol, respectively), due to the very high level of Te segregation at Ag grain boundaries (s = 103–105 owing to the low solubility limit of Te in Ag). At the same time, for Au impurity diffusion in Cu the value of s is only about 10 due to the high solubility of Au in Cu grains. Therefore, the impurity segregation energy is small (only about −10 kJ/mol) compared to the grain boundary diffusion activation energy (∼81 kJ/mol). It is also worth to note that grain boundary diffusion of impurities is often hindered by their favored positions in the grain boundary structure. The higher the segregation tendency, the stronger the binding of impurities to the favored grain boundary sites, which reduces the diffusion rate. At the same time, there may be an opposite trend, namely the binding between impurities and vacancies, which can accelerate diffusion in both the bulk lattice and the grain boundaries. It should also be noted that the grain boundary self-diffusion is influenced by the impurities (or alloying elements) segregated to the grain boundaries. This effect depends on the type of alloying element: for instance 0.2 at.% silver in Cu has only a negligible influence on grain boundary self-diffusion while already 1 ppm of sulfur changes the grain boundary diffusion of Cu [7,8]. It is noted that when a grain boundary moves parallel to the surface layer (e.g., due to grain growth at elevated temperatures), the tracer penetration profiles before and after the moving boundary differ from each other, as shown in Fig. 10.4a. It should also be noted that although the calculation of Eq. (10.8) is based on a bicrystal-like simple model presented in Fig. 10.2a; it is also valid for randomly oriented grain boundary structures [9], therefore it gives a basis of the quantitative evaluation of grain boundary diffusion in polycrystalline materials [3]. The Fisher's model was improved by involving secondary short-circuit diffusion paths (e.g., dislocations, subgrain, and interface boundaries) in grain interiors [10]. In the extended model, these diffusion paths are connected to grain boundaries, thereby resulting in a faster leakage of tracer atoms from grain boundaries to grain interiors, as shown in Fig. 10.4a. The dislocation pipe diffusion dominated grain boundary diffusion regime is often denoted as type D kinetics. According to new leakage paths, additional terms are given to Eqs. (10.6) and (10.7), as well as an extra equation for diffusion along dislocations is introduced. If dislocations are the main reason of leakage from grain boundaries, Eq. (10.8) remains valid for the slope of the straight line fitted to versus x6/5 data, only DL must be substituted by g2Dd or gDd for short and long diffusion times, respectively, where DL is the diffusivity for dislocations and g is the volume fraction of dislocation pipes in the material [10].
Table 10.1
The grain boundary diffusion kinetics types, the related experimental conditions, and the evaluated function of concentration ![]() versus penetration depth (x)
versus penetration depth (x)
| Diffusion type | Condition | Evaluated function | Obtained parameter |
| A | fDGB + (1−f)DL | ||
| B | sδDGB | ||
| C | DGB |


Figure 10.4 (a) Schematic of the tracer penetration profiles before and after a boundary moving parallel to the surface layer. (b) The improved Fisher's model with secondary short-circuit diffusion paths (dislocations, subgrain, and interface boundaries). This diffusion regime is also referred to as type D kinetics.
Grain boundary diffusion is sensitive to the grain boundary misorientation since the different misorientations are usually related to different grain boundary structures. The misorientation dependence of grain boundary diffusion is usually studied in bicrystals. It was revealed that Bi diffusivity in Cu bicrystals strongly correlates to the energy of grain boundary [11]. These studies were carried out on [001] and [011] twist and symmetric tilt boundaries. The higher the degree of disorder (or free volume) in the atomic arrangement of the boundary, the larger the grain boundary energy and the faster the diffusion along the grain boundary. For low-angle grain boundaries (LAGBs) in Ag with misorientations smaller than 15 degrees and tilt axis [001], the diffusivity increases monotonously with increasing misorientation [12]. At the same time, for high-angle grain boundaries (HAGBs) the diffusivity shows a minima at misorientations with low Σ values since these boundaries have highly ordered and low energy structures. Σ is used for the characterization of coincidence site lattice (CSL) boundaries and its value is equivalent to the inverse density of coincidence sites in the grain boundary. The diffusivity is very sensitive to misorientation of HAGBs. For instance, the diffusivity along Σ5 boundary with misorientation of 36.9 degrees is smaller by a factor of 3 and 5 at 780 and 661 K, respectively, than for a boundary with 1 degree smaller or higher misorientation [13]. Fig. 10.5 shows schematically the variation of the logarithm of grain boundary diffusion coefficient in Cu as a function of misorientation for [001] symmetric tilt boundaries. It is noted that the minimum diffusivity was measured at about 0.4 degree smaller angle than the ideal misorientation for Σ5 CSL boundary (see the inset in Fig. 10.5). This deviation was caused by an accidental and unintentional formation of a dislocation network at Σ5 CSL boundary that accelerated the diffusion. At the misorientation angle related to the minimum diffusivity, the diffusion activation energy is 30%–40% higher while the prefactor (DGB0) is one order of magnitude larger than the values obtained a few degrees away from this angle. The first effect overwhelms the second one, resulting in a slower diffusion in the very close vicinity of CSL misorientation [13].
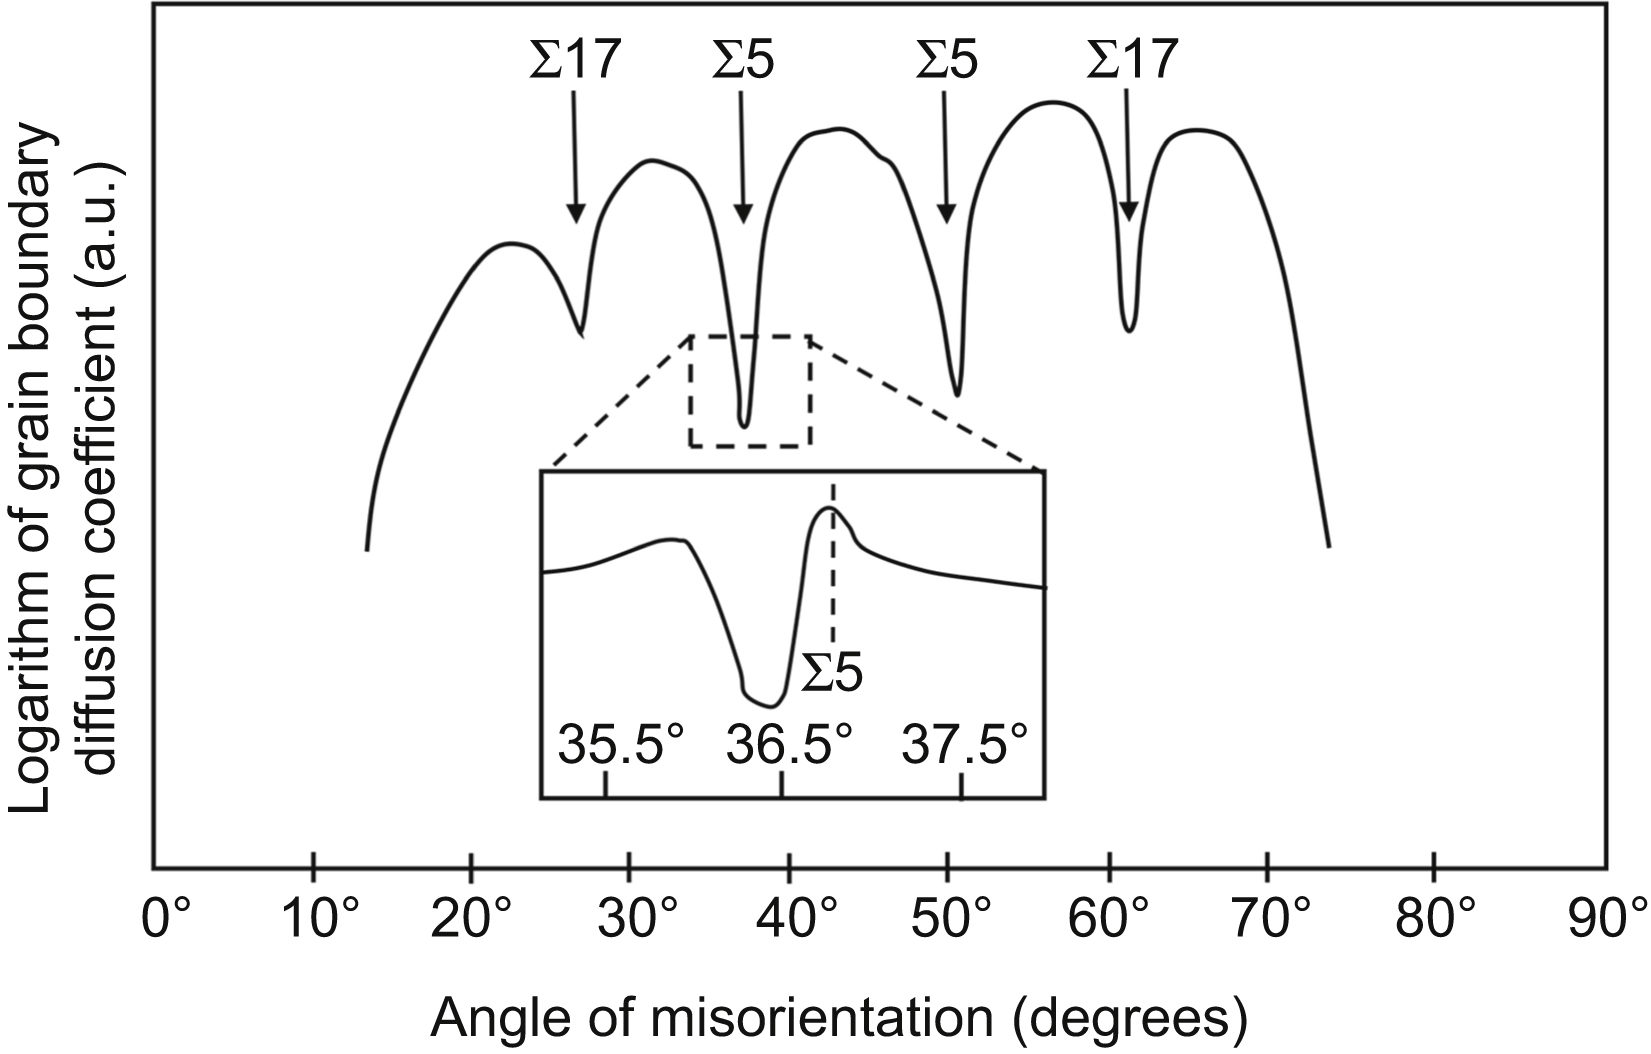
Figure 10.5 Schematic showing the variation of the logarithm of grain boundary diffusion coefficient in Cu as a function of misorientation angle for [001] symmetric tilt boundaries. The plot was constructed according to the data presented in [11] and [13]. The dashed line in the inset shows the ideal misorientation angle for Σ5 coincidence site lattice boundary.
Similar misorientation dependence was observed for both impurity and self-diffusion along symmetrical tilt boundaries in Ag [14] and Cu [15]. One order of magnitude difference was observed between the largest and smallest grain boundary self-diffusion coefficients measured for [001] symmetric tilt boundaries with different misorientations in Ag at 771 K [14]. Atomistic simulations revealed that the grain boundary self-diffusion activation energy in Cu decreases with increasing energy of HAGBs with Σ values between 5 and 13 [15]. This trend is shown schematically in Fig. 10.6. It can be seen that the diffusion activation energy for a general grain boundary with the energy of 0.6 J/m2 is about half of the value determined for vacancy diffusion in the bulk lattice. This result of the atomistic simulations is in a reasonable agreement with the experiments (see aforementioned). Large differences between the diffusivities were also found for twist boundaries. For instance, the diffusion of Bi along [011] twist boundaries in Cu is faster than in [001] twist boundaries [11]. It is emphasized that the diffusivity is more sensitive to the boundary structure than the boundary energy. For instance, 20% smaller boundary energy yields similar change in the activation energy due to the linear relationship between them (see Fig. 10.6). However, this variation in the activation energy leads to a three orders of magnitude larger diffusion coefficient owing to the exponential function in the Arrhenius formula of diffusivity. The effect of grain boundary misorientation on diffusivity can be monitored not only in bicrystals, but also in polycrystalline materials. For instance, in Al–3.3% Mg–0.1% Sc alloy the grain boundary character was tailored by an appropriate selection of SPD route [16]. Processing by equal channel angular pressing (ECAP) via route C for two passes and a subsequent diffusion annealing at 523 K for 5 days resulted in an HAGB fraction of 21%. At the same time, eight ECAP passes through route BC and a subsequent diffusion annealing at 523 K for 20 days yielded an HAGB fraction of 60%. The diffusion coefficient of Mg in Al was higher for the sample containing higher fraction of HAGBs, in accordance with Fig. 10.5. Similar trend was observed for Zn diffusion in Al–2.1% Zn–0.1% Sc alloy, which was also processed by two different routes of ECAP and subsequent annealing. In these materials, SPD-processing yielded ultrafine-grained (UFG) microstructure with the grain size of 200–400 nm, and this was coarsened to 1–2 μm during subsequent annealing [16]. It was found that the one order of magnitude difference between the grain boundary diffusion coefficients of the Al–3.3% Mg–0.1% Sc samples processed by the two different routes was caused by the larger preexponential factor (DGB0) for the material with higher fraction of HAGBs. At the same time, the activation energies of the two specimens were practically the same.

Figure 10.6 Dependence of self-diffusion activation energy on high-angle grain boundary energy for symmetric tilt grain boundaries in Cu [15]. The error bar at the straight line reflects the difference between the data measured parallel and perpendicular to the tilt axis.
In addition to the misorientation dependence of grain boundary diffusivity, there is also an anisotropy of diffusion in grain boundaries [11,15,17]. In general, for tilt boundaries the grain boundary diffusivity parallel to the tilt axis is much larger than perpendicular to this axis. For instance, in Ag for symmetrical tilt boundaries with tilt axis [001] and misorientation angle of 15 degrees the diffusion at 723 K parallel to the tilt axis is faster by a factor of 15 than perpendicular to the tilt axis [17]. This ratio decreases to two when the misorientation angle increases to 45 degrees. Low-angle tilt boundaries with misorientations smaller than 15 degrees usually consist of dislocations lying parallel to the tilt axis, which explains well the higher diffusivity parallel to this axis. The similar diffusion anisotropy for HAGBs (the misorientation is larger than 15 degrees) suggests an ordered anisotropic structure instead of an amorphous-like atomic arrangement in these boundaries. It should be noted that atomistic simulation methods revealed that the dominance of vacancy or interstitial diffusion varies for the different Σ boundaries in Cu [15]. In addition, for some Σ boundaries the diffusion may be faster perpendicular to the tilt axis than parallel to that. Finally, it should be noted that diffusivity for triple junctions is orders of magnitude larger than that for grain boundaries, as it was shown for Zn diffusion in Al [18].
Impurity concentration at grain boundaries also influences diffusion along interfaces. A detailed investigation of grain boundary self-diffusion revealed that the purer the matrix, the faster the interface diffusion due to the lower activation energy [19]. The largest variation of diffusivity was observed between 99.999 and 99.99 wt.% purity Ni, while further increment of impurity level to 99.6 wt.% did not yield significant change in grain boundary diffusion coefficient. Impurity segregation at grain boundaries decreases the free volume and the energy of interfaces, thereby lowering diffusivity [20]. Therefore, grain refinement to UFG or nanosized regime increases the diffusivity not only due to the increase of amount of grain boundaries but also the purification of grain boundaries (as the same impurity content is distributed on a larger grain boundary area).
10.2. Diffusion in Ultrafine-Grained and Nanocrystalline Materials Processed by Severe Plastic Deformation
Processing of UFG and nanocrystalline metals and alloys by SPD techniques yields a development of dislocation walls and LAGBs inside the initial grains. With increasing straining, these boundaries evolve into HAGBs, thereby refining the microstructure into UFG or nanocrystalline regime. When a minimum grain size is achieved, the HAGBs exhibit high energy and large free volume which result in high diffusivity along these boundaries (referred to as nonequilibrium HAGBs) [21]. The large free volume in nonequilibrium HAGBs is associated with the high density of extrinsic dislocations in the close vicinity of these boundaries [22]. These extrinsic dislocations are accumulated at HAGBs during SPD-processing. In contrast to geometrically necessary dislocations at grain boundaries, extrinsic dislocations are not needed for the accommodation of lattice misorientations between the neighboring grains. If SPD-processing continues even after achieving the saturation grain size, the HAGBs tend to transform into a more equilibrated state owing to the annihilation of a significant portion of extrinsic dislocations. This grain boundary relaxation can also be achieved by annealing. The relaxed HAGBs exhibit much slower diffusivity than the nonequilibrium boundaries. The grain boundary diffusion coefficients for Ni along nonequilibrium and relaxed boundaries in 99.98 wt.% purity UFG Cu and Cu–0.17 wt.% Zr alloy were determined immediately after ECAP-processing [21,23]. It is noted that these measurements were carried out in C-type regime of grain boundary diffusion (see Table 10.1 and Fig. 10.3) by an appropriate selection of the time and temperature of diffusion. In the data evaluation, is plotted as a function of x2, and the slope of the straight line fitted to the datum points provides the grain boundary diffusion coefficient. If both “fast” diffusion along nonequilibrium HAGBs and “slow” diffusion along relaxed HAGBs occur, the versus x2 curve may have two distinct linear segments due to the bimodality of grain boundary diffusivity distribution, as shown in Fig. 10.7. The first segment at lower penetration depth and with higher slope corresponds to the slow diffusion path (along relaxed HAGBs), while the second segment at higher penetration depth and with lower slope is related to fast short-circuit diffusion along nonequilibrium boundaries [23]. It should be noted, however, that the two distinct segments can be observed only if the average diffusion distance along slow paths is smaller than the spacing between the fast diffusion boundaries. Otherwise, A-type diffusion kinetics (see Fig. 10.3) can be observed with a single effective diffusion coefficient, and versus x2 plot exhibits a single slope accordingly. The different kinetics observable for materials with bimodal grain boundary diffusivity is summarized in [24].
For determination of diffusion coefficient, the measurements are usually carried out at different temperatures, including elevated temperatures. Therefore, the standard evaluation procedures work only if the UFG or nanocrystalline microstructure is stable during high-temperature diffusion experiments. This stability can be achieved by fine secondary phase precipitates distributed at the grain boundaries. For instance, in Cu–0.17 wt.% Zr alloy processed by 4 passes of ECAP at room temperature (RT), the UFG microstructure with the grain size of 300 nm remained stable even at 623 K due to Cu5Zr particles at the grain boundaries [23]. This stable microstructure can be modeled by a skeleton of nonequilibrium grain boundaries showing fast diffusion which is embedded in a network of relaxed grain boundaries exhibiting slow diffusion. This hierarchical microstructure is shown schematically in Fig. 10.8. The domain size in the relaxed grain boundary network is equivalent to the grain size (300 nm) while the characteristic cell size in the nonequilibrium grain boundary skeleton is in the micrometer range for ECAP-processed Cu–0.17 wt.% Zr alloy [23]. During grain boundary diffusion in this hierarchical microstructure, there is a leakage from the fast boundaries into the slow paths (indicated by black arrows in Fig. 10.8), in analogy with the model depicted in Fig. 10.2a. In the model shown in Fig. 10.8 the slow diffusion occurs by a direct migration of tracer atoms from the surface layer to nonequilibrium grain boundaries, therefore the slow diffusivity can be determined from the slope of the first, steep part of the penetration profile (see Fig. 10.7) using Eq. (10.8). At the same time, the diffusion coefficient for fast diffusion (DGBf) can be obtained from the slope of the second, less steeper part of the penetration curve (mII) and the slow diffusivity (DGBs) using the following formula [10]:

Figure 10.7 Schematic of diffusion profile obtained in ultrafine-grained materials in which both slow and fast grain boundary diffusion occur. is the average tracer concentration determined by serial sectioning method while x is the tracer penetration depth. HAGB, high-angle grain boundary.
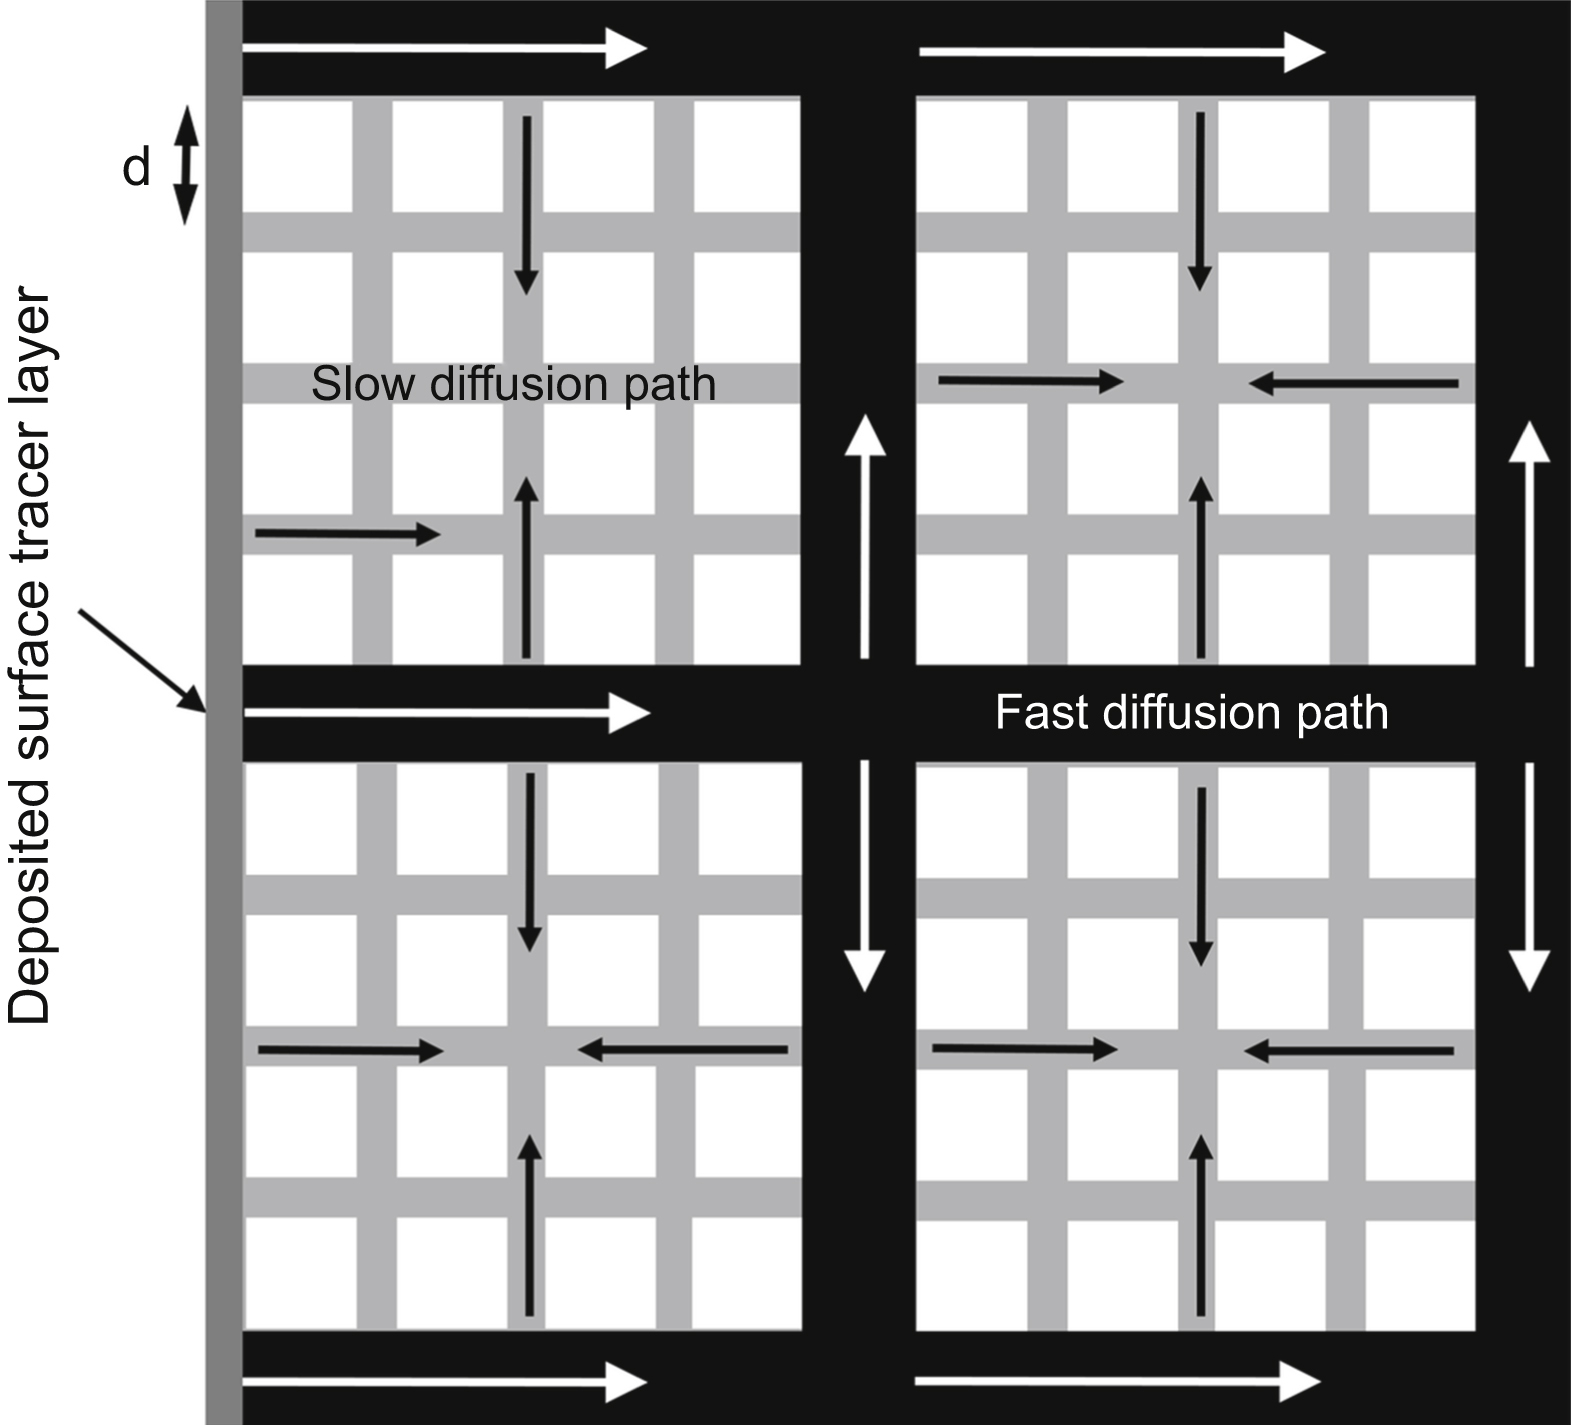
Figure 10.8 Model of the hierarchical microstructure with nonequilibrium and relaxed grain boundaries, acting as fast and slow diffusion paths, respectively [23].
 (10.9)
where d is the spacing between the nonequilibrium grain boundaries lying perpendicular to the surface tracer layer (see Fig. 10.8).
The frequency factor and the activation energy values for “fast” and “slow” Ni diffusion along nonequilibrium and relaxed HAGBs in Cu–0.17 wt.% Zr alloy, respectively, are listed in Table 10.2. The diffusivity in the nonequilibrium boundaries is about two orders of magnitude larger than for relaxed HAGBs at RT, which is caused by the much higher value of frequency (or preexponential) factor (DGB0) for the former boundaries, as illustrated in Fig. 10.9. This figure also shows that the diffusivity for Ni migration along relaxed boundaries in the UFG Cu–0.17 wt.% Zr alloy is similar to the grain boundary diffusion coefficient measured for Ni in coarse-grained 5N8 purity polycrystalline Cu for all temperatures [23]. Therefore, it can be concluded that grain size is not a deterministic factor in grain boundary diffusivity. It is noted that in this material Zr alloying atoms are in Cu5Zr precipitates, therefore their segregation at grain boundaries do not influence the diffusivity along HAGBs. It should also be noted that the term “slow HAGB diffusion” serves only to make a distinction between the different rates of grain boundary diffusion along various paths in UFG and nanocrystalline materials. In absolute terms it refers to a quick diffusion similar to the migration along general grain boundaries in coarse-grained materials. The rate of this “slow diffusion” is much higher than that for special CSL boundaries (see Section 10.1). In UFG Cu–0.17 wt.% Zr alloy the majority of grain boundaries exhibit diffusivity close to that of HAGBs in high-purity coarse-grained copper, while the minority of the grain boundaries (nonequilibrium HAGBs) have much higher diffusion coefficient. The area fraction of fast diffusion boundaries is only 0.2%–0.5% in UFG Cu–0.17 wt.% Zr alloy processed by ECAP at RT, therefore their contribution to the total diffusion flux is marginal. Consequently, it can be concluded that the grain boundary diffusion in SPD-processed UFG materials is very similar to the diffusion along general (not specific CSL) boundaries in coarse-grained counterparts. It is noted that for bulk lattice diffusion of Ni in Cu, the frequency factor (D0 = 7 × 10⁻⁵ m2/s) is 2-3 orders of magnitude larger than for slow diffusion along relaxed grain boundaries [23]. The activation energy for bulk lattice diffusion (225 kJ/mol) is also higher by a factor of about 2.6 than for slow grain boundary diffusion. The latter effect overwhelms the former one, thereby resulting in a 21 orders of magnitude larger diffusion coefficient for slow grain boundary diffusion, compared to bulk lattice diffusion at RT. As in a nanocrystalline sample interfaces occupy a large fraction of the material, grain boundaries determine the diffusivity of the whole sample. Therefore, the diffusion coefficient of nanostructured materials is usually very close to the grain boundary diffusivity. In bulk nanomaterials compacted from nanopowders, usually there is some remaining porosity. The diffusion on the pore surfaces is as fast as the diffusion on the free surfaces. Therefore, the diffusivity for porous nanomaterials may be much larger than that for grain boundaries.
Table 10.2
The frequency factor (D0), the activation energy (Q) of diffusion for different UFG and nanocrystalline materials
| Host material/diffusion path | Diffusant | Processing | Grain size (nm) | Frequency factor (m2/s) | Activation energy (kJ/mol) | References |
| 99.98 wt.% Cu/slow GB | Ni | 4 ECAP at RT | 300 | 1.6 × 10⁻⁷ (2.3 × 10⁻³) | 85 (0.38) | [21] |
| Cu–0.17 wt.% Zr/slow GB | Ni | 4 ECAP at RT | 300 | 1.4 × 10⁻⁷ (2.0 × 10⁻³) | 84 (0.37) | [23] |
| Cu–0.17 wt.% Zr/fast GB | Ni | 4 ECAP at RT | 300 | 1.6 × 10⁻³ (22.9) | 96 (0.43) | [23] |
| 99.6 wt.% purity Ni/fast GB | Ni | 4 ECAP at RT | 300 | 1.2 × 10⁻⁸ (1.3 × 10⁻⁴) | 67 (0.24) | [28] |
| Ni/GB | Cu | ECAP at RT + annealing at 398 K for 1 h | 300 | - | 43 (0.17) | [26] |
| Ni/GB | Ni | Compaction of powder at 773 K and 4.4 GPa | 70 | 2.2 × 10⁻¹² (2.4 × 10⁻⁸) | 46 (0.17) | [35] |
| γ-Fe−40 wt.% Ni/slow GB | Fe | Compaction of powder at 1123 K and 1.25 GPa | 80–100 (XRD) | 4.2 × 10⁻³ (4.8) | 187 (0.62) | [36] |
| γ-Fe–40 wt.% Ni/fast GB | Fe | Compaction of powder at 1123 K and 1.25 GPa | 80–100 (XRD) | 3.4 × 10⁻³ (3.9) | 148 (0.49) | [36] |
| γ-Fe–40 wt.% Ni/slow GB | Ni | Compaction of powder at 1123 K and 1.25 GPa | 80–100 (XRD) | 9.3 × 10⁻⁴ (1.2) | 177 (0.58) | [37] |
| γ-Fe–40 wt.% Ni/fast GB | Ni | Compaction of powder at 1123 K and 1.25 GPa | 80–100 (XRD) | 1.8 × 10⁻³ (2.3) | 134 (0.44) | [37] |
| γ-Fe–40 wt.% Ni/slow GB | Ag | Compaction of powder at 1123 K and 1.25 GPa | 80–100 (XRD) | 4.7 × 10⁻⁴ (0.39) | 173 (0.62) | [38] |
| γ-Fe–40 wt.% Ni/fast GB | Ag | Compaction of powder at 1123 K and 1.25 GPa | 80–100 (XRD) | 8.1 × 10⁻⁵ (0.07) | 91 (0.33) | [38] |
| Fe90Zr7B3/slow GB | Fe | Melt spinning + crystallization at 873 K | 18 (XRD) | 2.8 × 10⁻⁷ (1.4 × 10⁻³) | 163 (0.65) | [39] |
| Table Continued | ||||||

| Host material/diffusion path | Diffusant | Processing | Grain size (nm) | Frequency factor (m2/s) | Activation energy (kJ/mol) | References |
| Fe90Zr7B3/fast GB | Fe | Melt spinning + crystallization at 873 K | 18 (XRD) | 6.8 × 10⁻⁵ (0.34) | 157 (0.62) | [39] |
| Fe–14Cr–3W–0.4Ti–0.25Y2O3 in wt.%/slow GB | Fe | Mechanical alloying + hot extrusion | 200 | - | 140 (0.46) | [40] |
| Fe–14Cr–3W–0.4Ti–0.25Y2O3 in wt.%/fast GB | Fe | Mechanical alloying + hot extrusion | 200 | - | 76 (0.25) | [40] |
| Al91.9Ti7.8Fe0.3/GB | Cu | Mechanical alloying + hot compaction at 673 K | 22 (XRD) | 2.4 × 10⁻¹² (3.7 × 10⁻⁸) | 35 (0.26) | [41] |
| UO2/GB | U | Molecular dynamic simulation | 10 | 1.7 × 10⁻¹⁰ (5.7 × 10⁻⁵) | 48 (0.17) | [42] |
| UO2/GB | O | Molecular dynamic simulation | 10 | 5.4 × 10⁻⁸ (4.3 × 10⁻⁴) | 71 (0.29) | [42] |
| UO2/GB | Xe | Molecular dynamic simulation | 10 | 1.4 × 10⁻⁹ (6.7 × 10⁻⁴) | 48 (0.17) | [42] |
| W-1 at.% H/L | H | Molecular dynamic simulation | 10 | 1.1 × 10⁻⁷ (2.2) | 74 (3.9) | [43] |
| 99.9% purity Pd | H | Cold rolling + 10 HPT at RT under 1.5 GPa | 350 | 1.0 × 10⁻⁸ (0.04) | 15 (0.68) | [44] |
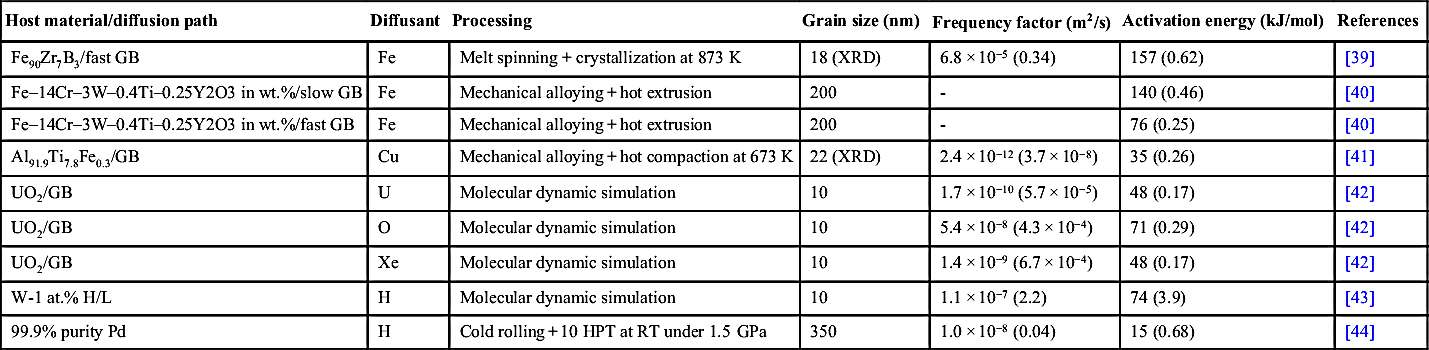

Figure 10.9 Schematic illustrating the difference between the diffusivities of Ni for slow and fast grain boundaries in Cu–0.17 wt.% Zr alloy processed by equal channel angular pressing at room temperature. The diffusivity of grain boundaries in coarse-grained pure Cu is also shown [23].
Short time annealing of SPD-processed UFG and nanocrystalline materials at moderate temperatures may yield the relaxation of nonequilibrium boundaries without grain growth [25]. For instance, the grain boundary diffusivity of Cu measured at 423 K in ECAP-processed UFG Ni decreased by three orders of magnitude from 9.6 × 10⁻¹⁵ m2/s to 2.8 × 10⁻¹⁸ m2/s during annealing at 523 K for 1 h after ECAP-processing [26]. This reduction of the grain boundary diffusion coefficient was not accompanied by grain coarsening (the grain size remained 300 nm), therefore it was attributed to grain boundary relaxation. The grain boundary diffusivity of Cu for relaxed grain boundaries in UFG Ni was still one order of magnitude higher than that for coarse-grained Ni (4.3 × 10⁻¹⁹ m2/s at 423 K). This difference can be explained by an incomplete relaxation at 523 K for 1 h and/or the high diffusivity of triple junctions. The amount of triple junctions in UFG samples is higher than in coarse-grained counterparts, which may yield higher diffusivity in the former materials. The grain boundary diffusivity of Cu in electrodeposited Ni with the grain size of 30 nm was found to be 3.8 × 10⁻¹⁷ m2/s at 523 K [26]. This value is about two orders of magnitude smaller than the diffusivity measured for ECAP-processed UFG Ni, indicating the high degree of relaxation for grain boundaries in electrodeposited Ni. At the same time, the grain boundary diffusion coefficient for electrodeposited Ni is two orders of magnitude larger than those coarse-grained counterparts, which can be attributed again to the effect of triple junctions [26]. It is noted that in SPD-processed UFG materials pores may form at triple junctions and grain boundaries from the excess vacancies. When these pores are percolated, a very high diffusivity component can be detected [27–29]. The diffusivity of percolating pores is similar to that measured on the free surface [30]. However, as the volume fraction of these pores is very small (e.g., around 10−6 for ECAP-processed Cu with the grain size of ∼300 nm [27]), their influence on the total diffusivity is very small. The chains of interconnected cavities exhibit high stability during annealing after SPD [31]. The back pressure during ECAP retards the formation of percolating pores.
The diffusion in SPD-processed UFG and nanocrystalline materials can be accelerated by the excess vacancies formed during plastic straining. For RT SPD-processing, this excess vacancy concentration may reach ∼10−4, which is about 17 orders of magnitude larger than the equilibrium value [32–34]. In SPD-processed materials, besides the very large amount of grain boundaries and dislocations that act as fast diffusion paths, the high vacancy concentration also contributes to the large diffusivity according to Eq. (10.1). It should be noted, however, that during SPD-processing the accelerating effect of excess vacancies on diffusion is reduced by the retarding effect of the applied high pressure on vacancy migration. Especially in the course of HPT processing, the pressure may reach ∼10 GPa, which increases the vacancy migration enthalpy (HVM = EVM + pVVM) by about 0.5 eV. This 50% increment in HVM yields nine orders of magnitude smaller exponential factor in Eq. (10.1). Combining the effects of the larger vacancy concentration and the more difficult migration, the diffusion coefficient is still eight orders of magnitude larger during SPD-processing of UFG materials than in coarse-grained counterparts.
10.3. Diffusion in Nanomaterials Processed by Bottom-Up Methods
In nanostructured materials processed by crystallization of amorphous alloys, the grain boundary diffusivity often exhibits similar bimodality as for SPD-processed UFG metallic materials [25]. Some boundaries resemble classical polycrystalline interfaces while others behave as amorphous layers between crystalline nanograins. This heterogeneous grain boundary structure is illustrated in Fig. 10.10a. The diffusivity of the “amorphous” boundaries is similar to that observed in bulk amorphous materials, which is lower than the grain boundary diffusion coefficient in crystalline counterparts. Therefore, in crystallized nanomaterials the crystalline and amorphous interfaces correspond to fast and slow diffusion paths, respectively. As an example, the preexponential factors and the activation energies of Fe diffusion along slow and fast diffusion pathways in nanocrystalline Fe90Zr7B3 alloy (crystallite size is 18 nm) processed by crystallization of melt spun amorphous precursor at 873 K are shown in Table 10.2. Although the activation energies for diffusion along amorphous and crystalline boundaries are close to each other, the preexponential factor is about two orders of magnitude smaller for amorphous boundaries [39]. The fraction of amorphous-like boundaries is much larger than that for the conventional crystalline interfaces. Therefore, the diffusivity of nanocrystalline materials obtained by crystallization of amorphous alloys is often smaller than that for nanomaterials that have similar grain sizes but are processed by other methods [39,45,46].
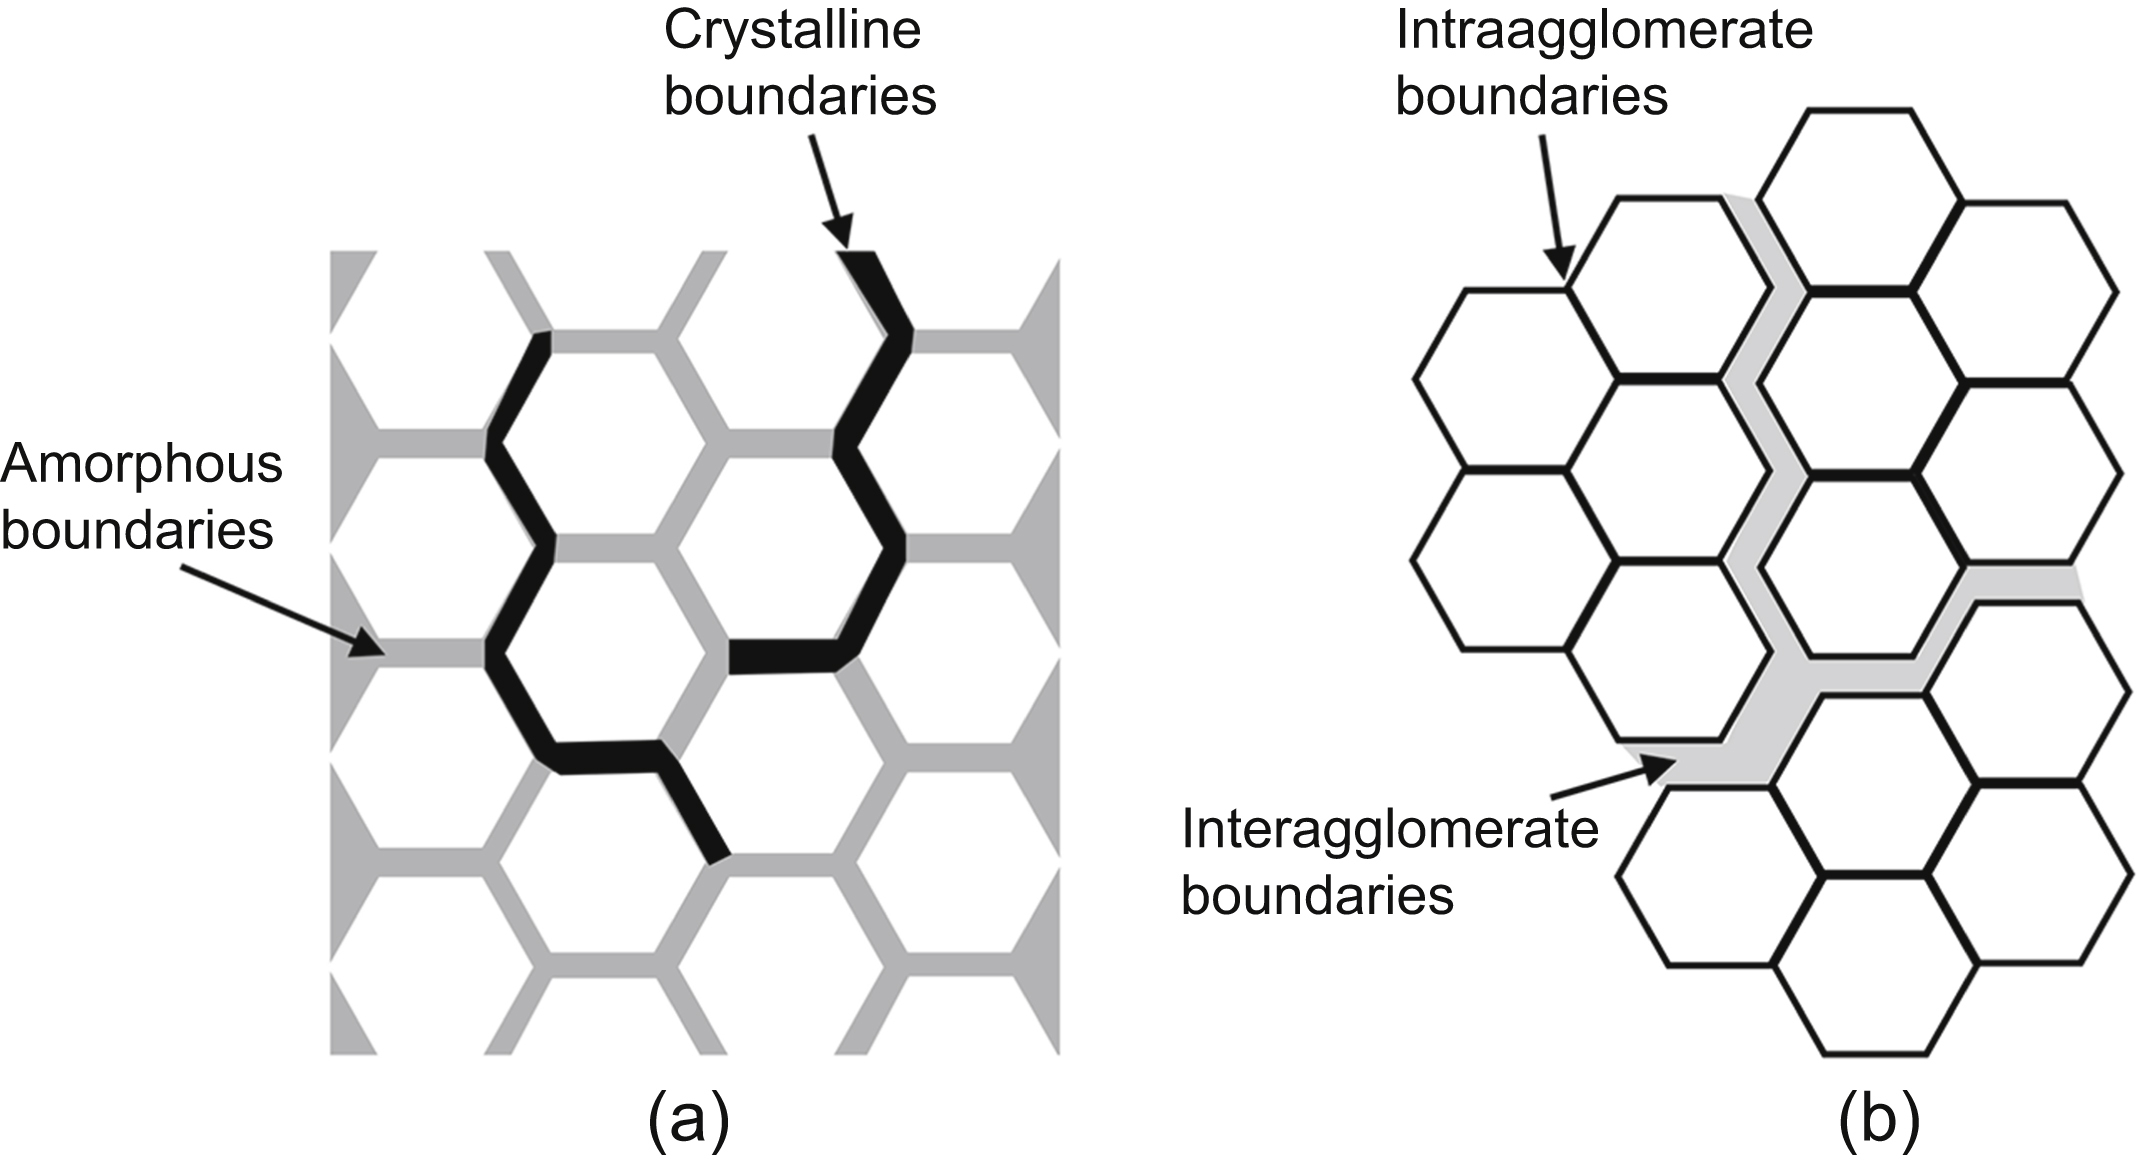
Figure 10.10 Heterogeneous grain boundary structures with slow and fast diffusion pathways in nanomaterials processed by (a) crystallization of amorphous materials or (b) sintering from nanopowders.
In nanomaterials processed by powder metallurgy, the remaining porosity strongly influences the diffusion rate [24,25]. Diffusion on the “particle-pore interfaces” is much faster than along boundaries of coalescenced particles. The initial powders often consist of agglomerates of nanocrystallites, and after sintering the pores are usually formed between these agglomerates. Therefore, the fast and slow grain boundary pathways in sintered nanomaterials are often referred to as interagglomerate and intraagglomerate interfaces, respectively. This heterogeneous interface structure is depicted in Fig. 10.10b. In accordance with the coexistence of the two classes of boundaries, the diffusivity of sintered nanomaterials may show a bimodal nature. This effect was observed, for instance, in nanocrystalline γ-Fe–40 wt.% Ni alloy processed by powder metallurgy [36,47]. The initial powder was obtained by mechanical alloying, which was then compacted under the pressure of 1.25 GPa at 1123 K for 1 h. The sintered material had a relative density of 98%. The preexponential factor and the activation energy of diffusion of different species (Fe, Ni, and Ag) along interagglomerate and intraagglomerate interfaces are listed in Table 10.2. The diffusion coefficient for interagglomerate boundaries is orders of magnitude larger than that for intraagglomerate interfaces, mainly due to the smaller activation energy [36–38]. The relatively slower intraagglomerate boundary diffusivity was found to be very similar to the value determined for conventional grain boundaries in coarse-grained polycrystals. The diffusivities of interfaces in nanomaterials processed by different techniques are summarized schematically and compared to conventional lattice, boundary, and surface diffusion coefficients in Fig. 10.11.
Overviewing the grain boundary diffusion activation energy data listed in Table 10.2 for different materials and diffusants, it can be concluded that their values relative to the bulk diffusion activation energies fall between 0.17 and 0.65. The small activation energy and the large amount of grain boundaries yield fast diffusion in nanomaterials. However, there are some exceptions. For instance, molecular dynamic simulations revealed that hydrogen diffusion in nanocrystalline tungsten is much slower than in coarse-grained counterparts due to the four times higher diffusion activation energy, caused by trapping of H at vacancies in grain boundaries [43]. Trapping at dislocations also retards hydrogen diffusion in severely deformed nanomaterials. The hydrogen diffusivity in nanocrystalline W increases with H content. This can be explained by the larger occupancy of high energy hydrogen sites in grain boundaries with increasing H concentration. The jumping probability of hydrogen atoms occupying these high energy sites is larger, resulting in faster diffusion. This effect depends on the chemical composition of nanomaterials. For instance, in dispersion strengthened Fe–25Ni–15Cr alloy (wt.%) the refinement of grains to the size of 100–200 nm yielded an increase of hydrogen diffusivity [48]. The same effect was observed in UFG Pd [44].

Figure 10.11 Comparison of grain boundary diffusion coefficients for nanomaterials processed by different techniques: severe plastic deformation–processing, sintering from powders, and crystallization of amorphous materials. The diffusivity levels for conventional lattices, grain boundaries, and surfaces are also indicated by dashed horizontal lines. GB, grain boundary.
Grain boundary diffusivity has an effect on the subsurface pore formation in nanocrystalline materials [49]. Excess vacancies may be produced near the surface by interdiffusion between two dissimilar materials (e.g., in multilayers), oxidation or anodic dissolution. These excess vacancies can migrate along grain boundaries into the bulk material, causing cavitation at grain boundaries and triple junctions in the subsurface region. Then, these pores can grow from triple junctions along grain boundaries toward the free surface. The cavities become more narrow and elongated for faster grain boundary diffusion, and they may yield the disintegration of nanomaterials [49].
For nanoparticulate systems with the particles sizes smaller than 20 nm, the reduction of melting point also contributes to the faster diffusion in nanocrystalline materials, since the self-diffusion activation energy is proportional to the melting point [see Eq. (10.5)]. According to thermodynamical calculations, the melting point is a function of the size of spherical particles (d) [50,51]:
![]() (10.10)
(10.10)
where αm depends on the bulk enthalpy of fusion (Hm) and the surface energies in solid and liquid states (denoted by γS and γL, respectively) as:

Figure 10.12 Variation of the logarithm of bulk lattice self-diffusion coefficient normalized by the frequency factor as a function of grain size for Cu at room temperature, if the influence of grain size on melting point is taken into account.
![]() (10.11)
(10.11)
Since γS is usually larger than γL, the melting temperature decreases with decreasing particle size. Therefore, according to Eqs. (10.5) and (10.10), the diffusion activation energy is reduced when the particle size decreases. This reduction is only 5% for the particle size of 10 nm, while for 3 nm the activation energy decreases by 30% [50]. Therefore, this effect is significant only below ∼20 nm. The corresponding variation of the lattice self-diffusion coefficient as a function of grain size for Cu at RT is shown in Fig. 10.12. For copper nanomaterials with grain size of 3 nm, the lattice self-diffusion coefficient is 17 orders of magnitude larger than for coarse-grained counterparts. It should be noted, however, that this calculation is valid only if Eq. (10.5) can be used for such a small grain size. It is also noticed that the thermodynamical conditions applied in the calculation of Eq. (10.10) can only be used for grain sizes larger than 2–3 nm [50].
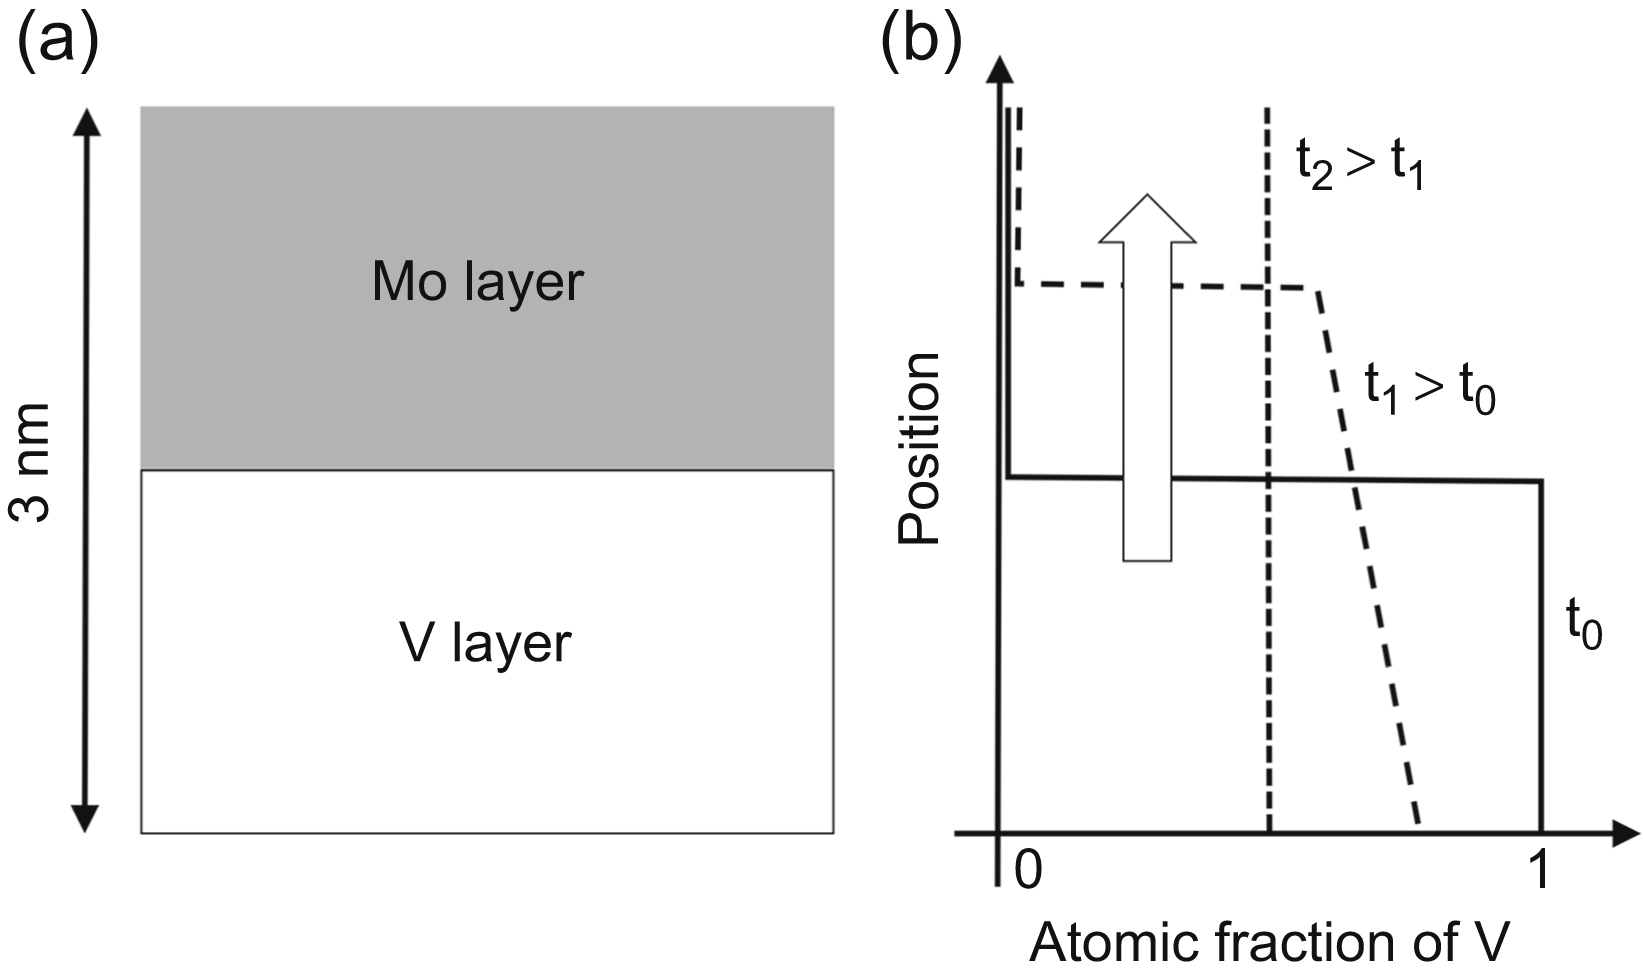
For diffusion distances shorter than about 10 times the atomic spacing (∼3 nm), instead of the continuum model a discrete atomic description of diffusion must be used in the interpretation of experiments [3]. It was shown that if the diffusivity exhibits strong concentration dependence, the validity of continuum approach can be extended even to 50 nm. With the application of discrete models (e.g., the model of Martin [52]) we can explain unique effects observed in nanostructures. It is emphasized that these effects are caused by the very small dimensions of structural units of nanomaterials and not by the large defect densities. As this chapter focuses on the influence of lattice defects on diffusivity, therefore only one example will be shown for the effect of low dimensionality on diffusion in nanomaterials. This special phenomenon can be observed in multilayers consisting of two different materials. If the interdiffusion coefficient shows strong concentration dependence and the layer thickness is a few nanometers, the interface between the two different layers remains atomically sharp during dissolution of one component in the other one. This effect is illustrated for Mo/V multilayer in Fig. 10.13. It can be seen that the dissolution is asymmetric as Mo diffuses into V layer while V is not dissolved in Mo layer [53]. Therefore, the interface moves in the direction of Mo layer until this material is not consumed. There is a step by step character of the dissolution of Mo in V, since only the Mo atomic layer at the interface is dissolved while the other Mo layers remain unchanged. The velocity of the interface is constant that can be explained only by discrete models, as the continuum description predicts that the velocity is proportional to the inverse square root of time. Similar dissolution of Ni in Cu was observed in Cu/Ni(111) multilayers [54].
..................Content has been hidden....................
You can't read the all page of ebook, please click here login for view all page.