
9 Measuring Sources of Brand Equity: Capturing Customer Mind-Set
Learning Objectives
After reading this chapter, you should be able to
-
Describe effective qualitative research techniques for tapping into consumer brand knowledge.
-
Identify effective quantitative research techniques for measuring brand awareness, image, responses, and relationships.
-
Profile and contrast some popular brand equity models.

Marketers strive to learn everything about how consumers use the products they sell. For pillow manufacturers, that might mean knowing how many consumers fold, stack, or just hug their pillows.
Source: Jose Luis Pelaez/Stone/Getty Images
Preview
Understanding the current and desired brand knowledge structures of consumers is vital to effectively building and managing brand equity. Ideally, marketers would be able to construct detailed “mental maps” to understand exactly what exists in consumers’ minds—all their thoughts, feelings, perceptions, images, beliefs, and attitudes toward different brands. These mental blueprints would then provide managers with the insights to develop a solid brand positioning with the right points-of-parity and points-of-difference and the strategic guidance to help them make good brand decisions. Unfortunately, such brand knowledge structures are not easily measured because they reside only in consumers’ minds.
Nevertheless, effective brand management requires us to thoroughly understand the consumer. Often a simple insight into how consumers think of or use products and the particular brands in a category can help create a profitable change in the marketing program. That’s why many large companies conduct exhaustive research studies (or brand audits, as described in Chapter 8) to learn as much as possible about consumers.
A number of detailed, sophisticated research techniques and methods now exist to help marketers better understand consumer knowledge structures. A host of primary and secondary data sources exist online. Many industry or company studies can be accessed and surveys can be efficienty distributed and collected. This chapter highlights some of the important considerations critical to the measurement of brand equity.1 Figure 9-1 outlines general considerations in understanding consumer behavior, and Branding Brief 9-1 describes the lengths to which marketers have gone in the past to learn about consumers.
According to the brand value chain, sources of brand equity arise from the customer mind-set. In general, measuring sources of brand equity requires that the brand manager fully understand how customers shop for and use products and services and, most important, what customers know, think, and feel about and act toward various brands. In particular, measuring sources of customer-based brand equity requires us to measure various aspects of brand awareness and brand image that can lead to the differential customer response making up brand equity.
Consumers may have a holistic view of brands that is difficult to divide into component parts. But many times we can, in fact, isolate perceptions and assess them in greater detail. The remainder of this chapter describes qualitative and quantitative approaches to identifying potential sources of brand equity—that is, capturing the customer mind-set.
Qualitative Research Techniques
There are many different ways to uncover the types of associations linked to the brand and their corresponding strength, favorability, and uniqueness. Qualitative research techniques often identify possible brand associations and sources of brand equity. These are relatively unstructured measurement approaches that permit a range of both questions and answers and so can often be a useful first step in exploring consumer brand and product perceptions.
Who buys our product or service?
Who makes the decision to buy the product?
Who influences the decision to buy the product?
How is the purchase decision made? Who assumes what role?
What does the customer buy? What needs must be satisfied?
Why do customers buy a particular brand?
Where do they go or look to buy the product or service?
When do they buy? Any seasonality factors?
What are customers' attitudes toward our product?
What social factors might influence the purchase decision?
Does the customers' lifestyle influence their decisions?
How is our product perceived by customers?
How do demographic factors influence the purchase decision?
Figure 9-1 Understanding Consumer Behavior
Source: Based on a list from George Belch and Michael Belch, Advertising and Communication Management, 3rd ed. (Homewood, IL: Irwin, 1995).
Qualitative research has a long history in marketing. Ernest Dichter, one of the early pioneers in consumer psychoanalytic research, first applied these research principles in a study for Plymouth automobiles in the 1930s.2 His research revealed the important—but previously overlooked—role that women played in the automobile purchase decision. Based on his consumer analysis, Plymouth adopted a new print ad strategy that highlighted a young couple gazing admiringly at a Plymouth automobile under the headline “Imagine Us in a Car Like That.” Dichter’s subsequent work had an important impact on a number of different ad campaigns.3
Some of his assertions were fairly controversial. For instance, he equated convertibles with youth, freedom, and the secret wish for mistresses; argued that women used Ivory soap to wash away their sins before a date; and maintained that baking was an expression of femininity and pulling a cake or loaf out of an oven for women was “in a sense like giving birth.” His suggested tagline “Putting a Tiger in the Tank” for Exxon resulting in a long-running and successful ad campaign, however.4
This section next reviews a number of qualitative research techniques for identifying sources of brand equity such as brand awareness, brand attitudes, and brand attachment. These techniques also can identify outcomes of brand equity such as price elasticities and brand choice and preference.
Free Association
The simplest and often the most powerful way to profile brand associations is free association tasks, in which subjects are asked what comes to mind when they think of the brand, without any more specific probe or cue than perhaps the associated product category. (“What does the Rolex name mean to you?” or “Tell me what comes to mind when you think of Rolex watches.”)
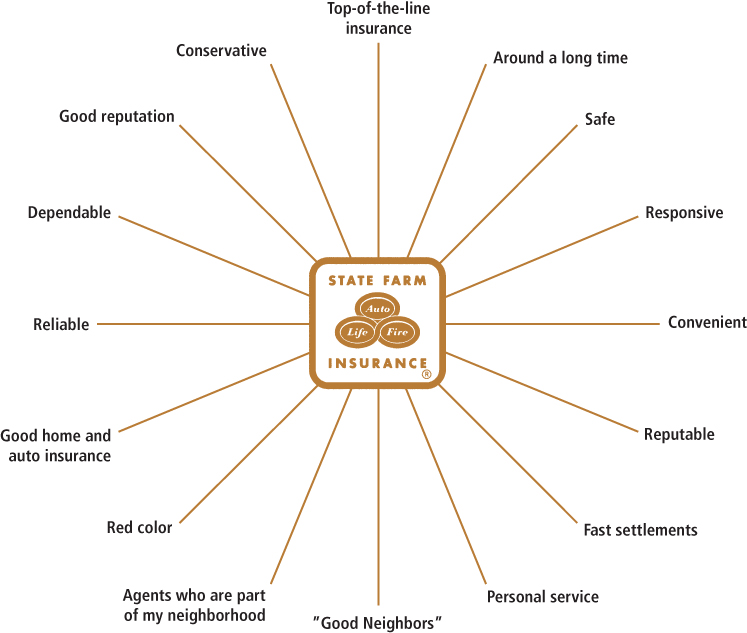
Figure 9-2 Sample State Farm Mental Map
Source: Logo used with permission of State Farm Insurance
Marketers can use the resulting associations to form a rough mental map for the brand (see Figure 9-2 for a sample mental map for State Farm insurance).
Marketers use free association tasks mainly to identify the range of possible brand associations in consumers’ minds, but free association may also provide some rough indication of the relative strength, favorability, and uniqueness of brand associations.5 Coding free association responses in terms of the order of elicitation—whether they are early or late in the sequence—at least gives us a rough measure of their strength.6 For example, if many consumers mention “fast and convenient” as one of their first associations when given “McDonald’s restaurants” as a probe, then the association is probably a relatively strong one and likely able to affect consumer decisions. Associations later in the list may be weaker and thus more likely to be overlooked during consumer decision making. Comparing associations with those elicited for competitive brands can also tell us about their relative uniqueness. Finally, we can discern even favorability, to some extent, on the basis of how consumers phrase their associations.
Answers to free-association questions help marketers clarify the range of possible associations and assemble a brand profile.7 To better understand the favorability of associations, we can ask consumers follow-up questions about the favorability of associations they listed or, more generally, what they like best about the brand. Similarly, we can ask them follow-up questions about the uniqueness of associations they listed or, more generally, about what they find unique about the brand. Useful questions include the following:
-
What do you like best about the brand? What are its positive aspects or advantages?
-
What do you like least about the brand? What are its negative aspects or disadvantages?
-
What do you find unique about the brand? How is it different from other brands?
These simple, direct measures can be extremely valuable for determining core aspects of a brand image. To elicit more structure and guidance, consumers can be asked further follow-up questions about what the brand means to them in terms of the classic journalism “who, what, when, where, why, and how” questions:
-
Who uses the brand? What kind of person?
-
What types of situations do they use the brand?
-
When and where do they use the brand?
-
Why do people use the brand? What do they get out of using it?
-
How do they use the brand? What do they use it for?
Guidelines
The two main issues to consider in conducting free association tasks are what types of probes to give to subjects, and how to code and interpret the resulting data. In order not to bias results, it is best to move from general considerations to more specific considerations, as we illustrated earlier. Thus, ask consumers first what they think of the brand as a whole without reference to any particular category, followed by specific questions about particular products and aspects of the brand image.
Consumers’ responses to open-ended probes can be either oral or written. The advantage of oral responses is that subjects may be less deliberate and more spontaneous in their reporting. In terms of coding the data, divide the protocols each consumer provides into phrases and aggregate them across consumers in categories. Because of their more focused nature, responses to specific probes and follow-up questions are naturally easier to code.
Projective Techniques
For marketers to succeed in uncovering the sources of brand equity, they must profile consumers’ brand knowledge structures as accurately and completely as possible. Unfortunately, under certain situations, consumers may feel that it would be socially unacceptable or undesirable to express their true feelings—especially to an interviewer they don’t even know! As a result, they may find it easier to fall back on stereotypical, pat answers they believe would be acceptable or perhaps even expected by the interviewer.
Consumers may be particularly unwilling or unable to reveal their true feelings when marketers ask about brands characterized by a preponderance of imagery associations. For example, it may be difficult for consumers to admit that a certain brand name product has prestige and enhances their self-image. They may instead refer to some particular product feature as the reason they like or dislike the brand. Or they may simply find it difficult to identify and express their true feelings when asked directly, even if they attempt to do so. For either of these reasons, it might be impossible to obtain an accurate portrayal of brand knowledge structures without some rather unconventional research methods.
Projective techniques are diagnostic tools to uncover the true opinions and feelings of consumers when they are unwilling or otherwise unable to express themselves on these matters.8 Marketers present consumers with an incomplete stimulus and ask them to complete it, or they give consumers an ambiguous stimulus and ask them to make sense of it. The idea is that in the process consumers will reveal some of their true beliefs and feelings. Thus, projective techniques can be especially useful when deeply rooted personal motivations or personally or socially sensitive subjects are at issue.
In psychology, the most famous example of a projective technique is the Rorschach test, in which experimenters present ink blots to subjects and ask them what the ink blots remind them of. In responding, subjects may reveal certain facets of their own, perhaps subconscious, personality. Psychologists also use dream analysis or probe the earliest and most defining memories a person has on a topic.9
Projective techniques have a long history in marketing, beginning with the motivation research of the late 1940s and 1950s.10 A classic example is an experiment exploring hidden feelings toward instant coffee conducted by Mason Haire in the late 1940s, summarized in Branding Brief 9-2.11 Although projective techniques don’t always yield results as powerful as in that example, they often provide useful insights that help to assemble us a more complete picture of consumers and their relationships with brands. Many kinds of projective techniques are possible. We’ll highlight a few here.12
Completion and Interpretation Tasks
Classic projective techniques use incomplete or ambiguous stimuli to elicit consumer thoughts and feelings. One approach is “bubble exercises,” which depict different people buying or using certain products or services. Empty bubbles, as in cartoons, are placed in the scenes to represent the thoughts, words, or actions of one or more of the participants. Marketers then ask consumers to “fill in the bubble” by indicating what they believe is happening or being said in the scene. The stories and conversations told this way can be especially useful for assessing user and usage imagery for a brand.
Comparison Tasks
Another useful technique is comparison tasks, in which we ask consumers to convey their impressions by comparing brands to people, countries, animals, activities, fabrics, occupations, cars, magazines, vegetables, nationalities, or even other brands.13 For example, we might ask consumers, “If Dannon yogurt were a car, which one would it be? If it were an animal, which one might it be? Looking at the people depicted in these pictures, which ones do you think would be most likely to eat Dannon yogurt?” In each case, we would ask a follow-up question about why subjects made the comparison they did. The objects people choose to represent the brand and their reasons can provide glimpses into the psyche of the consumer with respect to a brand, particularly useful in understanding imagery associations.
By examining the answers to probes, researchers may be better able to assemble a rich image for the brand, for example, identifying key brand personality associations. Branding Brief 9-3 outlines how hotel chain Joie de Vivre uses magazine imagery to clarify its brand positions.
Archetypes
Archetype research is one technique for eliciting deeply held consumer attitudes and feelings. According to cultural anthropologist G. C. Rapaille, consumers often make purchase decisions based on factors of which they are only subconsciously aware. Conventional market research typically does not uncover these motivations, so Rapaille employs the archetype research technique to find them.14
Rapaille believes children experience a significant initial exposure to an element of their world called the “imprinting moment.” The pattern that emerges when we generalize these imprinting moments for the entire population is the archetype, a fundamental psychological association, shared by the members of the culture, with a given cultural object. Different cultures have dramatically different archetypes for the same objects. In France, the archetype for cheese is “alive” because age is its most important trait. By contrast, the U.S. archetype for cheese is “dead”; it is wrapped in plastic (“a body-bag”), put in the refrigerator (“a morgue”), and pasteurized (“scientifically dead”).
Rapaille uses relaxation exercises and visualization with consumers to find the imprinting moments appropriate to the product he is researching. For example, at a focus group, he will dim the lights, play soothing music, and coax the subjects into a meditative state. He will then elicit stories about the product from the subjects and analyze these stories to illuminate the archetype.
Zaltman Metaphor Elicitation Technique
One interesting approach to better understand how consumers view brands is the Zaltman Metaphor Elicitation Technique (ZMET).15 ZMET is based on a belief that consumers often have subconscious motives for their purchasing behavior. “A lot goes on in our minds that we’re not aware of,” said former Harvard Business School professor Gerald Zaltman. “Most of what influences what we say and do occurs below the level of awareness. That’s why we need new techniques to get at hidden knowledge—to get at what people don’t know they know.”
To access this hidden knowledge, he developed the Zaltman Metaphor Elicitation Technique. As described in its U.S. patent, ZMET is “a technique for eliciting interconnected constructs that influence thought and behavior.” The word construct refers to “an abstraction created by the researcher to capture common ideas, concepts, or themes expressed by customers.” For example, the construct “ease of use” might capture the statements “simple to operate,” “works without hassle,” and “you don’t really have to do anything.”
ZMET stems from knowledge and research from varied fields such as “cognitive neuroscience, neurobiology, art critique, literary criticism, visual anthropology, visual sociology, semiotics . . . art therapy, and psycholinguistics.” The technique is based on the idea that “most social communication is nonverbal” and, as a result, approximately two-thirds of all stimuli received by the brain are visual. Using ZMET, Zaltman teases out consumers’ hidden thoughts and feelings about a particular topic, which often can be expressed best using metaphors.
Zaltman defines a metaphor as “a definition of one thing in terms of another, [which] people can use . . . to represent thoughts that are tacit, implicit, and unspoken.” ZMET focuses on surface, thematic, and deep metaphors. Some common deep metaphors include “transformation,” “container,” “journey,” “connection,” and “sacred and profane.”
A ZMET study starts with a group of participants who are asked in advance to think about the research topic at hand and collect a set of images from their own sources (magazines, catalogs, and family photo albums) that represent their thoughts and feelings about the research topic. The participants bring these images with them for a personal one-on-one two-hour interview
with a study administrator, who uses advanced interview techniques to explore the images with the participant and reveal their deep ideas, archetypes, themes, and emotions through a “guided conversation.”
The interview consists of a series of steps, each with a specific purpose in mind:
-
Storytelling: Exploring individual visual metaphors
-
Expand the Frame: Expanding the metaphoric meaning of images
-
Sensory Metaphor: Eliciting metaphors about the research topic from each sensory modality
-
Vignette: Using the mind’s eye to create a short story about the research topic
-
Digital Image: Integrating the images to create a visual summary of the research topic
Once the participants’ interviews have been completed, researchers identify key themes or constructs, code the data, and assemble a consensus map of the most important constructs. Quantitative analyses of the data can provide information for advertising, promotions, and other marketing decisions.
ZMET has been applied in a variety of different ways, including as a means to help understand consumers’ images of brands, products, and companies. Marketers can employ ZMET for a variety of consumer-insight research topics. Zaltman lists several of these:
ZMET is useful in understanding consumers’ images of brands, products, companies, brand equity, product concepts and designs, product usage and purchase experiences, life experiences, consumption context, and attitudes toward business.
For example, DuPont enlisted Zaltman to research women’s attitudes toward hosiery. Conventional research yielded the conclusion that “women mostly hated wearing pantyhose,” but DuPont market researchers were not convinced that this conclusion provided a complete picture. Zaltman used ZMET with 20 subjects in order to uncover deeper answers to the question, “What are your thoughts and feelings about buying and wearing pantyhose?” He discovered that women had a “like–hate” relationship with pantyhose; they disliked the discomfort and run-proneness of pantyhose but liked the feel of elegance and sexiness they got from wearing it. This discovery prompted a number of hosiery manufacturers to include more sexy and alluring imagery in their advertising. Figure 9-3 displays a consensus map that emerged from a study of intimate apparel.
Neural Research Methods
Taking ZMET one step further to dig even deeper into the subconscious, some marketing researchers are bypassing any verbal response from consumers to literally get inside the minds of consumers through various neural research methods. Neuromarketing is the study of how the

Figure 9-3 Application of ZMET to Intimate Apparel Market
brain responds to marketing stimuli, including brands.16 For example, some firms are applying sophisticated techniques such as EEG (elector encephalograph) technology to monitor brain activity and better gauge consumer responses to marketing.
Neurological research has been applied many ways in marketing.17 It has been used to measure the type of emotional response consumers exhibit when presented with marketing stimuli. Neurological research has shown that people activate different regions of the brain in assessing the personality traits of people than they do when assessing brands.
One major research finding to emerge from neurological consumer research is that many purchase decisions appear to be characterized less by the logical weighing of variables and more “as a largely unconscious habitual process, as distinct from the rational, conscious, information-processing model of economists and traditional marketing textbooks.” Even basic decisions, such as the purchase of gasoline, seem to be influenced by brain activity at the subrational level.
Firms as varied as Intel, Paypal, Google, HP, Citi, and Microsoft have employed neurological marketing research studies. Frito-Lay hired neuromarketing firm NeuroFocus to study how consumers responded to their Cheetos cheese-flavored snack. Scanning the brains of a carefully chosen group of consumers revealed that their most powerful response was to the product’s messy outer coating. The research study’s insight led to an award-winning ad campaign.18
By adding neurological techniques to their research arsenal, marketers are trying to move toward a more complete picture of what goes on inside consumers’ heads.19 Although it may be able to offer different insights from conventional techniques, neurological research at this point is very costly, running as much as $100,000 or even more per project. Given the complexity of the human brain, however, many researchers caution that neurological research should not form the sole basis for marketing decisions. These research activities have not been universally accepted. The measurement devices to capture brain activity can be highly obtrusive, such as with skull caps studded with electrodes, creating artificial exposure conditions. Others question whether they offer unambiguous implications for marketing strategy. Brian Knutson, a professor of neuroscience and psychology at Stanford University, compares the use of EEG to “standing outside a baseball stadium and listening to the crowd to figure out what happened.”
Brand Personality and Values
As defined in Chapter 2, brand personality is the human characteristics or traits that consumers can attribute to a brand. We can measure it in different ways. Perhaps the simplest and most direct way is to solicit open-ended responses to a probe such as the following:
If the brand were to come alive as a person, what would it be like? What would it do? Where would it live? What would it wear? Who would it talk to if it went to a party (and what would it talk about)?
If consumers have difficulty getting started in their descriptions, an easily understood example or prompt serves as a guide. For example, if Campbell’s soup were to be described as a person, one possible response might be as follows:20
Mrs. Campbell is a rosy-cheeked and plump grandmother who lives in a warm, cozy house and wears an apron as she cooks wonderful things for her grandchildren.
Other means are possible to capture consumers’ points of view. For example, marketers can give consumers a variety of pictures or a stack of magazines and ask them to assemble a profile of the brand. Ad agencies often conduct “picture sorting” studies to clarify who are typical users of a brand.
As Chapter 3 noted, brand personality and user imagery may not always agree. When USA Today was first introduced, a research study exploring consumer opinions of the newspaper indicated that the benefits readers and nonreaders perceived were highly consistent. Perceptions of the USA Today brand personality—as colorful, friendly, and simple—were also highly related. User imagery, however, differed dramatically: Nonreaders viewed a typical USA Today reader as a shallow “air head”; readers, on the other hand, saw a typical USA Today reader as a well-rounded person interested in a variety of issues. Based on these findings, an advertising campaign was introduced to appeal to nonreaders that showed how prominent people endorsed the newspaper.21
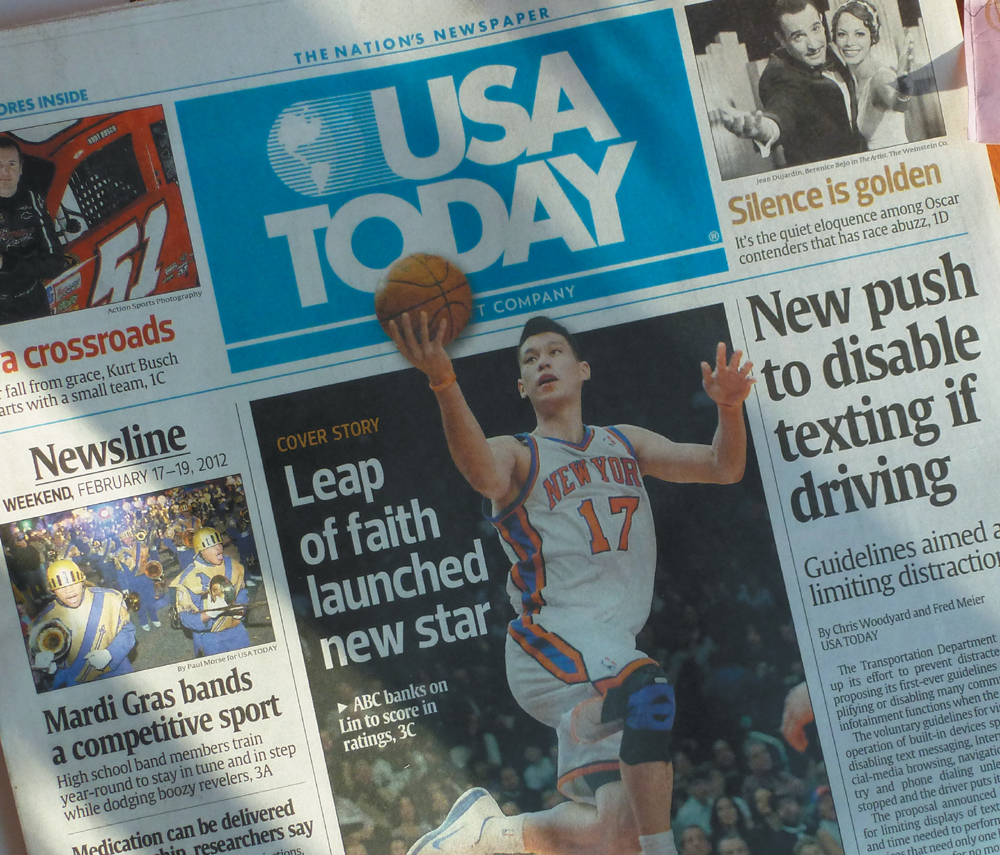
When USA Today launched, readers and nonreaders had very different brand imagery perceptions.
Source: Keri Miksza
The Big Five
We can assess brand personality more definitively through adjective checklists or ratings. Jennifer Aaker conducted a research project that provides an interesting glimpse into the personality of a number of well-known brands, as well as a methodology to examine the personality of any one brand. Based on an extensive data collection of ratings of 114 personality traits on 37 brands in various product categories by over 600 individuals representative of the U.S. population, she created a brand personality scale that reflected the following five factors (with underlying facets) of brand personality:22
-
Sincerity (down-to-earth, honest, wholesome, and cheerful)
-
Excitement (daring, spirited, imaginative, and up-to-date)
-
Competence (reliable, intelligent, and successful)
-
Sophistication (upper class and charming)
-
Ruggedness (outdoorsy and tough)
Figure 9-4 depicts the specific trait items that make up the Aaker brand personality scale. Respondents in her study rated how descriptive each personality trait was for each brand according to a seven-point scale (1 = not at all descriptive; 7 = extremely descriptive). Aaker averaged responses to provide summary measures. Some brands tend to be strong on one particular factor; some brands like Nike are high on more than one factor; some brands score poorly on all factors.
A cross-cultural study exploring the generalizability of this scale outside the United States found that three of the five factors applied in Japan and Spain, but that a “peacefulness” dimension replaced “ruggedness” both in Japan and Spain, and a “passion” dimension emerged in Spain instead of “competency.”23 Research on brand personality in Korea revealed that two culture-specific factors emerge (“passive likeableness” and “ascendancy”), reflecting the importance of Confucian values in Korea’s social and economic systems.24
Ethnographic and Experiential Methods
More than ever, researchers are working to improve the effectiveness of their qualitative approaches, as well as to go beyond traditional qualitative techniques to research consumers in their natural environment.25 The rationale is that no matter how clever the research design, consumers may not be able to fully express their true selves as part of a formalized research study. By tapping more directly into consumers’ actual home, work, or shopping behaviors, researchers might be able to elicit more meaningful responses.26 As markets become more competitive

Figure 9-4 Brand Personality Scale Measures
and many brand differences are threatened, any insight that helps to support a stronger brand positioning or create a stronger link to consumers is valuable (see Branding Brief 9-4).
We’ve noted that much of this type of research has its roots in ethnographic research originally used by anthropologists. Ethnographic research uses “thick description” based on participant observation. In marketing, the goal of ethnographic research is to extract and interpret the deep cultural meaning of events and activities through various research techniques such as consumer immersion, site visits, shop-alongs, embedded research, etc.27
Advocates of the ethnographic approach have sent researchers to consumers’ homes in the morning to see how they approach their days, given business travelers digital cameras and diaries to capture their feelings when in hotel rooms, and conducted “beeper studies” in which participants are instructed to write down what they’re doing when they are paged or texted.28
Marketers such as Procter & Gamble seek consumers’ permission to spend time with them in their homes to see how they actually use and experience products. Some of the many other companies that have used ethnographic research to study consumers include Best Western (to learn how seniors decide when and where to shop), Moen (to observe over an extended time how customers really use their shower devices), and Intel (to understand how people use mobile communications in moving around a city).29 A comprehensive ethnographic research study for JCPenney on their wedding registry resulted in a complete makeover at all levels.30 Consider how ethnographic research paid off for Hewlett-Packard (HP).
Hewlett-Packard (HP)
To better understand how surgeons operate, HP’s medical products division sent a set of researchers into hospitals to observe. Surgeons need to carefully monitor their scalpel movements on a video monitor. During an operation, however, the researchers observed that many other staff members would cross in front of the monitor, obscuring the surgeon’s line of sight. Because these staff members were going about their duties, the surgeons had failed to complain and prior research had failed to uncover the problem. Based on this research insight, HP developed a surgical helmet with goggles that cast images right in front of a surgeon’s eyes, circumventing the problem.31

An ethnographic research study by HP led to a breakthrough new medical product.
Source: moodboard/Alamy
Business-to-business firms can also benefit from company visits that help to cement relationships and supplement research efforts. Technology firms such as Hewlett-Packard use cross-functional customer visits as a market research tool to gain a competitive advantage.
Send an advance letter of confirmation with an agenda so customers know what to expect and can be prepared.
Send small cross-functional teams.
Select customers according to a plan and visit at least a dozen.
Don’t keep going back to the same small group of favorite customers.
Interview people at each site who represent each stage of the purchasing decision.
Get support from local account management.
Use a two- to three-page discussion guide in outline form.
Assign roles to team members (moderator, listener, note taker, etc.).
Use open-ended questions.
Don’t ask customers to give solutions—get them to identify problems.
Don’t talk too much and don’t show off your expertise.
Probe deeper by using follow-up questions.
Debrief immediately.
Highlight verbatim quotes in reports.
A summary report should emphasize big news and be organized by major themes.
Archive the report online with other marketing research and intelligence.
Figure 9-5 Tips for Conducting Good Customer Visits
Figure 9-5 offers advice from one expert on the subject, Ed McQuarrie, about best practices for an outbound or inbound customer visit.32
Service companies often employ mystery shoppers, paid researchers who pose as customers to learn about the service experience provided by a company. Sometimes the results can be eye-opening. When the president of Office Depot decided to pose as a mystery shopper himself, he found that employees were spending too much time keeping stores clean and well-stocked and not enough time actually building relationships with customers. As a result, the company reduced the size of stores, retrained and incentivized employees to focus more on customers, and added other products and services that customers wanted that were not currently available.33
Through the years, companies have changed the way they gain customer insights. Microsoft employs ethnographic research with in-depth studies of consumer online search attitudes and behavior. Observing consumers inside and outside the home in a series of research studies, the company learned of changes over time in the way consumers explore and learn about new things online.34
-
An initial study in 2004 revealed that consumers were just trying to find out what experts say, because they felt that experts “knew it all.”
-
A follow-up study in 2007 showed that consumers believed all the information they needed to learn was actually available through search engines—they just needed to figure out how to use the search engines.
-
By 2010, however, ethnographic research showed that people felt they actually created their own knowledge. Search engines were just enablers.
Of special research importance to many companies are lead or leading users. Many firms ask online groups of their most progressive consumers to give feedback via instant-messages or chat rooms. PepsiCo’s DEWmocracy 2 program, launched in July 2009, was a 12-month, seven-stage campaign to create another consumer-generated version of its Mountain Dew soft drink, as had happened when the first DEWmocracy produced the highly successful Mountain Dew Voltage. The new campaign tapped into DEW labs, the brand’s private online community of its most loyal customers, but also Facebook, Twitter, USTREAM, a 12-second TV video contest, and a dedicated YouTube channel.35 Another company with close ties to leading-edge users is Burton Snowboards.
Burton Snowboards
The best-known snowboard brand, Burton Snowboards, saw its market share increase from 30 percent to 40 percent by focusing on one objective—providing the best equipment to the largest number of snowboarders. To accomplish this goal, Burton engages in a number of activities. Burton puts much emphasis on its many professional riders worldwide, including a smaller percentage who are on its sponsored team. Staff members talk to the riders—on the slopes or on the phone—almost every day, and riders help to design virtually every Burton product. Company researchers immerse themselves in the riders’ lives, watching where they shop, what they buy, and what they think about the sport and the equipment. To make sure it doesn’t lose touch with its rank-and-file consumers, however, the company makes sure its sales representatives hit the slopes on the weekend to interact with amateur snowboarders. All employees also get a free season pass for the slopes and are allowed to use any new Burton gear for a few days to test and promote it. In 2010, the Burton Demo Tour became the largest consumer interactive product demo in the snowboard world, with over 2,000 riders testing Burton gear on slopes all over North America. Burton also has the eTeam—an online community of 25,000 kids who provide real-time feedback in exchange for free product trials. All of this information is fed into Burton’s state-of-the-art innovation center, “Craig’s,” named after the late snowboarding pioneer Craig Kelly, where advanced prototypes are developed and tested almost daily.36

Burton collects information from casual and professional riders to help it design innovative snowboards and other products.
Source: Olivier Maire/EPA/Newscom
Compact video cameras make capturing participants’ words and actions easier, and short films are often part of the research output that is reported to help bring the research to life.37 Every research method, however, has its advantages and disadvantages.38 Two of the more significant downsides to ethnographic research are that it is time-consuming and expensive. Moreover, because it is based on subjective interpretation, multiple points of view may prevail.
Summary
Qualitative research techniques are a creative means of ascertaining consumer perceptions that may otherwise be difficult to uncover. The range of possible qualitative research techniques is limited only by the creativity of the marketing researcher.
Qualitative research, however, also has its drawbacks. The in-depth insights that emerge have to be tempered by the realization that the samples are often very small and may not necessarily generalize to broader populations. Moreover, given the qualitative nature of the data, there may be questions of interpretation. Different researchers examining the same results from a qualitative research study may draw different conclusions.
Quantitative Research Techniques
Although qualitative measures are useful in identifying the range of possible associations with a brand and some initial insights into their strength, favorability, and uniqueness, marketers often want a more definitive portrait of the brand to allow them to make more confident and defensible strategic and tactical recommendations.
Some say qualitative research strives to uncover and discover, while quantitative research aims to prove or disprove. Whereas qualitative research typically elicits some type of verbal response from consumers, quantitative research typically employs various types of scale questions from which researchers can draw numerical representations and summaries.
Quantitative measures of brand knowledge can help to more definitively assess the depth and breadth of brand awareness; the strength, favorability, and uniqueness of brand associations; the positivity of brand judgments and feelings; and the extent and nature of brand relationships. Quantitative measures are often the primary ingredient in tracking studies that monitor brand knowledge structures of consumers over time, as we discussed in Chapter 8 .
Brand Awareness
Recall that brand awareness is related to the strength of the brand in memory, as reflected by consumers’ ability to identify various brand elements like the brand name, logo, symbol, character, packaging, and slogan under different conditions. Brand awareness describes the likelihood that a brand will come to mind in different situations, and the ease with which it does so given different types of cues.
Marketers use several measures of awareness of brand elements.39 Choosing the right one is a matter of knowing the relative importance of brand awareness for consumer behavior in the category and the role it plays in the success of the marketing program, as we discussed in Chapter 2. Let’s look at some of these awareness issues.
Recognition
Brand recognition requires consumers to identify the brand under a variety of circumstances and can rest on the identification of any of the brand elements. The most basic recognition test gives consumers a set of individual items visually or orally and asks them whether they think they’ve previously seen or heard of these items. To provide a more sensitive test, it is often useful to include decoys or lures—items consumers could not possibly have seen. In addition to “yes” or “no” responses, consumers can also rate how confident they are in their recognition of an item.
Other, somewhat more subtle, recognition measures test “perceptually degraded” versions of the brand, which are masked or distorted in some way or shown for extremely brief duration. For example, we can test brand name recognition with missing letters. Figure 9-6 tests your ability to recognize brand names with less than full information. These more subtle measures may be particularly important for brands that have a high level of recognition, in order to provide more sensitive assessments.40
A brand name with a high level of awareness will be recognized under less than ideal conditions. Consider the following list of incomplete names (i.e., word fragments). Which ones do you recognize? Compare your answers to the answer key in the footnote to see how well you did.
D _ _ N E _
K O _ _ K
D U _ A C _ _ _
H Y _ T _
A D _ _ L
M _ T _ E L
D _ L T _
N _ Q U _ L
G _ L L _ T _ _
H _ _ S H _ Y
H _ L L _ _ R K
M _ C H _ _ I N
T _ P P _ R W _ _ E
L _ G _
N _ K _
Answers: (1) Disney; (2) Kodak; (3) Duracell; (4) Hyatt; (5) Advil; (6) Mattel; (7) Delta; (8) NyQuil; (9) Gillette; (10) Hershey; (11) Hallmark; (12) Michelin; (13) Tupperware; (14) Lego; (15) Nike.
Figure 9-6 Don’t Tell Me, It’s On the Tip of My Tongue
Brand recognition is especially important for packaging, and some marketing researchers have used creative means to assess the visibility of package design. As a starting point, they consider the benchmark or “best case” of the visibility of a package when a consumer (1) with 20–20 vision (2) is face-to-face with a package (3) at a distance of less than five feet (4) under ideal lighting conditions.
A key question then is whether the package design is robust enough to be still recognizable if one or more of these four conditions are not present. Because shopping is often not conducted under “ideal” conditions, such insights are important. For example, many consumers who wear eyeglasses do not wear them when shopping in a supermarket. Is the package still able to effectively communicate to consumers under such conditions?
Research methods using tachistoscopes (T-scopes) and eye tracking techniques exist to test the effectiveness of alternative package designs according to a number of specific criteria:
-
Degree of shelf impact
-
Impact and recall of specific design elements
-
Perceived package size
-
Copy visibility and legibility
-
Distance at which the package can first be identified
-
Angle at which the package can first be identified
-
Speed with which the package can be identified
These additional measures can provide more sensitive measures of recognition than simple “yes” or “no” tasks. By applying these direct and indirect measures of brand recognition, marketers can determine which brand elements exist in memory and, to some extent, the strength of their association. One advantage that brand recognition measures have over recall measures is the chance to use visual recognition. It may be difficult for consumers to describe a logo or symbol in a recall task; it’s much easier for them to assess the same elements visually in a recognition task.
Nevertheless, brand recognition measures provide only an approximation of potential recallability. To determine whether consumers will actually recall the brand elements under various circumstances, we need measures of brand recall.
Recall
To demonstrate brand recall, consumers must retrieve the actual brand element from memory when given some related probe or cue. Thus, brand recall is a more demanding memory task than brand recognition because consumers are not just given a brand element and asked to say whether they’ve seen it before.
Different measures of brand recall are possible depending on the type of cues provided to consumers. Unaided recall on the basis of “all brands” provided as a cue is likely to identify

Before a new package ever hits the shelf, marketers often conduct research to understand its likely impact even in the store itself.
Source: Paul Burns Cultura/Newscom
only the very strongest brands. Aided recall uses various types of cues to help consumer recall. One possible sequence of aided recall might use progressively narrower cues—such as product class, product category, and product type labels—to provide insight into the organization of consumers’ brand knowledge structures.
For example, if recall of the Porsche 911—a high-performance German sports car—in non-German markets were of interest, recall probes could begin with “all cars” and move to more and more narrowly defined categories such as “sports cars,” “foreign sports cars,” or even “high-performance German sports cars.” Marketers could ask consumers: “When you think of foreign sports cars, which brands come to mind?”
Other types of cues can help measure brand recall. For example, marketers can ask about product attributes (“When you think of chocolate, which brands come to mind?) or usage goals (“If you were thinking of having a healthy snack, which brands come to mind?”). Often, to capture the breadth of brand recall and to assess brand salience, we might need to examine the context of the purchase decision or consumption situation, such as different times and places. The stronger the brand associations to these non-product considerations, the more likely it is that consumers will recall them when given those situational cues.
When combined, measures of recall based on product attribute or category cues and situational or usage cues give an indication of breadth and depth of recall. We can further distinguish brand recall according to the order as well as the latency or speed of recall. In many cases, people will recognize a brand when it is shown to them and will recall it if they are given a sufficient number of cues. Thus, potential recallability is high. The more important issue is the salience of the brand: Do consumers think of the brand under the right circumstances, for example, when they could be either buying or using the product? How quickly do they think of the brand? Is it automatically or easily recalled? Is it the first brand they recall?
Corrections for Guessing
Any research measure must consider the issue of consumers making up responses or guessing. That problem may be especially evident with certain types of aided awareness or recognition measures for the brand. Spurious awareness occurs when consumers erroneously claim they recall something they really don’t and that may not even exist. For example, one market research firm, Oxtoby-Smith, conducted a benchmark study of awareness of health and beauty products.41 In the study, the firm asked consumers questions like this:
“The following is a list of denture adhesive brand names. Please answer yes if you’ve heard the name before and no if you haven’t. Okay? Orafix? Fasteeth? Dentu-Tight? Fixodent?”
Although 16 percent of the sample reported that they had heard of Dentu-Tight, there was one problem: it didn’t exist! Similarly high levels of reported recall were reported for plausible-sounding but fictitious brands such as Four O’Clock Tea (8 percent), Leone Pasta (16 percent), and Mrs. Smith’s Cake Mix (31 percent). On the basis of this study, Oxtoby-Smith found that spurious awareness was about 8 percent for new health and beauty products and even higher in some other product categories. In one case, a proposed line extension was mistakenly thought to already exist by about 50 percent of the sample (a finding that no doubt sent a message to the company that it should go ahead and introduce the product!).
From a marketing perspective, the problem with spurious awareness is that it may send misleading signals about the proper strategic direction for a brand. For example, Oxtoby-Smith reported that one of its clients was struggling with a 5 percent market share despite the fact that 50 percent of survey respondents reported they were aware of the brand. On the surface, it would seem a good idea to improve the image of the brand and attitudes toward it in some way. Upon further examination, marketers determined that spurious awareness accounted for almost half the survey respondents who reported brand awareness, suggesting that a more appropriate solution to the true problem would be to first build awareness to a greater degree. Marketers should be sensitive to the possibilities of misleading signals because of spurious brand awareness, especially with new brands or ones with plausible-sounding names.
Strategic Implications
The advantage of aided recall measures is that they yield insight into how brand knowledge is organized in memory and what kind of cues or reminders may be necessary for consumers to be able to retrieve the brand from memory. Understanding recall when

For a unique sports car like Porsche, it is important for marketers to understand the breadth and depth of its brand awareness.
Source: Hand-out/PORSCHE CANADA/Newscom
we use different levels of product category specificity as cues is important, because it has implications for how consumers form consideration sets and make product decisions.
For example, again consider the Porsche 911. Assume consumer recall of this particular car model was fairly low when all cars were considered but very high when foreign sports cars were considered. In other words, consumers strongly categorized the Porsche 911 as a prototypical sports car but tended to think of it in only that way. If that were the case, for more consumers to entertain the possibility of buying a Porsche 911, we might need to broaden the meaning of Porsche so that it has a stronger association to cars in general. Of course, such a strategy risks alienating existing customers who had been initially attracted by the “purity” and strong identification of the Porsche 911 as a sports car. The choice of appropriate strategy would depend on the relative costs and benefits of targeting the two different segments.
The point is that the category structure that exists in consumers’ minds—as reflected by brand recall performance—can have profound implications for consumer choice and marketing strategy, as demonstrated by The Science of Branding 9-1. The insights gleaned from measuring brand recall are also valuable for developing brand identity and integrated marketing communication programs, as we showed in Chapters 4 and 6 . For example, we can examine brand recall for each brand element to explore the extent to which any one of these (name, symbol, or logo) suggests any other. Are consumers aware of all the different brand elements and how they relate?
We also need a complete understanding of brand image, as covered in the following section.
Brand Image
One vitally important aspect of the brand is its image, as reflected by the associations that consumers hold for it. It is useful for marketers to make a distinction between lower-level considerations, related to consumer perceptions of specific performance and imagery attributes and benefits, and higher-level considerations related to overall judgments, feelings, and relationships. There is an obvious connection between the two levels, because consumers’ overall responses and relationship with a brand typically depend on perceptions of specific attributes and benefits of that brand. This section considers some issues in measuring lower-level brand performance and imagery associations.
Beliefs are descriptive thoughts that a person holds about something (for instance, that a particular software package has many helpful features and menus and is easy to use).42 Brand association beliefs are those specific attributes and benefits linked to the brand and its competitors.
For example, consumers may have brand association beliefs for Sony PlayStation 3 entertainment system such as “fun and exciting,” “cool and hip,” “colorful,” “great graphics,” “advanced technology,” “variety of game titles,” and “sometimes violent.” They may also have associations to the brand logo and the slogan, “It Only Does Everything.” PlayStation 3 user imagery may be “used by teenagers or 20-something males who are serious about playing video games, especially sports games.”
In Chapter 2, we provided a structured set of measures to tap into performance and imagery associations. The qualitative research approaches we described earlier are useful in uncovering the different types of specific brand associations making up the brand image. To better understand their potential ability to serve as basis for brand positioning and how they might contribute to brand equity, we can assess belief associations on the basis of one or more of the three key dimensions—strength, favorability, and uniqueness—making up the sources of brand equity.
As a first cut, we can use open-ended measures that tap into the strength, favorability, and uniqueness of brand associations, as follows:
-
What are the strongest associations you have to the brand? What comes to mind when you think of the brand? (Strength)
-
What is good about the brand? What do you like about the brand? What is bad about the brand? What do you dislike about the brand? (Favorability)
-
What is unique about the brand? What characteristics or features does the brand share with other brands? (Uniqueness)
To what extent do you feel the following product characteristics are descriptive of Lipton iced tea (where 1 =3D strongly disagree and 7 =3D strongly agree)?
____________ convenient
____________ refreshing and thirst quenching
____________ real and natural
____________ good-tasting
____________ contemporary and relevant
____________ used by young professionals
How good or bad is it for iced tea to have the following product characteristics (where 1 =3D very bad and 7 =3D very good)?
____________ convenient
____________ refreshing and thirst quenching
____________ real and natural
____________ good-tasting
____________ contemporary and relevant
____________ used by young professionals
How unique is Lipton iced tea in terms of the following product characteristics (where 1 =3D not at all unique and 7 =3D highly unique)?
____________ convenient
____________ refreshing and thirst quenching
____________ real and natural
____________ good-tasting
____________ contemporary and relevant
____________ used by young professionals
Figure 9-7 Example of Brand Association Ratings in Terms of Strength, Favorability, and Uniqueness
To gain more specific insights, we could rate these belief associations according to strength, favorability, and uniqueness, as Figure 9-7 illustrates with Lipton iced tea. Indirect tests also can assess the derived importance and favorability of these brand associations (through multivariate regression techniques).
Other Approaches
A more complicated quantitative technique to assess overall brand uniqueness is multidimensional scaling, or perceptual maps. Multidimensional scaling (MDS) is a procedure for determining the perceived relative images of a set of objects, such as products or brands. MDS transforms consumer judgments of similarity or preference into distances represented in perceptual space. For example, if brands A and B are judged by respondents to be the most similar of a set of brands, the MDS algorithm will position brands A and B so that the distance between them in multidimensional space is smaller than the distance between any other two pairs of brands. Respondents may base their similarity between brands on any basis—tangible or intangible.43
Figure 9-8 displays a hypothetical perceptual map of restaurants in a particular market. Segment 1 is more concerned with health than taste and is well targeted by Brand B; segment 2 is more concerned with taste and is well targeted by Brand C. Brand A is trapped in the middle. It either must improve taste to provide a healthy alternative to Brand C for segment 2, or it must improve healthiness to prove a tastier alternative to Brand B for segment 1.
Brand Responses
The purpose of measuring more general, higher-level considerations is to find out how consumers combine all the more specific, lower-level considerations about the brand in their minds to form different types of brand responses and evaluations. Chapter 2 provided examples of measures of key brand judgments and feelings. Here we delve into more detail.
Purchase Intentions
Another set of measures closely related to brand attitudes and consideration looks at purchase intentions44 and focus on the likelihood of buying the brand or of switching to another brand. Research in psychology suggests that purchase intentions are most likely to
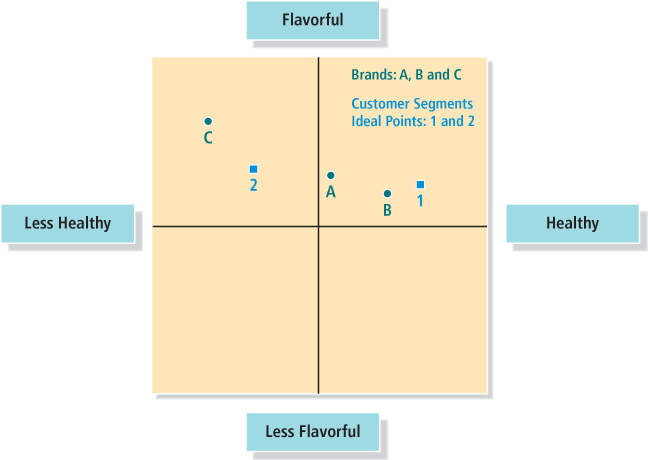
Figure 9-8 Hypothetical Restaurant Perceptual Map
be predictive of actual purchase when there is correspondence between the two in the following dimensions:45
-
Action (buying for own use or to give as a gift)
-
Target (specific type of product and brand)
-
Context (in what type of store based on what prices and other conditions)
-
Time (within a week, month, or year)
In other words, when asking consumers to forecast their likely purchase of a product or a brand, we want to specify exactly the circumstances—the purpose of the purchase, the location of the purchase, the time of the purchase, and so forth. For example, we could ask consumers:
“Assume your refrigerator broke down over the next weekend and could not be inexpensively repaired. If you went to your favorite appliance store and found all the different brands competitively priced, how likely would you be to buy a General Electric refrigerator?”
Consumers could indicate their purchase intention on an 11-point probability scale that ranges from 0 (definitely would not buy) to 10 (definitely would buy).
Likelihood to Recommend
Bain’s Frederick Reichheld suggests there is only one customer question that really matters: “How likely is it that you would recommend this product or service to a friend or colleague?” According to Reichheld, a customer’s willingness to recommend results from all aspects of a customer’s experience.46
Reicheld uses answers to this question to create what he calls a Net Promoter Score (NPS). Specifically, in a survey, customers are asked to rate their likelihood to recommend on a 0–10-point scale. Marketers then subtract detractors (those who gave a 0–6) from promoters (those who gave a 9 or 10) to arrive at the NPS score. Customers who rate the brand with a 7 or 8 are deemed passively satisfied and are not included. A typical set of NPS scores falls in the 10–30 percent range, but world-class companies can score over 50 percent. Some firms with top NPS scores include USAA (89 percent), Apple (77 percent), Amazon.com (74 percent), and Google (71 percent).
Several companies have seen benefits from adopting NetPromoter scores as a means of tracking brand health. When the European unit of GE Healthcare overhauled its call center and put more specialists in the field, GE Healthcare’s Net Promoter scores jumped 10–15 points. BearingPoint found clients who gave it high Net Promoter scores showed the highest revenue growth. When Intuit applied Net Promoter to its TurboTax product, feedback revealed dissatisfaction with the software’s rebate procedure. After Intuit dropped the proof-of-purchase requirement, sales jumped 6 percent.

TurboTax used NetPromoter scores to help fine-tune its marketing program.
Source: AP Photo/RIGELHAUPT SAMUEL/SIPA
Brand Relationships
Chapter 2 characterized brand relationships in terms of brand resonance and offered possible measures for each of the four key dimensions: behavioral loyalty, attitudinal attachment, sense of community, and active engagement. This section considers additional considerations with respect to each of those four dimensions. Figure 9-9 displays a scale, although developed by its authors to measure overall brand engagement, could easily be adapted to measure brand resonance by replacing mentions of brands with a specific brand. For example, instead of saying, “I have a special bond with the brands I like,” it could say, “I have a special bond with my Saab automobile,” and so on.
Behavioral Loyalty
To capture reported brand usage and behavioral loyalty, we could ask consumers several questions directly. Or we could ask them what percentage of their last purchases in the category went to the brand (past purchase history) and what percentage of their planned next purchases will go to the brand (intended future purchases). For example, the marketers or brand managers of Duracell batteries might ask the following questions:
-
Which brand of batteries do you usually buy?
-
Which brand of batteries did you buy last time?
-
Do you have any batteries on hand? Which brand?
-
Which brands of batteries did you consider buying?
-
Which brand of batteries will you buy next time?
These types of questions can provide information about brand attitudes and usage for Duracell, including potential gaps with competitors and the names of other brands that might be in the consideration set at the time of purchase.
Marketers can make their measures open ended, force consumers to choose one of two brands, or offer multiple choice or rating scales. They can compare the answers with actual measures of consumer behavior to assess whether consumers are accurate in their predictions. For example, if 30 percent of consumers reported, on average, that they thought they would take their vitamins daily over the next two weeks, but only 15 percent of consumers reported two weeks later that they actually had done so during that period, then Centrum brand managers might need to devise strategies to better convert intentions to actual behavior.
In a business-to-business setting, Narayandas advocates analyzing sales records, talking to sales teams, and conducting surveys to assess where customers stand on a “loyalty ladder.”47
I have a special bond with the brands I like.
I consider my favorite brands to be part of myself.
I often feel a personal connection between my brands and me.
Part of me is defined by important brands in my life.
I feel as if I have a close personal connection with the brands I most prefer.
I can identify with important brands in my life.
There are links between the brands that I prefer and how I view myself.
My favorite brands are an important indication of who I am.
Figure 9-9 A Brand Engagement Scale
Source: David Sprott, Sandor Czellar, and Eric Spangenberg, “The Importance of a General Measure of Brand Engagement on Market Behaviour: Development and Validation of a Scale,“ Journal of Marketing Research 46 (February 2009): 92–104.
Attitudinal Attachment
Several different approaches have been suggested to measure the second component of brand resonance—brand attachment.48 Some researchers like to characterize it in terms of brand love.49 One study proposed a brand love scale that consists of 10 items: (1) This is a wonderful brand; (2) This brand makes me feel good; (3) This brand is totally awesome; (4) I have neutral feelings about this brand (reverse-coded item); (5) This brand makes me very happy; (6) I love this brand; (7) I have no particular feelings about this brand (reverse-coded item); (8) This brand is a pure delight; (9) I am passionate about this brand; and (10) I am very attached to this brand.50
Another study found 11 dimensions that characterized brand love:51
-
Passion (for the brand).
-
Duration of the relationship (the relationship with the brand exists for a long time).
-
Self-congruity (congruity between self-image and product image).
-
Dreams (the brand favors consumer dreams).
-
Memories (evoked by the brand).
-
Pleasure (that the brand provides to the consumer).
-
Attraction (feel toward the brand).
-
Uniqueness (of the brand and/or of the relationship).
-
Beauty (of the brand).
-
Trust (the brand has never disappointed).
-
Declaration of affect (feel toward the brand).
One promising approach defines brand attachment in terms of two underlying constructs—brand-self connections and brand prominence—where each of those two dimensions have two subdimensions, suggesting the following sets of measures:52
-
Brand-Self Connection
-
Connected: “To what extent do you feel that you are personally connected to (Brand)?”
-
Part of Who You Are: “To what extent is (Brand) part of you and who you are?”
-
-
Brand Prominence
-
Automatic: “To what extent are your thoughts and feelings towards (Brand) often automatic, coming to mind seemingly on their own?”
-
Naturally: “To what extent do your thoughts and feelings towards (Brand) come to you naturally and instantly?”
-
Sense of Community
Although measuring behavioral loyalty and attitudinal attachment may require a fairly structured set of questions, both sense of community and active engagement could call for more varied measures because of their diverse set of issues.
One interesting concept that has been proposed with respect to community is social currency, developed by brand consultants Vivaldi Partners. They define social currency as “the extent to which people share the brand or information about the brand as part of their everyday social lives at work or at home.” Figure 9-10 displays the different dimensions that make up the social currency concept according to Vivaldi Partners.
Dimension |
Key Question |
Value of Dimension |
|---|---|---|
Conversation |
What share of your brand users recognizes and stirs buzz? |
Customers proactively talk about a brand. |
Advocacy |
How many act as disciples and stand up for your brand? |
Customers are willing to tell others about a brand or recommend it further. |
Information |
How many feel they exchange fruitful information with others? |
The more information customers have about a brand the more likely they are to develop preferences for the brand. |
Affiliation |
What share of users has a sense of community? |
Value of brand is closely related to sense of community it creates among other like-minded people. |
Utility |
How much value do consumers derive from interacting with others? |
Social exchange with others involving a brand is an integral part of people’s lives. |
Identity |
How many of your users can identify with other users? |
Customers develop strong sense of identity and ability to express themselves to others by using a brand. |
Figure 9-10 Vivaldi Partners’ Social Currency Model
Source: Used with permission from Erich Joachimsthaler at Vivaldi Partners.
Active Engagement
According to the brand resonance model, active engagement for a brand is defined as the extent to which consumers are willing to invest their own personal resources—time, energy, money, and so on—on the brand beyond those resources expended during purchase or consumption of the brand.
For example, in terms of engagement, in-depth measures could explore word-of-mouth behavior, online behavior, and so forth. For online behavior, measures could explore the extent of customer-initiated versus firm-initiated interactions, the extent of learning and teaching by the customer versus by the firm, the extent of customers teaching other customers, and so on.53
The key to such metrics is the qualitative nature of the consumer-brand interaction and how well it reflects intensity of feelings. One mistake many Internet firms made was to put too much emphasis on “eyeballs” and “stickiness”—the number and duration of page views at a Web site, respectively. The depth of the underlying brand relationships of the customers making those visits, however, and the manner in which those relationships manifest themselves in brand-beneficial actions, will typically be more important.
Accordingly, researchers are attempting to determine the brand value of different online and social media activities.54 For example, how important is a “like” from a user on Facebook? One firm estimated that bringing a user on as a fan could be worth between 44 cents and $3.60 in equivalent media value from increased impressions generated from the Facebook newsfeed. Critics of the study, however, pointed out that not all fans are created equal.55
Several different specific approaches have been suggested to measure brand engagement. The Science of Branding 9-2 provides a detailed breakdown of the concept.
Fournier’s Brand Relationship Research
Boston University’s Susan Fournier argues that brands can and do serve as viable relationship partners, and she suggests a reconceptualization of the notion of brand personality within this framework.56 Specifically, the everyday execution of marketing mix decisions constitutes a set of behaviors enacted on the part of the brand. These actions trigger a series of inferences regarding the implicit contract that appears to guide the engagement of the consumer and brand and, hence, the type of relationship formed.
Brand personality as conceptualized within this framework describes the relationship role enacted by the brand in its partnership capacity. For example, if the brand expresses behaviors that signal commitment to the consumer, and further if it sends gifts as symbols of affection, the consumer may infer a courtship or marriage type of engagement with the brand.
Fournier identifies a typology of 15 different relationship types characterizing consumers’ engagement with brands (see Figure 9-11). Fournier argues that this relationship role view of brand personality provides more actionable guidance to managers who wish to create and manage their brand personalities in line with marketing actions than does the trait-based
view, which identifies general personality tendencies that might or might not be connected to marketing strategies and goals.
Fournier has conducted fascinating research that reframes the conceptualization and measurement of brand strength strictly in relationship terms. It defines a brand’s strength in terms of the strength, depth, and durability of the consumer-brand relational bond using the multifaceted concept of brand relationship quality, or BRQ. Extensive validation work supported a multifaceted hierarchical structure for the BRQ construct that includes six main dimensions of relationship strength, many with important subfacets. The main facets are (1) interdependence, (2) self-concept connection, (3) commitment, (4) love/passion, (5) intimacy, and (6) brand partner quality.
Relationship Form |
Case Examples |
|---|---|
Arranged marriage: Nonvoluntary union imposed by preferences of third party. Intended for long-term, exclusive commitment. |
Karen’s husband’s preferred brands (e.g., Mop’n Glo, Palmolive, Hellman’s); Karen’s Esteȳ Lauder, imposed through gift-giving; Jean’s use of Murphy’s Oil Soap as per manufacturer recommendation. |
Casual friend/buddy: Friendship low in affect and intimacy, characterized by infrequent or sporadic engagement and few expectations of reciprocity or reward. |
Karen and her household cleaning brands. |
Marriage of convenience: Long-term, committed relationship precipitated by environmental influence rather than deliberate choice, and governed by satisfying rules. |
Vicki’s switch to regional Friend’s Baked Beans brand from favored B&M brand left behind; Jean’s loyalty to DeMoulas salad dressing brand left behind by client at the bar. |
Committed partnership: Long-term, voluntarily imposed, socially supported union high in love, intimacy, trust, and commitment to stay together despite adverse circumstances. Adherence to exclusivity rules expected. |
Jean and virtually all her cooking, cleaning, and household appliance brands; Karen and Gatorade. |
Best friendship: Voluntary union based on reciprocity principle, the endurance of which is ensured through continued provision of positive rewards. Characterized by revelation of true self, honesty, and intimacy. Congruity in partner images and personal interests common. |
Karen and Reebok running shoes; Vicki and Crest or Ivory. |
Compartmentalized friendship: Highly specialized, situationally confined, enduring friendship characterized by lower intimacy than other friendship forms but higher socio-emotional rewards and interdependence. Easy entry and exit. |
Vicki and her stable of shampoos, perfumes, and lingerie brands. |
Kinship: Nonvoluntary union with lineage ties. |
Vicki’s preferences for Tetley tea or Karen’s for Ban, Joy, and Miracle Whip, all of which were inherited through their mothers. |
Rebound relationship: Union precipitated by desire to replace prior partner, as opposed to attraction to replacement partner. |
Karen’s use of Comet, Gateway, and Success Rice. |
Childhood friendship: Infrequently engaged, affective relation reminiscent of childhood times. Yields comfort and security of past self. |
Jean and Jell-O pudding. |
Courtship: Interim relationship state on the road to committed partnership contract. |
Vicki and her Musk scent brands. |
Dependency: Obsessive, highly emotional, selfish attractions cemented by feeling that the other is irreplaceable. Separation from other yields anxiety. High tolerance of other’s transgressions results. |
Karen and Mary Kay; Vicki and Soft ’n Dry. |
Fling: Short-term, time-bounded engagement of high emotional reward. Devoid entirely of commitment and reciprocity demands. |
Vicki’s trial-size shampoo brands. |
Enmity: Intensely involving relationship characterized by negative affect and desire to inflict pain or revenge on the other. |
Karen and her husband’s brands, postdivorce; Jean and her other-recommended-but-rejected brands (e.g., ham, peanut butter, sinks). |
Enslavement: Nonvoluntary relationship union governed entirely by desires of the relationship partner. |
Karen and Southern Bell, Cable Vision. Vicki and Playtex, a bra for large-breasted women. |
Secret affair: Highly emotive, privately held relationship considered risky if exposed to others. |
Karen and the Tootsie Pops she sneaks at work. |
Figure 9-11 A Typology of Consumer-Brand Relationships
Fournier argues that these facets and their subfacets (such as trust within the partner quality facet or consumer-to-firm and firm-to-consumer intimacy) have superior diagnostic value over competing strength measures, and she suggests they have greater managerial utility in their application. In her experience, BRQ measures have been successfully incorporated in brand tracking studies, where they provide profiles of brand strength versus competitors, useful ties to marketplace performance indicators, and specific guidance for the enhancement and dilution of brand equity through managerial actions in the marketplace. Although brand relationship quality shares some characteristics with brand resonance, it provides valuable additional perspectives and insights.
The six main facets of brand relationship quality are as follows:
-
Interdependence: The degree to which the brand is ingrained in the consumer’s daily course of living, both behaviorally (in terms of frequency, scope, and strength of interactions) and cognitively (in terms of longing for and preoccupation with anticipated brand interactions). Interdependence is often revealed through the presence of routinized behavioral rituals surrounding brand purchase and use, and through separation anxiety experienced during periods of product deprivation. At its extremes, interdependence becomes dependency and addiction.
-
Self-concept connection: The degree to which the brand delivers on important identity concerns, tasks, or themes, thereby expressing a significant part of the self-concept, both past (including nostalgic references and brand memories) and present, and personal as well as social. Grounding of the self provides feelings of comfort, connectedness, control, and security. In its extreme form, self-connection reflects integration of concepts of brand and self.
-
Commitment: Dedication to continued brand association and betterment of the relationship, despite circumstances foreseen and unforeseen. Commitment includes professed faithfulness and loyalty to the other, often formalized through stated pledges and publicized intentions. Commitment is not defined solely by sunk costs and irretrievable investments that pose barriers to exit.
-
Love/passion: Affinity toward and adoration of the brand, particularly with respect to other available alternatives. The intensity of the emotional bonds joining relationship partners may range from feelings of warmth, caring, and affection to those of true passion. Love includes the belief that the brand is irreplaceable and uniquely qualified as a relationship partner.
-
Intimacy: A sense of deep familiarity with and understanding of both the essence of the brand as a partner in the relationship and the nature of the consumer-brand relationship itself. Intimacy is revealed in the presence of a strong consumer-brand relationship culture, the sharing of little-known personal details of the self, and an elaborate brand memory containing significant experiences or associations. Intimacy is a two-dimensional concept: the consumer develops intimate knowledge of the brand, and also feels a sense of intimacy exhibited on the part of the brand toward the individual as a consumer.
-
Partner quality: Perceived partner quality involves a summary judgment of the caliber of the role enactments performed by the brand in its partnership role. Partner quality includes three central components: (1) an empathic orientation toward the other (ability of the partner to make the other feel wanted, cared for, respected, noticed, and important; responsiveness to needs); (2) a character of reliability, dependability, and predictability in the brand; and (3) trust or faith in the belief that the brand will adhere to established relationship rules and be held accountable for its actions.
Comprehensive Models of Consumer-Based Brand Equity
The customer-based brand equity model presented in this text provides a comprehensive, cohesive overview of brand building and brand equity. Other researchers and consultants have also put forth consumer-based brand equity models that share some of the same principles and philosophy as the CBBE model, although developed in a different way. Brand Focus 9.0 presents a detailed account of arguably the most successful and influential industry branding model, Young and Rubicam’s BrandAsset Valuator. Another influential model is Millward Brown’s BrandDynamics.57
BrandDynamics
Marketing research agency Millward Brown’s BrandDynamics model offers a graphical model to represent the emotional and functional strength of relationship consumers have with
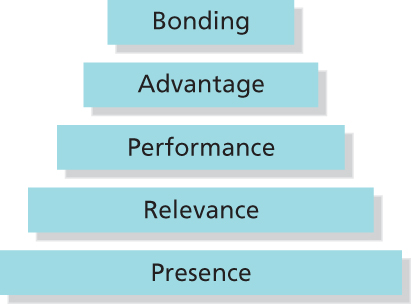
Figure 9-12 BrandDynamics™ from Millward Brown
Source: Reproduced with permission courtesy of Millward Brown. www.millwardbrown.com.
a brand. As Figure 9-12 shows, the BrandDynamics model adopts a hierarchical approach to determine the strength of relationship a consumer has with a brand. The five levels of the model, in ascending order of an increasingly intense relationship, are presence, relevance, performance, advantage, and bonding. Consumers are placed into one of the five levels depending on their brand responses. By comparing the pattern across brands, we can uncover relative strengths and weaknesses and see where brands can focus their efforts to improve their loyalty relationships.
Relationship to the CBBE Model
We can easily relate the five sequenced stages of Millward Brown’s BrandDynamics model—presence, relevance, performance, advantage, and bonding—to the four ascending steps of the CBBE model (identity, meaning, responses, and relationships) and specific CBBE model concepts (such as salience, consideration, performance or quality, superiority, and resonance).
Thus, the CBBE model synthesizes the concepts and measures from a leading industry model and at the same time provides much additional substance and insight. Several particularly noteworthy aspects of the CBBE model are (1) its emphasis on brand salience and breadth and depth of brand awareness as the foundation of brand building; (2) its recognition of the dual nature of brands and the significance of both rational and emotional considerations in brand building; and (3) the importance it places on brand resonance as the culmination of brand building and a more meaningful way to view brand loyalty.
Review
According to the brand value chain, sources of brand equity arise from the customer mind-set. In general, measuring sources of brand equity requires that the brand manager fully understand how customers shop for and use products and services and, most important, what customers know, think, and feel about various brands. In particular, measuring sources of customer-based brand equity requires measuring various aspects of brand awareness and brand image that lead to the customer response that creates brand equity.
This chapter described both qualitative and quantitative approaches to measure consumers’ brand knowledge structures and identify potential sources of brand equity—that is, measures to capture the customer mind-set. Qualitative research techniques are a means to identify possible brand associations. Quantitative research techniques are a means to better approximate the breadth and depth of brand awareness; the strength, favorability, and uniqueness of brand associations; the favorability of brand responses; and the nature of brand relationships. Because of their unstructured nature, qualitative measures are especially well suited to provide an in-depth glimpse of what brands and products mean to consumers. To obtain more precise and generalizable information, however, marketers typically use quantitative scale measures.
Figure 9-13 summarizes some of the different types of measures that were discussed in the chapter.
Qualitative Research Techniques
Free association
Adjective ratings and checklists
Projective techniques
Photo sorts
Bubble drawings
Story telling
Personification exercises
Role playing
Experiential methods
Quantitative Research Techniques
Brand Awareness
Direct and indirect measures of brand recognition
Aided and unaided measures of brand recall
Brand Image
Open-ended and scale measures of specific brand attributes and benefits
Strength
Favorability
Uniqueness
Overall judgments and feelings
Overall relationship measures
Intensity
Activity
Figure 9-13 Summary of Qualitative and Quantitative Measures
Discussion Questions
-
Pick a brand. Employ projective techniques to attempt to identify sources of its brand equity. Which measures work best? Why?
-
Run an experiment to see whether you can replicate Mason Haire’s instant coffee experiment (see Branding Brief 9-2). Do the same attributions still hold? If not, can you replace coffee with a brand combination from another product category that would produce pronounced differences?
-
Pick a product category. Can you profile the brand personalities of the leading brands in the category using Aaker’s brand personality inventory?
-
Pick a brand. How would you best profile consumers’ brand knowledge structures? How would you use quantitative measures?
-
Think of your brand relationships. Can you find examples of brands that fit into Fournier’s different categories?
Notes
1 Some leading textbooks in this area are J. Paul Peter and Jerry C. Olson, Consumer Behavior and Marketing Strategy, 8th ed. (Homewood, IL: McGraw-Hill/Irwin, 2007); Wayne D. Hoyer and Deborah J. MacInnis, Consumer Behavior, 5th ed. (Mason, OH: South-Western, 2010); and Michael R. Solomon, Consumer Behavior: Buying, Having, and Being, 9th ed. (Upper Saddle River, NJ: Prentice Hall, 2011).
2 John Motavalli, “Probing Consumer Minds,” Adweek, 7 December 1987, 4–8.
3 Ernest Dichter, Handbook of Consumer Motivations (New York: McGraw-Hill, 1964).
4 “Retail Therapy: How Ernest Dichter, An Acolyte of Sigmund Freud, Revolutionized Marketing,” The Economist, 17 December 2011.
5 H. Shanker Krishnan, “Characteristics of Memory Associations: A Consumer-Based Brand Equity Perspective,” International Journal of Research in Marketing (October 1996): 389–405; Geraldine R. Henderson, Dawn Iacobucci, and Bobby J. Calder, “Using Network Analysis to Understand Brands,” in Advances in Consumer Research 29, eds. Susan M. Broniarczyk and Kent Nakamoto (Valdosta, GA: Association for Consumer Research, 2002): 397–405.
6 J. Wesley Hutchinson, “Expertise and the Structure of Free Recall,” in Advances in Consumer Research 10, eds. Richard P. Bagozzi and Alice M. Tybout (Ann Arbor, MI: Association of Consumer Research, 1983): 585–589; see also Chris Janiszewski and Stijn M. J. van Osselaer, “A Connectionist Model of Brand–Quality Associations,” Journal of Marketing Research 37 (August 2000): 331–350.
7 Yvan Boivin, “A Free Response Approach to the Measurement of Brand Perceptions,” International Journal of Research in Marketing 3 (1986): 11–17; Jeffrey E. Danes, Jeffrey S. Hess, John W. Story, and Keith Vorst, “On the Validity of Measuring Brand Images by Rating Concepts and Free Associations,” Journal of Brand Management, 2012, in press.
8 Jean Bystedt, Siri Lynn, and Deborah Potts, Moderating to the Max (Ithaca, NY: Paramount Market Publishing, 2003).
9 For an application in marketing, see Kathryn A. Braun-LaTour, Michael S. LaTour, and George M. Zinkhan, “Using Childhood Memories to Gain Insight Into Brand Meaning,” Journal of Marketing 71 (April 2007): 45–60.
10 Sydney J. Levy, “Dreams, Fairy Tales, Animals, and Cars,” Psychology and Marketing 2, no. 2 (1985): 67–81.
11 Mason Haire, “Projective Techniques in Marketing Research, Journal of Marketing (April 1950): 649–656. Interestingly, a follow-up study conducted several decades later suggested that instant coffee users were no longer perceived as psychologically different from drip grind users. See Frederick E. Webster Jr. and Frederick Von Pechmann, “A Replication of the ‘Shopping List’ Study,” Journal of Marketing 34 (April 1970): 61–63.
12 Levy, “Dreams, Fairy Tales.”
13 Jeffrey Durgee and Robert Stuart, “Advertising Symbols and Brand Names That Best Represent Key Product Meanings,” Journal of Consumer Marketing 4, no. 3 (1987): 15–24.
14 Clotaire Rapaille, Culture Code (New York: Broadway, 2006); Alexandra Harrington, “G. C. Rapaille: Finding the Keys in the Cultural Unconscious,” Response TV, 1 September 2001; Jeffrey Ball, “‘But How Does It Make You Feel?’” Wall Street Journal, 3 May 1999; Jack Hitt, “Does the Smell of Coffee Brewing Remind You of Your Mother?” New York Times Magazine, 7 May 2000.
15 Gerald Zaltman and Robin Higie, “Seeing the Voice of the Customer: Metaphor-Based Advertising Research,” Journal of Advertising Research (July/August 1995): 35–51; Daniel H. Pink, “Metaphor Marketing,” Fast Company, April 1998; Gerald Zaltman, “Metaphorically Speaking,” Marketing Research (Summer 1996); www.olsonzaltman.com; Gerald Zaltman, “How Customers Think: Essential Insights into the Mind of the Market,” Harvard Business School Press (2003); Wendy Melillo, “Inside the Consumer Mind: What Neuroscience Can Tell Us About Marketing,” Adweek, 16 January 2006; Torsten Ringberg, Gaby Odekerken-Schröder, and Glenn L. Christensen, “A Cultural Models Approach to Segmenting Consumer Recovery Expectations,” Journal of Marketing 71 (July 2007): 194–214; Gerald Zaltman and Lindsay Zaltman, Marketing Metaphoria: What Deep Metaphors Reveal About the Minds of Consumers (Boston: Harvard Business School Press, 2008).
16 For some provocative research, see Carolyn Yoon, Angela H. Gutchess, Fred M. Feinberg, and Thad A. Polk, “A Functional Magnetic Resonance Imaging Study of Neural Dissociations between Brand and Person Judgments,” Journal of Consumer Research 33 (June 2006): 31–40; Samuel M. McClure, Jian Li, Damon Tomlin, Kim S. Cypert, Latané M. Montague, and P. Read Montague, “Neural Correlates of Behavioral Preference for Culturally Familiar Drinks,” Neuron 44, no. 2 (October 2004): 379–387; Hilke Plassmann, Carolyn Yoon, Fred M. Feinberg, and Baba Shiv, “Consumer Neuroscience,” in Wiley International Encyclopedia of Marketing, Volume 3: Consumer Behavior, eds. Richard P. Bagozzi and Ayalla Ruvio (West Sussex, UK: John Wiley, 2010). Martin Lindstrom, Buyology: Truth and Lies About Why We Buy (New York: Doubleday, 2008).
17 For foundational research, see Giovanna Egidi, Howard C. Nusbaum, and John T. Cacioppo, “Neuroeconomics,” in The Handbook of Consumer Psychology, eds. Curtis Haugvedt, Paul Herr, and Frank Kardes, Vol. 57 (Mahwah, NJ: Lawrence Erlbaum Associates, 2007): 1177–1214.
18 Adam Penenberg, “They Have Hacked Your Brain,” Fast Company, September 2011.
19 Tom Abate, “Coming to a Marketer Near You: Brain Scanning,” San Francisco Chronicle, 19 May 2008; Brian Sternberg, “How Coach Potatoes Watch TV Could Hold Clues for Advertisers,” Boston Globe, 6 September 2009, G1, G3.
20 Jennifer Aaker, “Dimensions of Brand Personality,” Journal of Marketing Research 34, no. 8 (1997): 347–356.
21 Jay Dean, “A Practitioner’s Perspective on Brand Equity,” in Proceedings of the Society for Consumer Psychology, eds. Wes Hutchinson and Kevin Lane Keller (Clemson, SC: CtC Press, 1994), 56–62.
22 Aaker, “Dimensions of Brand Personality.” See also Jennifer Aaker, “The Malleable Self: The Role of Self-Expression in Persuasion,” Journal of Marketing Research 36, no. 2 (1999): 45–57; Joseph T. Plummer, “Brand Personality: A Strategic Concept for Multinational Advertising,” in Marketing Educators’ Conference (New York: Young & Rubicam 1985): 1–31.
23 Jennifer L. Aaker, Veronica Benet-Martinez, and Jordi Garolera, “Consumption Symbols as Carriers of Culture: A Study of Japanese and Spanish Brand Personality Constructs,” Journal of Personality and Social Psychology 81, no. 3 (2001): 492–508.
24 Yongjun Sung and Spencer F. Tinkham, “Brand Personality Structures in the United States and Korea: Common and Culture-Specific Factors,” Journal of Consumer Psychology 15, no. 4 (2005): 334–350.
25 Gil Ereaut and Mike Imms, “‘Bricolage’: Qualitative Market Research Redefined,” Admap, December 2002, 16–18.
26 Jennifer Chang Coupland, “Invisible Brands: An Ethnography of Households and the Brands in Their Kitchen Pantries,” Journal of Consumer Research 32 (June 2005): 106–118; Mark Ritson and Richard Elliott, “The Social Uses of Advertising: An Ethnographic Study of Adolescent Advertising Audiences,” Journal of Consumer Research 26 (December 1999): 260–277.
27 Donna Kelly and Michael Gibbons, “Ethnography: The Good, the Bad, and the Ugly,” Journal of Medical Marketing 8, no. 4 (2008): 279–285; Special Issue on Ethnography, International Journal of Marketing Research 49, no. 6 (2007).
28 Melanie Wells, “New Ways to Get into Our Heads,” USA Today, 2 March 1999, B1–B2.
29 Gerry Kermouch, “Consumers in the Mist,” Business Week, 26 February 2001, 92–94; Alfred Hermida, “Bus Ride to the Future,” www.bbc.co.uk, 3 December 2001.
30 Eric J. Arnould and Amber Epp, “Deep Engagement with Consumer Experience: Listening and Learning with Qualitative Data,” in The Handbook of Marketing Research: Uses, Misuses, and Future Advances, eds. Rajiv Grover and Marco Vriens (Thousand Oaks, CA: Sage Press, 2006): 51–58.
31 Dev Patnik and Robert Becker, “Direct Observation: Some Practical Advice,” Marketing News, Fall 1999; A. Parasuraman, Dhruv Grewal, and R. Krishnan, Marketing Research, 2nd ed. (Boston: Houghton Mifflin, 2007).
32 Edward F. McQuarrie, “Taking a Road Trip,” Marketing Management 3 (Winter 1995): 9–21; Edward F. McQuarrie, Customer Visits: Building a Better Market Focus, 3rd ed. (Armonk, NY: M. E. Sharpe, 2008); “How to Conduct Good Customer Visits: 16 Tips from Ed McQuarrie,” www.managementroundtable.com.
33 Kevin Peters, “How ‘Mystery Shopping’ Helped Spark a Turnaround,” Harvard Business Review (November 2011): 47–50.
34 Gord Hotchkiss, “Exploring the Shift in Search Behaviors with Microsoft’s Jacquelyn Krones,” www.searchengineland.com, 15 July 2011.
35 Jennifer Cirillo, “DEWmocracy 2 Continues to Buzz,” Beverage World, 11 March 2010.
36 Rekha Balu, “Listen Up! (It Might Be Your Customer Talking),” Fast Company, May 2000, 304–316; Joseph Manez and Jennifer Reingold, “Burton Snowboards,” Fast Company, September 2006, 58–59; www.burton.com; Justin Gural, “Craig’s: Burton Snowboards’ Future Lab,” USA Today, 14 January 2011; Roger Brooks, “Jake Burton Charts a New Course in Snowboarding,” Success, February 2010; Russ Edelman, “Burton Snowboards: Passion, Innovation and Profit,” www.cnbc.com, 22 November 2011.
37 Russell W. Belk and Robert V. Kozinets, “Videography in Marketing and Consumer Research,” Qualitative Market Research 8, no. 2 (2005): 128–142.
38 Louella Miles, “Market Research: Living Their Lives,” www.brandrepublic.com, 11 December 2003.
39 Judith A. Howard and Daniel G. Renfrow, “Social Cognition,” in Handbook of Social Psychology, ed. John Delamater (New York: Springer Science+Business, 2006), 259–282; Robert S. Wyer, “The Role of Information Accessibility in Cognition and Behavior: Implications for Consumer Information Processing,” in The Handbook of Consumer Psychology, eds. Curtis Haugvedt, Paul Herr, and Frank Kardes, Vol. 57 (Mahwah, NJ: Lawrence Erlbaum Associates, 2007), 31–76; Barbara Loken, Larry Barsalou, and Christopher Joiner, “Categorization Theory and Research in Consumer Psychology: Category Representation and Category-Based Inference,” in The Handbook of Consumer Psychology, eds. Curtis Haugvedt, Paul Herr, and Frank Kardes, Vol. 57 (Mahwah, NJ: Lawrence Erlbaum Associates, 2007), 453–485.
40 For an interesting related topic, see Henrik Hagtvedt, “The Impact of Incomplete Typeface Logos on Perceptions of the Firm,” Journal of Marketing 75 (July 2011): 86–93.
41 Raymond Gordon, “Phantom Products,” Forbes, 21 May 1984, 202–204.
42 Philip Kotler and Kevin Lane Keller, Marketing Management: Analysis, Planning, Implementation, and Control, 14th ed. (Upper Saddle River, NJ: Prentice Hall, 2012).
43 Joseph F. Hair Jr., Rolph E. Anderson, Ronald Tatham, and William C. Black, Multivariate Data Analysis, 4th ed. (Englewood Cliffs, NJ: Prentice Hall, 1995); James Lattin, Douglas Carrol, and Paul Green, Analyzing Multivariate Data, 5th ed. (Pacific Grove, CA: Duxbury Press, 2003).
44 J. Scott Armstrong, Vicki G. Morwitz, and V. Kumar, “Sales Forecasts for Existing Consumer Products and Services: Do Purchase Intentions Contribute to Accuracy?” International Journal of Forecasting 16 (2000): 383–397.
45 Icek Ajzen and Martin Fishbein, Understanding Attitudes and Predicting Social Behavior (Englewood Cliffs, NJ: Prentice Hall, 1980); Vicki G. Morwitz, Joel Steckel, and Alok Gupta, “When Do Purchase Intentions Predict Sales?,” International Journal of Forecasting 23, no. 3, (2007): 347–364; Pierre Chandon, Vicki G. Morwitz, and Werner J. Reinartz, “Do Intentions Really Predict Behavior? Self-Generated Validity Effects in Survey Research,” Journal of Marketing 69 (April 2005): 1–14.
46 Fred Reichheld, Ultimate Question: For Driving Good Profits and True Growth (Cambridge, MA: Harvard Business School Press, 2006); Jena McGregor, “Would You Recommend Us?” BusinessWeek, 30 January 2006, 94–95; Kathryn Kranhold, “Client-Satisfaction Tool Takes Root,” Wall Street Journal, 10 July 2006; Timothy L. Keiningham, Bruce Cooil, Tor Wallin Andreassen, and Lerzan Aksoy, “A Longitudinal Examination of Net Promoter and Firm Revenue Growth,” Journal of Marketing 71 (July 2007): 39–51; Neil A. Morgan and Lopo Leotte Rego, “The Value of Different Customer Satisfaction and Loyalty Metrics in Predicting Business Performance,” Marketing Science 25 (September–October 2006): 426–439; Timothy L. Keiningham, Lerzan Aksoy, Bruce Cooil, and Tor W. Andreassen, “Linking Customer Loyalty to Growth,” MIT Sloan Management Review (Summer 2008): 51–57.
47 Das Narayandas, “Building Loyalty in Business Markets,” Harvard Business Review (September 2005): 131–138.
48 For more general discussion of consumer attachment, see Susan S. Kleine and Stacy M. Baker, “An Integrative Review of Material Possession Attachment,” Academy of Marketing Science Review 8, no. 4 (2004): 1–39; Rosellina Ferraro, Jennifer Edson Escalas, and James R. Bettman, “Our Possessions, Our Selves: Domains of Self-Worth and the Possession-Self Link,” Journal of Consumer Psychology 21, no. 2 (2011): 169–177.
49 See, for example, Lars Bergkvist and Tino Bech-Larsen, “Two Studies of Consequences and Actionable Antecedents of Brand Love,” Journal of Brand Management 17 (June 2010): 504–518.
50 Barbara A. Carroll and Aaron C. Ahuvia, “Some Antecedents and Outcomes of Brand Love,” Marketing Letters 17 (2006): 79–89.
51 Rajeev Batra, Aaron Ahuvia, and Richard P Bagozzi, “Brand Love,” Journal of Marketing (2012), in press.
52 C.W. Park, Deborah J. Macinnis, Joseph Priester, Andreas B. Eisingerich, and Dawn Iacobucci, “Brand Attachment and Brand Attitude Strength: Conceptual and Empirical Differentiation of Two Critical Brand Equity Drivers,” Journal of Marketing 74 (November 2010): 1–17.
53 Vikas Mittal and Mohanbir S. Sawhney, “Managing Customer Retention in the Attention Economy,” working paper, University of Pittsburgh, 2001.
54 For a broad overview, see “Digital Marketing: Special Advertising Section,” Adweek, 28 October 2011.
55 Jon Bruner, “What’s a ‘Like’ Worth?,” Forbes, 8 August 2011; Brian Morrisey, “Value of a ‘Fan’ on Social Media: $3.60,” Adweek, 13 April 2010; www.vitrue. com, accessed 23 June 2011.
56 Susan M. Fournier, “Consumers and Their Brands: Developing Relationship Theory in Consumer Research,” Journal of Consumer Research 24 (March 1998): 343–373; Susan M. Fournier, Susan Dobscha, and David G. Mick, “Preventing the Premature Death of Relationship Marketing,” Harvard Business Review (January–February 1998): 42–51; Susan M. Fournier and Julie L. Yao, “Reviving Brand Loyalty: A Reconceptualization Within the Framework of Consumer–Brand Relationships,” International Journal of Research in Marketing 14 (1997): 451–472; Susan Fournier, “Lessons Learned About Consumers’ Relationships with Their Brands,” in Handbook of Brand Relationships, eds. Joseph Priester, Deborah MacInnis, and C. W. Park (NY: Society for Consumer Psychology and M.E. Sharp, 2009), 5–23; Susan Fournier, Michael Breazeale, Marc Fetscherin, and T. C. Melewar, eds., Consumer–Brand Relationships: Theory and Practice (London: Routledge Taylor & Francis Group, 2012).
57 For a helpful review of different perspectives, see Jonathan Knowles, “In Search of a Reliable Measure of Brand Equity,” MarketingNPV 2, no. 3 (July 2005).
58 This section greatly benefited from helpful and insightful contributions by Ed Lebar, John Gerzama, Scott Stiff, and Paul Fox.