
3. The Balance Sheet: If Your People Are Your Most Important Asset, Where Do They Show Up on the Balance Sheet?
If you want to calculate your personal net worth, you subtract from the value of everything you own the value of everything you owe. No matter how complex a corporation may be, its balance sheet is nothing more than that, a list of everything the company owns (assets) minus the list of everything the company owes (liabilities). Although you could describe the difference between these two quantities as a corporation’s net worth, the standard accounting terminology for the excess of assets over liabilities is owners’ equity or shareholders’ equity. A corporation with assets of $5 billion and liabilities of $3 billion would calculate its shareholders’ equity as $2 billion (5 – 3 = 2). Just as you might assess your personal financial health by comparing the value of what you own to the value of what you owe, you can assess the financial condition of a corporation by comparing the value of its assets to the value of its liabilities. When you assess a corporation’s financial condition, you seek to determine whether it has the financial strength to ride out difficult economic times should it encounter them. On the flipside, you are also interested in whether it has the financial strength to take advantage of any attractive growth opportunities. Balance sheets are sometimes described as a snapshot in that they show what the company owned and what it owed on a specific date, the last day of the reporting period. The balance sheet excerpts in Exhibits 3-1 and 3-2 show Home Depot’s assets and liabilities as of January 30, 2012, which was the last day of its 2011 fiscal year. By contrast, an income statement does not refer to a specific date but to an interval of time. Home Depot’s 2011 income statement (refer to Exhibit 2-1) reports the company’s revenues and expenses over the 12-month period ending on January 30, 2012.
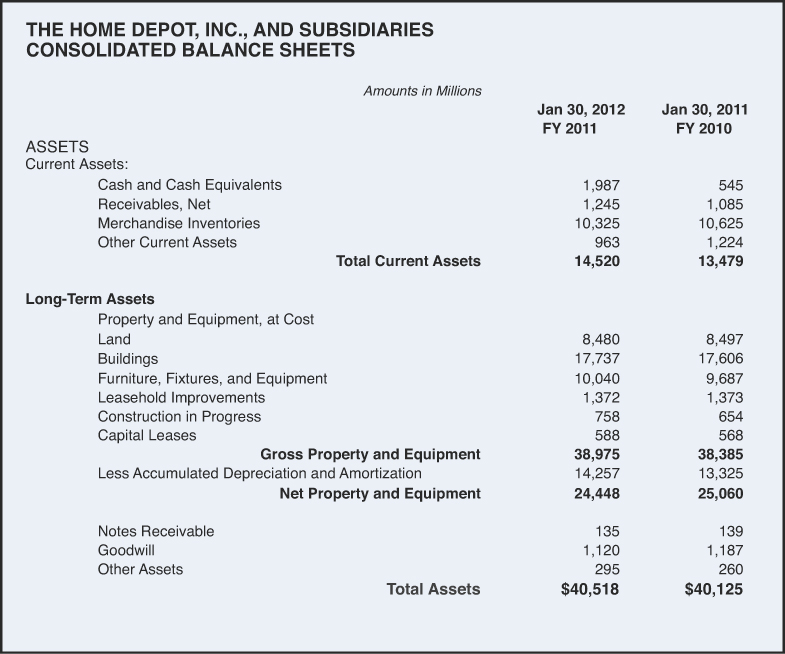
Exhibit 3-1. Assets section of Home Depot’s balance sheet
Source: Form 10-K filed with U.S. Securities Exchange Commission on 3/22/2012, page 31.
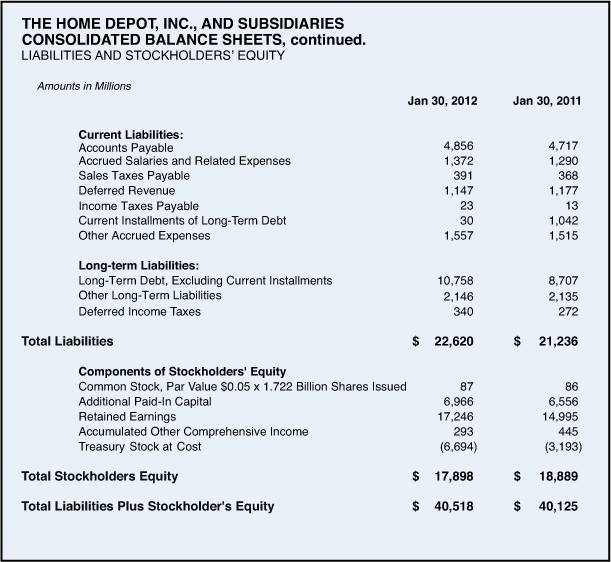
Exhibit 3-2. Liabilities and equity section of Home Depot balance sheet
Source: Form 10-K filed with U.S. Securities Exchange Commission on 3/22/2012, page 31.
Assets on the Balance Sheet
The balance sheet balances because of simple arithmetic. Assets are usually listed on the left side (or top) of the balance sheet, and liabilities and shareholders’ equity on the right side (or bottom). Because shareholders’ equity is calculated by subtracting liabilities from assets (in the previous example 5 – 3 = 2), assets on the left side always equal the sum of liabilities and shareholders’ equity on the right side (5 = 3 + 2). The assets listed in Exhibit 3-1 are divided into two groups: Current Assets and Long-Term Assets. Current assets are assets that the company expects to convert into cash, sell, or consume within 1 year of the balance sheet date.1 Current assets are presented in the order of liquidity, that is, the speed with which they can be converted to cash. The typical sequence is cash, temporary investments, accounts receivable, inventory, supplies, and prepaid expenses. Then long-term assets are shown at their original purchase price minus accumulated depreciation. A few of these items may warrant some additional explanation.
Accounts Receivable
The income statement shows that Home Depot’s sales in fy2011 were $70.395 billion (refer back to Exhibit 2-1). Some of those sales were credit sales, and not all that money was collected by the end of the year. The amount remaining uncollected was added to the accounts receivables balance in the current assets section of Home Depot’s balance sheet in Exhibit 3-1. Receivables increased by $160 million between January 30, 2011 and January 30, 2012. That tells you that the amount Home Depot collected from sales in fy2011 was $70.235 billion ($70.395 billion in sales minus the $160 million that was uncollected as of January 30, 2012).
Accounts Receivable Turnover Ratio
Dividing annual sales revenue from the top line of the income statement by the accounts receivable balance yields a measure known as an accounts receivable turnover ratio ($70.395 billion / $1.25 billion = 56.5). Dividing this ratio into 52 weeks gives the average sales collection period in weeks (52 / 56.5 = 0.92 weeks). Home Depot’s average collection period of less than 1 week is obviously much shorter than the collection period you might observe in other types of businesses. Remember this is an average with many sales paid for at the time of purchase, whereas others are credit sales that may take much longer than 1 week to collect. Tracking the average collection period from year to year should provide an early indication if a firm is beginning to have difficulty collecting from its customers.
Inventories
To be conservative, inventories are shown on a company’s balance sheet at the company’s cost of acquiring that merchandise or the current market value of that merchandise, whichever is smaller. Determining a company’s cost of acquiring (purchasing or manufacturing) the merchandise in inventory is not always straightforward. Home Depot uses the first-in, first-out (FIFO) method of calculating its inventory costs. For example, suppose it buys 5,000 hammers at $7.00 each and later another 3,000 identical hammers at $8.00 each. It then sells 6,000 of these hammers at $10.00 each. All the hammers are identical, so it makes no difference whether when stocking the shelves the warehouse employee grabs a box from the first shipment or from the second shipment. The question is just whether the first hammers sold will be treated for accounting purposes as having been purchased at the $7.00 price or the $8.00 price. Because Home Depot uses the FIFO method, for purposes of the income statement they would treat the first 5,000 sold (the first out of inventory) as having the first cost of $7.00 each. The next 1,000 that were sold would be treated as having a cost of $8.00 each. The 2,000 that were not sold would be included in the inventory section of the balance sheet at $8.00 each.
If Home Depot had instead opted to use the last-in, first-out (LIFO) method of inventory accounting, it would have treated the first 3,000 sold (the first out) as having a cost of $8.00 each (the last cost) and the next 3,000 as having a cost of $7.00 each. The 2,000 remaining in inventory would be valued at $7.00 each. The important point here is that in both cases the business reality is exactly the same. In both scenarios 8,000 hammers were purchased at an average price of $7.38 each, and 6,000 were sold at $10.00 each. Nevertheless, opting to use the FIFO instead of the LIFO accounting method would make the reported profits higher and the reported inventory values lower. With the FIFO method the cost of goods sold subtracted out on the income statement would be $43,000 (5,000 at $7 plus 1,000 at $8). With the LIFO accounting choice, the cost of goods sold subtracted out on the income statement would be $45,000 (3,000 at $8 and 3,000 at $7). Obviously, subtracting a smaller cost of goods sold on the income statement increases reported profits. Remember that true profits, at least at the pretax level, are unaffected by this accounting choice. Why would a company elect the LIFO accounting option which, during periods of rising prices, lowers reported profits? They might select LIFO precisely because lower taxable profits mean lower tax payments. The choice between LIFO and FIFO is more significant during periods of rapid inflation. If in this example the price per hammer had been the same in both the first and second purchases, the choice of FIFO versus LIFO would have no effect. With today’s computerized inventory control systems, it is often possible to at all times know the exact cost of the items currently in inventory. That makes it possible to avoid both LIFO and FIFO and use an average cost method for inventory costing. Home Depot, however, like most companies chooses to stay with one of the more traditional methods of inventory costing.
Inventory Turnover Ratio
Dividing the Cost of Goods Sold expense from Home Depot’s income statement by the value of inventories shown on its balance sheet yields a measure known as an inventory turnover ratio ($46.133 billion / $10.325 billion = 4.47). Dividing this ratio into 52 weeks gives the average inventory holding period in weeks (52 / 4.47 = 11.6 weeks). Home Depot turns its inventory over 4.47 times a year compared to only 3.93 times a year at Lowe’s. This is another area where Home Depot’s performance is stronger. A key goal of modern supply chain management techniques and Just-in-Time (JiT) inventory practices is reducing the amount of capital tied up in inventory. Of course, if inventories become too lean, there is a risk of losing sales because some products may not be available for immediate delivery.
Property, Plant, and Equipment
The long-term assets section of the balance sheet lists the firm’s property, plant, and equipment at the original purchase price and then subtracts the accumulated depreciation to determine the net (or book) value of these assets. Suppose Home Depot were to buy for $50,000 a delivery truck that has an estimated useful life of 5 years. Allocating this cost over 5 years using straight-line depreciation would result in a $10,000 ($50,000 / 5) depreciation expense subtracted on the income statement in each of those years. Regardless of its market value, at the end 1 year, this truck would be shown on the company’s balance sheet as having a value of $40,000 (original purchase price of $50,000 minus accumulated depreciation of $10,000). At the end of year 2, this truck would be shown on the company’s balance sheet as having a value of $30,000 (original purchase price of $50,000 minus accumulated depreciation of 2 times $10,000). At the end of year 5, even if this truck were in good condition and fully operable, it would be shown on the company’s balance sheet as having a value of zero (original purchase price of $50,000 minus the accumulated depreciation of 5 times $10,000). You never depreciate more than 100% of an asset’s original cost. So even if this truck remained in use in year 6 and beyond, there would be no additional depreciation expense for this truck on the company’s income statement.
Home Depot’s balance sheet (refer to Exhibit 3-1) shows that the total originally paid for its property, plant, and equipment was $38.975 billion. This quantity is sometimes referred to a gross property plant and equipment. Subtracting the accumulated depreciation, the amount that has already been expensed on the current and previous income statements, yields the $24.448 billion net (or book value) of these long-term assets. Home Depot lists seven categories of property and equipment. Most of the labels are straightforward. Leasehold improvements are just alterations it made to property Home Depot leases from others. Capital leases are a long-term lease that are so similar to purchasing an asset that for accounting purposes they are reported as if the asset had been purchased. For example, a lease would be treated as a purchase if the lease covers 75% or more of the asset’s useful life or if the present value2 of the lease payments is greater than 90% of the asset’s market value.
Goodwill
Also shown in the assets section of Home Depot’s balance sheet are long-term notes receivable and goodwill. Whenever goodwill appears on a balance sheet, it indicates that there has been an acquisition and that the price paid was greater than the fair market value of net assets acquired. Paying a price greater than the value of the assets acquired does not necessarily mean you have paid a price greater than the value of the on-going firm containing those assets. For example, during fy2006 Home Depot made a number of acquisitions at a total cost of $4.5 billion. The cash and other identifiable assets acquired through those acquisitions, minus the liabilities assumed along with those acquisitions, had an estimated fair market value of $1.5 billion. When Home Depot consolidated these acquisitions into its balance sheet, it recorded these assets and liabilities with a net value of $1.5 billion and an additional “plug number” of $3 billion labeled goodwill. The sum of the $1.5 billion in net assets and the $3 billion in goodwill, therefore, balanced the $4.5 billion that was paid to acquire these firms.
The term goodwill sounds like you are paying for the good feelings customers and others may have about a firm being acquired. That, however, is not the case, and many firms are abandoning the goodwill label and replacing it with more precise language like “excess of purchase price over fair value of assets acquired.” There are many reasons why a firm might be worth more than the fair market value of its net assets. One reason that should be obvious to HR managers is the value of a firm’s workforce. What is required in dollars and time to recruit, select, and develop one top executive (or one executive secretary, or one engineer, or one sales rep, or one highly competent employee in any position)? Given the magnitude of those HR costs, a successful corporation with all its employees in place is obviously worth far more than it would be with same net assets but none of those employees in place. Examples of other factors that may add value beyond the sum of a corporation’s net assets are market position, brand recognition, customer loyalty, first-mover advantage, and strategic fit with the acquiring firm.
Companies no longer amortize (write down the value of) goodwill over a specified number of years. Instead goodwill remains as an asset on the balance sheet until the company has evidence that its value has decreased. Home Depot’s 2011 balance sheet (refer to Exhibit 3-1) shows goodwill valued at more than $1.1 billion. When there is evidence that the value of goodwill has declined, a goodwill impairment charge is subtracted on the income statement, and the value of the goodwill asset shown on the balance sheet is reduced. (The value of goodwill is usually written down when there is a significant decrease in the present value of expected future cash flows from the acquired asset. The logic behind and techniques for calculating the present value of future cash flows is discussed in Chapter 7, “Capital Budgeting and Discounted Cash Flow Analysis.”)
Liabilities on the Balance Sheet
The section of the Home Depot balance sheet reproduced in Exhibit 3-2 shows total liabilities as of January 30, 2012 of $22.62 billion. Of this amount $9.38 billion are current liabilities that must be paid within the upcoming 12 months. The balance of $13.24 billion consists of long-term liabilities that will not come due within the next 12 months. If a firm has a 20-year mortgage, 1 year of it is shown as a current liability, and the other 19 years as a long-term liability. The current liabilities section of Home Depot’s balance sheet shows $30 million as the near-term installments associated with long-term debt. Most of the labels in the liabilities section of this balance sheet are straightforward, with the possible exceptions of deferred revenue and deferred income taxes. Deferred revenue is money received for goods or services that have not yet been delivered. Under the accrual accounting methodology, these funds are included in cash on the assets side of the balance sheet, and a corresponding liability is recorded until delivery is made, at which time it is converted into revenue on the income statement. Deferred income tax entries indicate that there has been a difference between the accounting treatment and the tax treatment of some item of income or expense. A deferred income tax entry may appear on either the asset side or the liabilities side of the balance sheet. A deferred tax asset indicates this difference will result in a future tax savings. A deferred tax liability indicates that this difference will result in an increase in the firm’s future tax obligations. For example, income already earned and recognized for accounting but not tax purposes creates a tax liability. You must pay taxes on that income in a future year.
Stockholders’ Equity on the Balance Sheet
As of June 30, 2012, Home Depot had assets totaling $40.518 billion and liabilities totaling $22.620 billion. Subtracting from the sum of everything Home Depot owned the sum of everything Home Depot owed, yields a shareholders’ equity of $17.898 billion (40.518 – 22.620). That is the amount that would be left if all assets were sold at their book value and all liabilities were paid off at their book value. Paying off all liabilities at their book value is certainly possible if you have the cash to do that. Selling all assets at their book value is extremely unlikely. Assets, particularly long-term assets, may have a market value quite different from their book value. For example, a building constructed 20 years ago for $300,000 and depreciated straight line over 30 years will have a book value of $100,000 ($300,000 original purchase price minus 20 years of depreciation at $10,000 per year). The cost to replace that building in today’s market could easily be $400,000 or more. In that example, the current market value is more than four times the book value. The book value of shareholders equity is therefore seldom the price you would pay to acquire a corporation. The assets on the balance sheet may have a book value that is quite different from the market value, and the balance sheet value does not include intangibles like brand value or the talent of the company’s management and workforce.
The Capital Invested Component of Stockholders Equity
Current stockholders’ equity is what the stockholders originally invested in the business plus any profits that were earned and retained in the business. The Home Depot balance sheet shows the components of its shareholders’ equity. As of January 30, 2012, 1.722 billion shares of Home Depot stock had been issued. The individuals purchasing those shares paid Home Depot $7.053 billion. On the balance sheet this $7.053 billion is disaggregated into $87 million, which reflects the $0.05 par value of each share issued and $6,966 billion in additional paid-in capital. That disaggregation adds very little useful information for most readers of a balance sheet. The $0.05 a share par value is an arbitrary number chosen by the lawyers and accountants who structured the stock offering. When these shares were issued, they were not sold for 5 cents each but for as much as the market would pay. Dividing $7.053 billion by 1.722 billion shares tells you that the average price paid when the company originally sold these shares was $4.10 per share. This number, of course, has little relationship, if any, to what those shares sell for in today’s market. On January 30, 2012, Home Depot stock was selling for just under $45 a share. Fluctuations in the current market price of its stock price generally have no impact on Home Depot’s income statement or on the value of shareholder’s equity shown on its balance sheet. The current market price is what individuals external to Home Depot agree to when buying and selling stock to each other. Current stock prices impact a company’s financial statements only in years when the company chooses to issue new shares or buy back shares that are currently outstanding.
The Retained Earning Component of Stockholders Equity
There are only two possibilities for what a company can do with its net profits. It can distribute them to shareholders as dividends or retain them within the corporation to support its future operations. The stockholders equity section of Home Depot’s January 30, 2012 balance sheet shows that out of the profits the company earned in the years since its incorporation $17.246 billion was retained to grow the business. The balance of its net profits was distributed as dividends.
Other Comprehensive Income
The Home Depot balance sheet also shows $293 million of Accumulated Other Comprehensive Income. Other comprehensive income includes changes in the value of certain assets or liabilities before these changes are recognized on the income statement. These assets are not usually assets like buildings or land, but instead are securities, derivative contracts, pension liabilities, and foreign operation assets. An example would be unrealized gains or losses on securities or derivatives held by Home Depot. These changes will eventually be recognized on the income statement when the security is sold or the derivative position is closed. In the meantime the security is shown at its increased value in the assets section of the balance sheet. This increases the value of total assets and therefore the value of stockholders equity. The other comprehensive income category shows the source of this increase in stockholder equity.
Treasury Stock
The last entry on the Home Depot balance sheet is labeled Treasury stock. These are shares of the company’s own stock that Home Depot has purchased in the external market. Why would a company buy shares of its own stock? Sometimes these shares are acquired for re-issuance through stock-based employee compensation plans. Buying back shares in the open market prevents the dilution that would occur if the company issued new stock to support these compensation needs. Companies may also buy back stock because they feel that their stock is undervalued in the open market. During 2011, Home Depot announced plans to buy back $3.5 billion of its outstanding shares. This was in addition to substantial share repurchases in earlier years. As of January 30, 2012 Home Depot had spent $6.696 billion to repurchase its own stock. The amount paid to purchase these shares is subtracted from stockholders’ equity. Owning shares of its own stock cannot make a company more valuable. It can, however, make each outstanding share more valuable because the company’s value is divided among a smaller number of shares outstanding.
Which Numbers on a Balance Sheet Can You Believe?
Assuming a complete absence of fraud and that all entries were prepared in a manner consistent with generally accepted accounting principles (GAAP), can you have equal confidence in all the numbers in a balance sheet? The answer is usually “no.” The cash amounts shown should be exact. The liabilities listed should also be precise because the firm and its creditors have written contracts specifying exactly how much is owed. You need to be a bit more cautious, however, when looking at the noncash current assets. The accounts receivable number shown is net of an allowance for accounts that may never be collected. Such bad debt allowances are based on historical experience, but as always history is no guarantee of what the future will bring. For example, a significant percentage of Home Depot’s customers are professional contractors. It’s certainly possible that the percentage of contractors paying their debts in a timely manner might decline during a prolonged housing recession. Inventory is shown on a balance sheet at the lower of its cost or its current market value. However, firms may vary considerably in the speed and aggressiveness with which inventory is written down in response to a decline in its market value.
Book Value Versus Market Value of Long-Term Assets
You need to be most cautious when basing decisions on the balance sheet valuations of long-term assets. The book value of long-term assets, the original purchase price minus accumulated depreciation, can be a millions of dollars above or below the market value of those assets. A building constructed 15 years ago for $3 million and now shown on a firm’s balance sheet at a depreciated value of $1.5 million could easily have a replacement cost of $5 million. It’s also possible for market values to be well below book values. Both U.S. and International Financial Reporting Standards (IFRS) do require that assets be written down when their economic value to a firm declines. That doesn’t mean you don’t need to be cautious. Consider the case of a steel mill3 that was operating with outdated technology at a time when there was excess capacity in the global steel industry. As is standard for an on-going concern, this steel mill was shown on the parent company’s balance sheet at its original construction cost minus accumulated depreciation. When the parent company decided to discontinue operations at this location, there were no buyers willing to purchase this mill for even one-half of its book value.
If the Asset Value Is Imprecise, so Is the Equity Value
Remember that equity is just assets minus liabilities. If in a firm with $3 million in liabilities, the book value of assets is $8 million, the book value of equity will be $5 million. If the book value of assets overstates (understates) its market value by $2 million, the balance sheet value of the equity would also be overstated (understated) by $2 million. It’s important to keep those caveats in mind when using financial performance measures such as return on assets (net income / assets) and return on equity (net income / equity). You usually focus on changes in the numerator of those ratios, but those ratios are equally affected by the validity of the numbers in the denominator.
What Can a Balance Sheet Tell You About a Company’s Financial Condition?
To assess your personal financial condition, you might begin by calculating your net worth. To do that you would subtract from the sum of everything you own, the sum of everything you owe. If the amount you owe is large compared to your net worth, you probably have cause for concern. In that situation, you would certainly find it more difficult to obtain a mortgage or a car loan. You can apply exactly the same logic to a corporate balance sheet. You can subtract from the sum of everything Home Depot owns (assets of $40.518 billion) the sum of everything Home Depot owes (liabilities of $22.620 billion) to obtain Home Depot’s net worth (shareholder’s equity of $17.898 billion). Dividing total liabilities by the shareholders equity ($22.620 billion / $17.898) reveals that Home Depot’s debt to equity ratio is 1.26. Home Depot uses $1.26 in borrowed money for every $1.00 of shareholders’ equity. The debt-to-equity ratio is a measure of financial leverage. A firm is said to be more highly leveraged if it increases the percentage of its assets that are financed through borrowing. Home Depot’s debt equity ratio of 1.26 in January 2012 is up from 1.11 in January 2010. An increasing debt equity ratio can signal a problem with a firm’s business operations. However, in this case it appears that Home Depot’s leverage was increasing not because of operating problems but because of an intentional shift in its financial strategy. During 2011, the company borrowed $2 billion through the sale of 10-year and 30-year bonds.4 Those funds were used to pay off $1 billion of bonds originally issued in 2006 that matured in 2011. The balance was used by Home Depot to buy back shares of its own stock. Home Depot was intentionally increasing its debt/equity ratio based on the expectation that borrowing long term at low rates would enable the company to generate even larger increases in shareholder value.
Any debt-to-equity ratio more than 1.0 indicates that the company is relying more heavily on borrowed money than on the owner’s money. For small or struggling firms, a ratio above 1.0 can lead to serious problems. But for large, well-established firms, like Home Depot, a debt equity ratio of 1.26 is not a large amount of leverage. By comparison, the ratio of liabilities to equity on IBM’s January 2012 balance sheet was 4.75.5 Like Home Depot, IBM was taking advantage of historically low interest rates to borrow funds and use them to repurchase its own shares.
Use Caution When Using Published Financial Ratios
To properly interpret the level of any financial ratio, you must compare it to the level of that ratio in that firm in earlier years and to the value of that ratio in other firms with a similar product/industrial mix. For companies whose stock is publicly traded, numerous financial ratios can be obtained at no cost from MSN Money, Yahoo Finance, Google Finance, and many other Internet sites. For instance, the MSN money site provides six ratios related to financial condition, six related to profit margins, six related to return on investment, six related to operational efficiency, and six related to stock price. There are no accounting standards that specify how these financial ratios should be defined. Managers, investors, or financial analysts may calculate a ratio in the manner they believe is most relevant for their purposes. When utilizing financial ratios calculated by others, it is therefore critical that you know the definitions that were used. For example, the Home Depot leverage ratio calculated in the previous section was 1.26. The measure used was debt to equity. The MSN Money site reports a different leverage ratio for Home Depot of 2.3. The measure used was assets to equity. These are just two different ways to say exactly the same thing. If Home Depot has $1.26 in debt for $1.00 of equity, it has $2.26 in assets for every $1.00 of equity ($1.00 of equity + $1.26 of debt = $2.26 in total assets). MSN Money divided the $2.26 in total assets by the $1.00 of equity to get a ratio of 2.26, which it rounded to 2.3. It is also common to see published debt/equity ratios calculated with long-term debt, not total liabilities, in the numerator. Unfortunately, it’s not always easy as it should be to find a clear statement of the definitions used to calculate published ratios. You may sometimes need to go back to the original financial statements and replicate the calculations to be sure a published ratio is what you think it is.
Ratio of Current Assets to Current Liabilities
A ratio called the Current Ratio is often used to assess the short-run implications of a company’s debt. It is usually defined as current assets divided by current liabilities. Dividing Home Depot’s current assets of $14.520 billion by its current liabilities of $9.376 billion yields a current ratio of 1.54. A ratio of 1.54 suggests that during the upcoming year Home Depot will have $1.54 in current assets to pay off for every $1.00 of current liabilities. A current ratio close to or below 1.0 can be a flag that a company may have difficulty raising the cash to cover its short-term debts. A variation that provides an even more stringent test of a firm’s capability to make the payments on its short-term obligations is the acid test ratio. It is defined the same way as the current ratio but excludes from the current assets measure in the numerator the value of less liquid items such as inventories and prepaid expenses. There is no guarantee that all the merchandise in inventory will be sold, and prepaid expenses (for example, rent or insurance paid for in advance) are not assets that can be converted into cash. Calculating this ratio using Home Depot’s January 2012 balance sheet ([$14.520 billion in current assets – $10.325 billion in inventory] / $9.376 billion of liabilities) yields a value of 0.45, that is, only $0.45 in liquid assets available to cover each $1.00 of short term debt. That would be cause for serious concern if you believed Home Depot would be unable to convert most of its $10 billion of inventory into cash. Because there is no reason to believe that, the acid test in this case is not a particularly useful measure. It might however be a critically important tool if you were evaluating the balance sheet of, say, a cell phone manufacturer that had a large inventory of phones that consumers were rejecting in favor of the latest-and-greatest release from one of its competitors.
Financial Leverage Can Increase the Shareholders’ Return on Investment
The previous section discussed using a debt equity ratio to assess the amount of financial leverage reflected on a firm’s balance sheet. Why do almost all firms have debt on their balance sheet? It’s not because they couldn’t raise all the money needed by selling stock. It’s because they believe that by borrowing a portion of the amount needed they can provide their shareholders with a greater rate of return on their investment. Exhibit 3-3 illustrates how this can be achieved. A common measure of the rate of return earned by the shareholders is Return on Equity (ROE), calculated by dividing Net Income from the bottom line of the income statement by Shareholders Equity from the balance sheet. The top panel illustrates the effect of leverage under the assumption that management can earn an operating profit of 10% on every dollar of assets they have to work with. If this company’s $500 million in assets had been paid for with funds raised through the sale of stock, its EBIT would be $50 million and its net income $35 million. That $35 million divided by the shareholders’ investment of $500 million would have been a return on equity of 7%. Now suppose only $100 million of that $500 million in assets had been financed through the sale of stock and that the balance, $400 million, was money borrowed from a bank or by selling bonds. If the average interest rate on the debt was 5%, the firm must pay 20 million in interest, reducing its net income to $21 million. However, because the shareholders had invested only $100 million, that $21 million net income represents a 21% return on the equity. In this case the use of substantial financial leverage tripled the shareholders’ rate of return on their investment. Would you rather earn a 7% return or a 21% return on the funds in your 401K? You would jump at the chance to earn 21% unless you thought that investment was too risky. Does using financial leverage make a firm more risky?

Exhibit 3-3. Impact of leverage on return on equity
Financial Leverage Can Reduce the Shareholders’ Return on Investment
To see how financial leverage can reduce the return to shareholders, refer to the bottom panel of Exhibit 3-3. Suppose the business described in this exhibit were a Home Depot retail outlet, and Lowe’s had just opened a new store one block away, and that the new Lowe’s store reduces Home Depot’s profit by cutting into its market share. This Home Depot outlet is still profitable but now earns an operating profit equal to 2% of assets utilized instead of the previous 10%. Referring to the bottom panel of Exhibit 3-3, you can see if this firm had no debt, its net income would be $7 million and its return on equity would be 1.4%. On the other hand, if this firm had $400 million in debt, its net income, actually a net loss, would be –$10 million. Under this scenario, the effect of financial leverage was to reduce the return on equity from +1.4% to –10%. So when is leverage helpful, and when is it harmful? Simply, it is helpful when you can earn more on a borrowed dollar than it costs you to borrow it. Exhibit 3-3 shows the average interest rate was 5%. When the firm earned 10% on each dollar of assets, the use of leverage was highly beneficial. When the firm earned only 2% on each dollar of assets, the use of leverage was detrimental. The more highly leveraged a firm is, the larger these positive and negative effects can be. Leverage can magnify a good year into a great year. It can also transform a mediocre year into a disastrous year. Highly leveraged firms are generally considered to be riskier because the effect of leverage is to take whatever volatility there is in business operations and magnify that into even greater swings in bottom-line profit and return on equity.
An Alternative Calculation of Return on Equity
The return on equity measure used in the previous example was calculated by dividing net income by the book value, that is, the balance sheet value, of shareholders equity. It is certainly possible that the stock market value of shareholders equity could be above or below the value of shareholders equity shown on the balance sheet. The stock market value of shareholders equity, the company’s market capitalization, is the dollar value of all shares currently outstanding. It is calculated by multiplying the number of shares outstanding by the current price per share. For example, if there are 10 million shares of XYZ Company’s stock outstanding and XYZ stock is trading at $50 per share, the market capitalization of XYZ is $500 million. Some analysts prefer to calculate return on equity as net income divided by market value of equity, instead of as net income divided by the balance sheet value of equity. Using the market value of equity avoids needing to rely on accounting statements that may not reflect the true replacement cost of a firm’s assets and may completely omit the value of workforce quality and other intangible assets. Of course, using the market value of equity has a different set of problems. This number can be highly volatile and influenced by stock market conditions and other external factors unrelated to the firm’s performance.