6. Stocks, Bonds, and the Weighted Average Cost of Capital
Why Is the Cost of Capital Important to HR Managers?
No business strategy and no HR strategy can create value for the firm unless it generates a return on investment greater than the firm’s cost of capital. For that reason it is critical to understand what determines a firm’s cost of capital and the implications of the cost of capital for all strategic and operating decisions made by the firm. The basic concept is a simple one. For example, suppose you want to open a restaurant where you can show off your skills as a chef and make enough money to support your family. To get this business started, you need $500,000, all of which you borrow from your brother-in-law at 8%. Your cost of capital is 8%, and each year you must pay your brother-in-law $40,000 in interest. Unless the operating profit from your restaurant is greater than $40,000 per year, you may show off your culinary skills, but you won’t be generating any economic value for yourself and your family. In this example, 8% is the minimum return you must earn on the $500,000 invested in this restaurant if your business is to be successful. A firm’s cost of capital is the minimum rate of return it must it must generate through its business operations to cover the cost of raising the money used to acquire the assets invested in those operations.
Where Does the Money Come From?
The example in the previous paragraph is an unrealistic one in that 100% of the funds came from borrowing. Most corporations are financed through a combination of equity and debt. Equity financing refers to funds raised through the sale of stock. This can be common stock or preferred stock. Each share of common stock represents an ownership interest in the corporation. Owners of common stock typically have the right to vote for members of the Board of Directors and on other corporate issues. Common stockholders have the right to receive dividends in proportion to their ownership interest. For example, if you own 3% of the outstanding stock and management chooses to declare a dividend, you are entitled to 3% of the dividends distributed. If the company is liquidated, common shareholders also have a right to receive a percentage of the proceeds. However, common shareholders have the lowest priority claim. They receive a percentage of whatever, if anything, is left after the claims of creditors, bondholders, and preferred stockholders have been paid.
Preferred stock is a type of stock that may have no voting rights but pays a fixed dividend amount. Corporations cannot pay any dividends to common stockholders until this obligation to preferred stockholders has been satisfied. For example, GM’s offered its series B preferred shares with a fixed dividend of $2.38 per year. GM cannot pay any dividends to its common stockholders unless it first pays $2.38 per share to the preferred stockholders. After it does that, the dividend to common stockholders could be less than $2.38 a share or much larger than that. Preferred stock may be cumulative or noncumulative. Cumulative preferred requires that if a company fails to pay a dividend at the stated rate, it must make it up at a later time. The GM series B preferred shares are cumulative. That means if these preferred shareholders received no dividend in 2013, they must be paid $4.76 per share (2 × $2.38) in 2014, or no dividends can be paid to common shareholders in 2014.
Debt financing, that is, borrowing, can take the form of loans from a bank or other institution, or the sale of bonds or commercial paper. Bonds and commercial paper are just IOUs that the corporation provides to lenders. Bonds and commercial paper are debt instruments and do not represent any ownership interest in the company. Commercial paper is usually short term and unsecured, that is, not backed by specific assets. Bonds may be secured or unsecured and can have terms as long as 20 or 30 years. If you buy a $10,000 bond from IBM, IBM gives you a bond certificate (an IOU) stating that it will repay the $10,000 you have loaned it on the bonds maturity date. That bond certificate will also state the annual interest rate that IBM will pay you on your $10,000 between the date of purchase and the maturity date. Bond pricing and bond yields are discussed in more detail in Chapter 7, “Capital Budgeting and Discounted Cash Flow Analysis.”
Calculating the WACC
Firms often refer to their weighted average cost of capital (WACC). This is just the weighted average of the cost of raising equity capital from the firm’s shareholders and the cost of borrowing from the firm’s creditors. Consider the hypothetical firm described in Exhibit 6-1 with $50 million of assets. Equity capital, that is, proceeds from the sale of stock, was used to purchase assets costing $30 million (60% of the total). Borrowed funds were used to purchase the remaining $20 million of assets (40% of the total). If the cost of raising equity capital is 11% and the average cost of borrowings is 6%, the firm’s weighted average cost of capital is 9% [(.60x 11%) + (.40x6%) = 9%]. This firm’s business operations must produce a return of at least 9% to cover the cost of the assets utilized. That 9% is sometimes described as the hurdle rate that must be exceeded by all its strategic and operating investments.
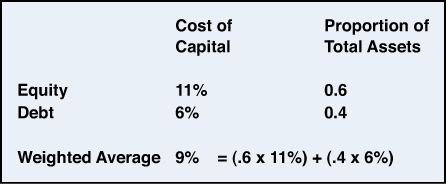
Exhibit 6-1. Weighted average cost of capital
The Cost of Debt
Of course, to do the calculation (refer to Exhibit 6-1) you must start with an estimate of the cost of debt and the cost of equity. As you will see, the cost of debt is the easier number to determine. The cost of debt is just the average after-tax interest rate that the firm pays. Because interest, like other business expenses, reduces a firm’s taxable income, its after-tax cost is less than its pretax cost. If a firm were in a 25% tax bracket, every $100 in interest expense would reduce the firm’s taxable income by $100 and therefore its tax obligation by $25. The net after-tax cost of the interest payment would be $75 ($100 interest payment minus $25 tax reduction). This relationship can be expressed as
After tax cost of debt = (Average interest rate) × (1 – tax rate).
If a firm’s pretax interest rate were 8% and its tax rate were 25%, its after-tax interest rate would be 6% (8% × (1 – .25) = 6%).
The Cost of Equity
The cost of equity is the minimum rate of return that will entice investors to purchase shares of stock in this firm. Of course, stockholders are not promised any specific rate of return. Their stock purchase decision is based on the return they expect to receive. Their actual returns may turn out to be much more or much less than was expected. The riskier a firm is perceived to be, the higher the expected return will need to be to attract equity investors. The capital asset pricing model, often abbreviated as CAPM, is by far the most frequently used method for estimating the expected return that will be required. Recent survey data indicates an overwhelming majority of all organizations and more than 90% publicly traded companies utilize the CAPM when estimating their cost of equity.1 The underlying logic of the CAPM is just that investors won’t pursue a risky investment unless they expect to earn more than they could on a less risky investment. Exhibit 6-2 is an illustration of using CAPM to estimate the expected return on a company’s stock.
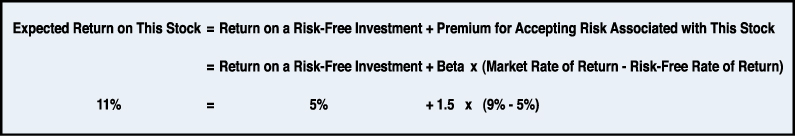
Exhibit 6-2. Using CAPM to estimate the cost of equity
The yield on government bonds is usually assumed to be your best proxy for the return on a risk-free investment. Just less than one-half of all firms report using the yield on the 10-year U.S. government bonds as their estimate of the risk-free rate.2 Others use the yield on either shorter or longer treasury bonds. The illustration in Exhibit 6-2 assumes that during a particular time period government bonds were yielding 5% and the average return on equities in the U.S. stock market was 9%. In other words, the U.S. stock market was providing a risk premium of 4 percentage points above government bonds. Because there are billions of dollars invested in the U.S. stock market, it is clear that an additional 4% added to their expected return was enough to entice many investors to put money in the risky stock market rather than leave it in safer government bonds.
Is Your Company of Above Average or Below Average Risk?
The capital asset pricing model assumes that if a company’s stock is perceived to be of above average risk, it will attract investors only if they believe they can earn an above-average return. Similarly, a company whose stock is perceived to be of below average risk will attract investors even though it is expected to provide a below average return. The company’s stock (refer to Exhibit 6-2) was assumed to be one and one-half times as risky as the market on average, so investors would require a risk premium of 1.5 times the market risk premium of 4 percentage points. A risk premium of 6 percentage points (1.5 × 4%) above the risk-free rate of 5% suggests investors would purchase this company’s stock only if they expected to earn an 11% return on their investment.
The term beta (the second letter of the Greek alphabet) in this illustration is a measure of how risky a firm is relative to the overall stock market. It is a measure of a stock’s price volatility in relation to the rest of the market. In other words, does the stock’s price tend to fluctuate more or less than the average for all other stocks? When a stock’s volatility equals that of an average share in the market, beta equals 1.0. Volatility, uncertainty about what the stock price will be in the future, is treated as an indication of risk. Stocks of above average volatility and therefore above average risk have a beta greater than 1.0, and stocks of below average volatility and risk have a beta of less than 1.0. Beta is usually estimated by comparing the volatility in a stock’s price during some sample period to the volatility in a broad market index such as the S&P 500 index. For example, you could record on a sample of 100 days the value of a company’s stock price and the level of the S&P 500 index. You could then plot those 100 paired observations in a graph similar to the one in Exhibit 6-3 and use regression analysis (or a ruler) to find the straight line that best summarized the historical relationship between this company’s stock price and the S&P 500 index. The slope of that line is the beta.
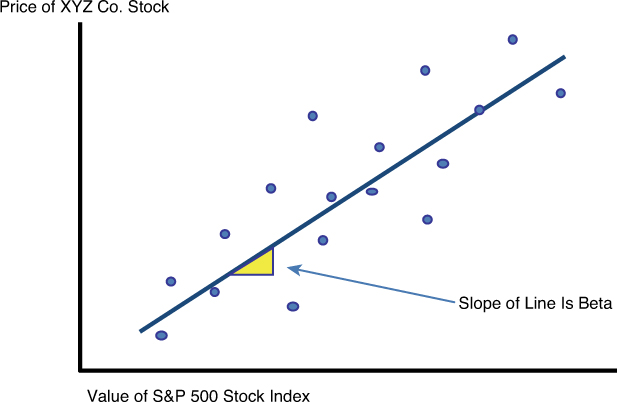
Exhibit 6-3. Estimating beta by plotting a company’s stock price versus the overall market
Stated differently, a change in the company stock price equals beta times the change in the market index. If the beta were 1.2, that would mean that every time the S&P index moves by 1%, this company stock tends to move by 1.2%. If the S&P went up by 10%, the stock would on average rise by 12%. If the S&P fell 5%, the stock would on average fall 6%. Similarly, the price of a stock with a beta of 0.8 would on average rise by 8% when the S&P index climbs by 10% and fall by 4% when the S&P index declines by 5%.
Remember that the betas reflect the average responses during a sample time period. There is no guarantee that these historical patterns will persist into the future. Estimates of the betas for the stocks of publicly traded companies are readily available at no cost from a large variety of Internet financial data services.
Capital Costs in 2012
To review, a company’s cost of capital is the weighted average of its cost of borrowing and its cost of raising money through the sale of stock. The cost of debt is the average after-tax interest rate it pays on the amount borrowed. The cost of equity is the minimum rate of return that will entice investors to purchase shares of stock in this firm. If the company is perceived to be of above average risk, that is, it has a beta greater than 1.0, investors will purchase the stock only if they expect to earn a return that is sufficiently above average for the market. If the company is perceived to be of below average risk, that is, it has a beta less than 1.0, investors will expect to earn a return that is below average of the market. Estimates of the average cost of capital for a sample of industries are shown in Exhibit 6-4. If you review these you can notice that in each industry the cost of equity is substantially above the after-tax cost of debt. Equity investors require a higher return because they expose themselves to considerably more risk. There is no promise about what will happen to the market price of the shares they purchase or what level of, if any, dividends they will receive. On the other hand, bond purchasers and others who loan funds to the firm receive a contractual promise that their principal will be returned along with a specified amount of interest. Their risk is not zero; the firm could default on these promises, but it is substantially less than the risk absorbed by equity investors.
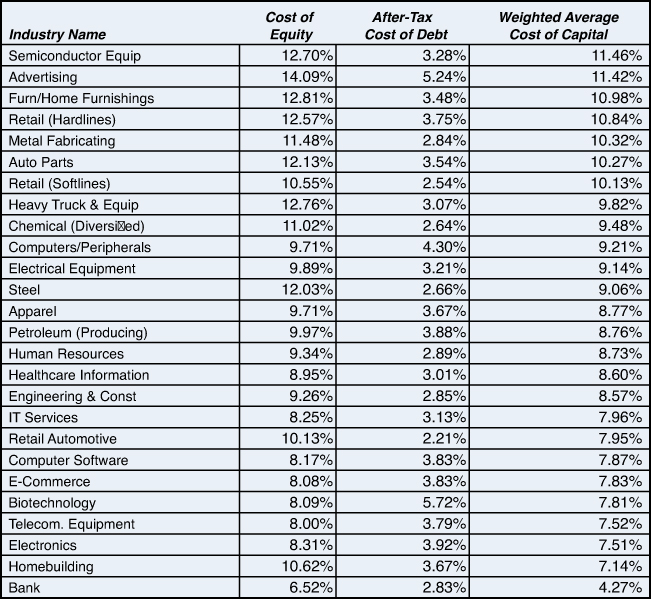
Exhibit 6-4. 2012 Average cost of capital in a sample of industries
Source: January 2012 estimates by Dr. Aswath Damodaran, Stern School of Business, New York University. Downloaded May 23, 2012 from http://pages.stern.nyu.edu/~adamodar/New_Home_Page/datafile/wacc.htm.
Impact of WACC on Value Creation
Value is created only when the assets employed in the firm’s operations generate a return greater than the firm’s cost of capital. Greater value is created when the return on the assets employed increases and/or the cost of capital falls. Increasing the return on the assets employed is the primary challenge facing operating managers. However, before addressing that topic, look at how important a reduction in the firm’s cost of capital can be. The data in Exhibit 6-5 describe one division of a large company. During 2012, this division had pretax operating profits of $700,000 and after-tax operating profits of $462,000. The economic value created by this division during 2012 was $22,000. In other words, its business operations earned $462,000, which was $22,000 more than the $440,000 (10% × $4,400,000) it costs the parent corporation to keep $4,400,000 in assets tied up in this division.
Economic profit = (After-tax operating profit) – (WACC × capital employed)
$22,000 = ($462,000) – (10% × $4,400,000)
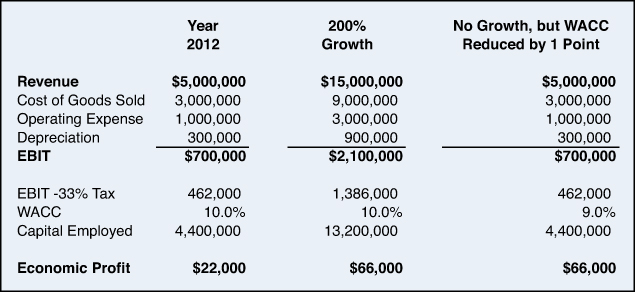
Exhibit 6-5. Relationship between economic profit and WACC
Now look at two different scenarios for 2013. The first one is described in the middle column of Exhibit 6-5 labeled 200% growth. This scenario assumes the firm triples in size. Revenues, expenses, profits, and assets are all three times what they were in 2012. Not surprisingly, that generates an economic profit of $66,000, three times the level of the previous year. Of course, few managers can ever achieve 200% growth in a single year. Is there an alternative way to triple the size of this division’s economic profit? Consider the scenario in the third column of this exhibit. This scenario assumes no growth, that is, revenues, expenses, profits, and assets all unchanged from 2012. However, in this scenario the firm’s weighted average cost of capital declines by one percentage point from 10% to 9%. A decline of that magnitude would increase economic profit by exactly as much is tripling the size of the firm with no change in its cost of capital. That occurs because the firm is saving 1% of the $4,400,000 in assets tied up in this division. In this example, the impact of reducing the cost of capital was large because the amount of assets tied up in this division was large. In other situations the impact may not be as dramatic, but you must understand that changes in the cost of capital can be just as significant as changes in operating performance. Of course, it’s not either–or. Firms must simultaneously strive to maximize their operating performance and minimize their cost of capital.
Reducing the Weighted Average Cost of Capital
How can a firm reduce its cost of capital? Refer to the WACC calculation in Exhibit 6-1. This firm raised 60% of its capital from equity investors and 40% of its capital through borrowing. Using the calculation shown in this exhibit, you can determine its weighted average cost of capital was 9%. Could this firm lower its weighted average cost of capital by using less of the expensive money (equity, which costs 11%) and more of the cheap money (debt that costs 6%)? If this firm reduced its equity proportion to 20% and raised its debt proportion to 80%, would its WACC fall to 7%? Probably not, even though [.20 × 11%] + [.80 × 6%] = 7%. That result could be obtained only if the cost of debt and the cost of equity remained unchanged. If the company were to become more highly leveraged, relying more heavily on debt financing, it would be perceived as a riskier firm. As a result, its cost of equity and its cost of borrowing would probably both rise. Changing the amount of leverage might reduce or might increase this firm’s weighted average cost of capital.3 Choosing the optimal debt and equity proportions requires judgments about how equity investors, lenders, and bond rating agencies respond to the firm’s capital structure. In practice, a firm’s capital structure is often driven more by the need for external funds than by attempts to reach an optimal balance between debt and equity. Highly profitable firms with limited investment opportunities tend to pay down their debt. Firms whose investment opportunities exceed their internally generated funds tend to increase their debt.
Decisions Based on WACC
Capital budgeting is the term often used to describe the planning process through which firms determine whether investments are worth pursuing. Such investments might include purchasing new machinery or replacement machinery, offering training programs, allocating R&D funds, undertaking advertising campaigns, introducing new products, engaging in mergers and acquisitions, and countless others. The weighted average cost of capital is critical to all these decisions and all long-term investments a firm makes. The WACC serves as the hurdle rate that must be surpassed before any of these projects can be approved. If a project does not offer a rate of return greater than the firm’s WACC, undertaking it will destroy rather than create shareholder value. In many cases these investments are evaluated using the firmwide WACC. However, an even higher hurdle rate may be used if the project’s risk level is greater than the risk level for the firm as a whole. HR managers need to understand this concept to allocate resources within the HR function and to design HR systems that encourage managers in all functional areas to develop and execute strategies that create shareholder value. The types of techniques and models typically used to make these decisions are discussed in the next chapter.