12. Creating Value and Rewarding Value Creation
At the time of the last economic census, there were 5,767,306 firms in the United States. Their business strategies differed, but they all had exactly the same goal, value creation. People invest in a business because they believe the value of their investment will increase enough to compensate them for the risk they took as well as for the time value of their money. Companies create value by investing capital at rates of return exceeding the cost of that capital. A company’s capability to identify and implement such investments is determined by the quality of its management and workforce. These are the individuals who must develop and effectively execute the firm’s business strategy. Selecting, motivating, and retaining these individuals is the responsibility of the firm’s human resource management function. For this system to work properly HR managers must understand how value is created in their firm and then use that understanding to design a compensation system that encourages value creation. Enhancing the firm’s capability to create shareholder value should also be the primary objective of all recruitment and selection and employee development activities.
Aligning Pay with Performance
Compensation arrangements should provide incentives for employees to execute the firm’s business strategy in the best interests of the shareholders and other stakeholders. The Center on Executive Compensation has articulated this mandate more fully stating that
To pay for results, companies and their Compensation Committees must have a solid grasp of which measures will create value for the company and its shareholders. Typically, these measures are directly related to the company’s business strategy and thus should be customized for each company. Value may be driven by profits, revenue, market share, new product development, or cash flow, just to name a few, or a combination of measures. The particular measures used may change over time as the company’s business strategy and the global economic environment changes.1
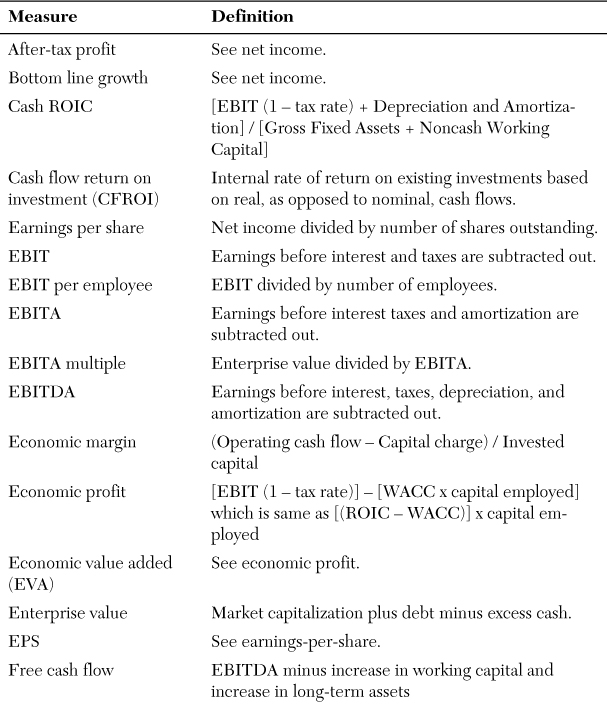
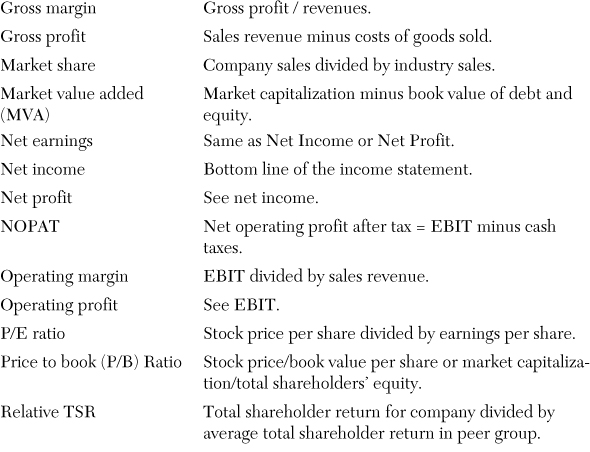
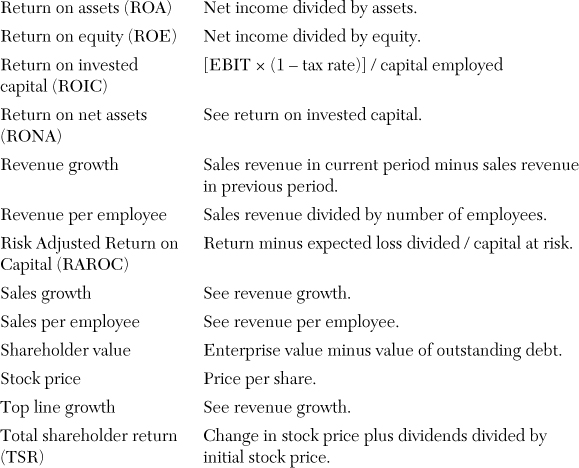
Appendix A at the end of this chapter contains a list of several dozen financial performance measures currently in use. Selecting the financial performance measures that are most appropriate for a specific company at a specific point in time requires an understanding of the firm’s business strategy, a few key financial concepts, and what can seem like an off-putting array of financial jargon. The goal of this chapter is to explain those concepts and decode at least some of that jargon. Hopefully, the following illustrations clarify the economic conditions under which value is created and the challenges involved in measuring value creation.
Isn’t It All About Profit Maximization?
Why make this complicated? Why not just tie incentive pay to profitability? Doing that would, of course, require you to decide which definition of profit you are going to use.
Gross Profit
Gross profit (the difference between sales revenues and the cost of the merchandise sold) might be useful as one of multiple performance measures but is clearly not sufficient as a stand-alone measure. A firm can have positive gross profits, but if those gross profits are not large enough to cover operating expenses, interest, and taxes, the firm will have a bottom line net loss. Gross profit might be appropriate as one driver of short-term incentive pay when a firm’s operating plans call for improvements in gross margins through increasing sales prices and/or reducing merchandise costs.
EBIT Versus Net Income
Earnings before interest and taxes are deducted are the profit generated by a firm’s business operations. Bottom line net income is always the result of two things: the profitability of the firm’s business operations and how that business was financed, that is, how much was borrowed at what interest rate. If the goal is to provide incentives for individuals such as divisional executives who can influence operating results but are not involved in how the business is financed, EBIT would be the more appropriate bonus driver. In most firms financing decisions (for example, whether to raise funds through the sale of stock or the sale of bonds) are made at the corporate level without the involvement of divisional managers.
EBIT Versus EBIT per Employee
EBIT per employee is a metric recommended by one of the world’s largest consulting firms2 and used by major corporations.3 This measure may seem particularly appealing to HR managers because it highlights workforce productivity. It can, however, be misleading. Suppose an IT services firm could get the same output from two programmers paid $100,000 each or three programmers paid $60,000. Which is the better buy? The answer is obvious. There is no reason to pay $200,000 if you can get the same output for $180,000. Exhibit 12-1 shows what would happen if these two staffing strategies were compared on the basis of EBIT per employee. Scenario A would result in lower EBIT and lower net income, but higher EBIT per employee ($220 million divided by 2,000 employees = $110,000). The EBIT per employee under scenario B is less ($240 million divided by 3,000 employees = $80,000) even though this is obviously the better strategy. Consider a different hypothetical. Suppose an auto manufacturer has six welders earning $60,000 per year each. The firm has the option to replace three of those employees with a robotic welding machine leased for $200,000 per year. Automating the welding process would reduce profits but increase EBIT per employee. EBIT per employee is not just an imperfect measure of value creation; it can lead to rewarding strategies that destroy shareholder value. In the examples cited, EBIT would be a much better measure than EBIT per employee.
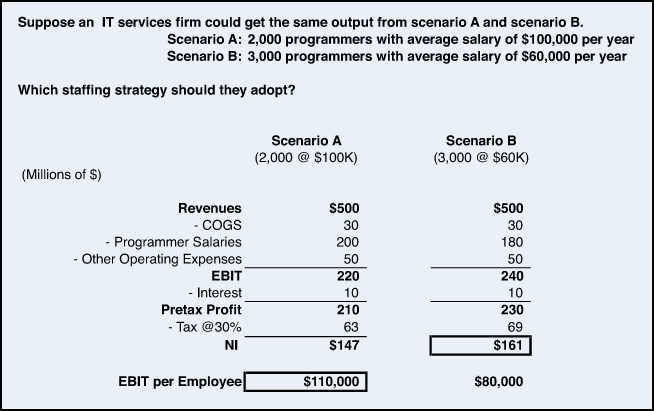
Exhibit 12-1. EBIT per employee can be a misleading measure.
EBIT Versus EBITDA
As discussed in Chapter 2 (“The Income Statement: Do We Care About More Than the Bottom Line?”), EBIT is a measure of operating profit. EBITDA (earnings before interest taxes depreciation and amortization have been subtracted out) is a measure of cash flow from operations. Depreciation and amortization are accounting reallocations of expenses incurred in other periods but do not represent a cash outflow during the current period. EBITDA is a widely used performance metric, particularly in the telecommunications industry. If for the most recent quarter, EBITDA in a telecom company were positive, that indicates that during that quarter the subscriber fees charged to its customers were greater than the cost to provide telecom services to these customers. The cost to provide those services did not, however, include depreciation. Depreciation is the charge that reflects the fiber and electronics costs of building the firm’s network. After these networks are in place, the cost to provide monthly telecom services is relatively low. So if a telecom firm boasts that its EBITDA is positive, it may be saying nothing more than its current revenues are large enough to cover its expenses if you don’t include its biggest expenses (fiber, electronics, and network construction). It is certainly possible for EBITDA to be positive while EBIT is negative; that is, the firm is losing money. If EBITDA were the sole basis for incentive pay, bonuses might well be distributed in years when the firm had large losses. EBITDA does however convey useful information. If EBITDA were negative, cash infusions would be required just to sustain the units operations. Because cash flow management is critical to all firms, EBITDA may be useful as one of several drivers of short-term incentive pay.
Profit per Dollar of Assets: ROA and ROIC
As a stand-alone, measure of performance EBIT, or operating profit, is almost meaningless. Is an operating profit of $300 million a good outcome, one warranting a large bonus payment? If you earn $300 in interest on your bank account, is that a good return? The answer to both questions obviously depends on how much was invested to earn that return. The simplest way to assess the level of performance indicated by a specific profit amount is to express that profit as a percentage of the assets invested to generate that profit. Return on assets (ROA) is usually defined as
ROA = net income / assets
However, as discussed net income is the result of both the success of a firm’s business operations and the way it was financed. Net income, the bottom line of the income statement, is after interest expense has been subtracted out. If you want to compare the business operations of two firms before taking into consideration any differences in the way they were financed, a better measure would be the return on invested capital (ROIC). The return on invested capital (ROIC) is usually defined as
ROIC = after-tax operating profit / assets
= [EBIT × (1 – the tax rate)] / assets
The difference between ROA and ROIC is that the numerator of ROA is net income, whereas the numerator of ROIC is after-tax operating profit. Operating profit is, of course, before interest is subtracted out. If you want to know whether the business operations of United Airlines were more successful than those of Delta Air Lines, before taking into consideration any differences in the way the two airlines were financed, comparing them on ROIC would be more informative than comparing them on ROA. If you want to establish bonus drivers for divisional managers, ROIC would probably be a more appropriate measure than ROA because divisional managers generally are not involved in the financing decisions that impact ROA.
ROIC Compared to the Firm’s Weighted Average Cost of Capital (WACC)
What would your gain be if you borrowed money from your brother-in-law at 8% and put it into an investment earning 6%? You wouldn’t have any gain. You can use exactly the same logic to determine what an acceptable ROIC level is for a firm. A firm’s weighted average cost of capital (WACC) is what it costs the firm to raise the money it has invested in the business. If in a particular year, a firm’s weighted average cost of capital were 8% and its ROIC were 6%, it would have created no economic value during that year. Actually, it would be losing economic value in every period during which that situation persisted. If you borrow money from your brother-in-law at 8%, you come ahead only when you can invest it at more than 8%. A firm generates economic value only when it’s ROIC is greater than its WACC. ROIC is a widely used performance metric. Chapter 2 and Chapter 3 (“The Balance Sheet: If Your People Are Your Most Important Asset, Where Do They Show Up on the Balance Sheet?”) reviewed the financial statements for Home Depot, Incorporated. Home Depot uses ROIC to assess its own financial performance. In a recent announcement the company indicated that it had been targeting achievement of the 15% ROIC by 2015 but now expects to reach 24% by that date.4 Home Depot’s WACC is probably not more than 10%, so an ROIC of that level would represent substantial value creation. How can you estimate the dollar amount of the value created?
Economic Value Added
Economic value added (EVA) is just a firm’s after-tax operating profit minus the cost of financing the assets used to make that profit. The cost of financing those assets is the dollar value of the capital employed times the firm’s weighted average cost of capital. Suppose, for example, a large corporation has $200 million in assets invested in Division A. If that corporation’s weighted average cost of capital is 10%, it costs them $20 million per year to provide those assets to Division A. That division will not generate any economic value for the corporation and its shareholders unless it produces an after-tax operating profit greater than $20 million per year. If its after-tax operating profit were $28 million, the economic value added by that division would be $8 million. If its after-tax operating profit had been $16 million, the divisional managers might have felt they were entitled to bonuses based on that profit, but that division would have reduced shareholder value by $4 million. When corporations tie bonuses to EVA, the message they are sending is that just making a profit is not good enough. To generate value (and justify management bonuses) a firm’s business operations must produce a profit greater than the cost of financing the assets used to make that profit.
Exhibit 12-2 shows EVA can be calculated in either of two ways. You can subtract from after-tax operating profit, the cost of financing the assets used to make that profit, or you can multiply the amount by which ROIC exceeds WACC by the dollar value of the assets employed. Both methods produce the same result. Evaluating corporate performance in this manner is not a new idea. GM used a similar approach in the 1920s. However, much of the current interest in economic value added stems from the work during the 1980s by the Stern Stewart consulting firm. This firm refined the concept and trademarked the term EVA, which as trademarked by Stern Stewart differs from similar measures in that it is calculated using that company’s proprietary procedures for making adjustments to the accounting data used to derive the estimates of after-tax operating profits and capital employed.5 Closely related measures (under slightly different names) are used by many firms. Some use the more generic term economic profit (EP), and some have created their own labels. For example, Roche Pharmaceuticals determines performance bonuses based in part on a closely related measure it calls operating profit after capital charge (OPAC). The commonality in these approaches is that they are all based on after-tax operating profit minus the cost to finance the assets used to make that profit.

Exhibit 12-2. Calculating economic value added
Why does EVA differ from accounting profits? Accounting profit, the net income figure on the bottom line of the income statement, is after subtracting out interest expense. Interest expense is the cost of debt, but an income statement does not include the cost of the equity capital used. EVA is after subtracting a capital charge based on WACC, which is the weighted average of the cost of debt and the cost of equity. It is therefore quite possible for accounting profits to grow while no value is created. Actually, as the hypothetical illustrated in Exhibit 12-3 demonstrates, it is possible for revenues, profits, and even ROE to grow while value is being destroyed. That statement has important implications for the use of revenue, profits, and ROE as bonus drivers.
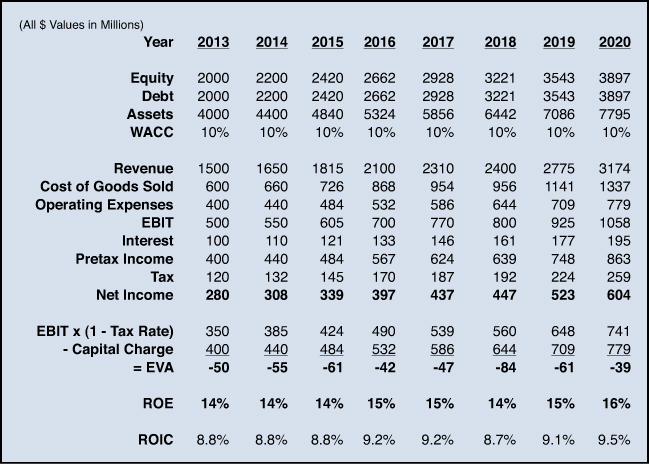
Exhibit 12-3. Revenues, profits, and ROE increased while value was destroyed.
The firm’s revenues and net income grew each year and actually more than doubled between 2013 and 2020 (refer to Exhibit 12-3). The firm’s ROE was also increasing and at seemingly respectable levels throughout this period. Millions of dollars in shareholder value were, however, destroyed in each year. Over the period, the total decline in shareholder value was more than 0.4 billion dollars. That occurred because in each year the firm’s ROIC was less than its weighted average cost of capital. In other words, in each year the firm made a profit, but in no year was that profit large enough to cover the cost of raising the funds needed to support the firm’s business operations. Many, if not most firms, link incentive compensation to accounting measures such as revenue growth, profits (either EBIT or NI), and return on equity. These firms should understand that all those measures can increase even when no value is created.
Hoping to avoid situations such as the one just described, some firms have chosen to link incentive compensation to the dollar value of EVA, whereas others have chosen to link it to the amount by which ROIC exceeds WACC. For example, Kaiser Aluminum Corp. reports that its 2011 short-term incentive plan is designed to reward participants for economic value added above a specified dollar threshold.6 On the other hand, Degussa Chemicals, now part of Evonik Industries, has explicitly targeted an ROIC at least 2 percentage points above its 9% cost of capital.7 EVA and the amount by which ROIC exceeds WACC are closely related but not identical measures. EVA captures the value created by growth in addition to the value created by the ROIC-WACC difference. If growth means more assets (and ROIC and WACC remain unchanged), more shareholder value will be created. A firm that uses the ROIC-WACC difference as a performance metric will probably want to combine it with one or more measures of business growth.
Limitations in the EVA Measure
The concept behind EVA is relatively simple, but the calculation of EVA can become complex. Analysts have attempted to improve the precision of the EVA measure by making accounting adjustments to both the operating profit component and the capital employed component of EVA. For example, from an accounting standpoint R&D is an expense subtracted on the income statement. Some analysts would argue for purposes of calculating EVA, R&D should be treated as an investment. The accounting adjustments required to make that change would include adding back the R&D expense on the income statement, and then capitalizing R&D expenses and depreciating them over time as you would with investments in plant and equipment. Dozens of such accounting changes have been suggested. There are now EVA definitions that range from the basic one that uses unadjusted income statement and balance sheet data, to complex ones that make 150 or more adjustments to the data disclosed in a firm’s financial statements.8 With enough effort most of the concerns about the accounting data used to calculate EVA can be addressed. The trade-off is that these numerous adjustments make it harder for managers to understand what EVA is measuring and what actions they need to take to boost EVA. Another concern unrelated to the accounting data is that EVA does not correlate highly with stock prices. This may be because stock prices are driven by expectations about future performance, and EVA is a measure of past performance. Even if EVA is of limited usefulness as a stock-picking tool, that does not necessarily reduce its value as a planning tool and as a basis for allocating incentive compensation.
EVA is a much better measure of value creation than frequently used metrics such as revenue growth, operating profit, EPS, and return on equity (refer to Exhibit 12-3). Nevertheless EVA does share some limitations with these metrics. They can all create inappropriate incentives to maximize short-run performance at the expense of the long term. Some managers may overemphasize the short term believing that doing so will boost their incentive pay and/or the value of their stock and stock options. These individuals may reason that there is no guarantee that in the longer term they will even be employed at the same firm. Executives overly focused on short-term rewards might be tempted to take actions such as compromising product quality, reducing advertising expenditures, cutting back on new product development, limiting budgets for employee training and development, or offering less competitive pay packages. Even if they are not in the best long-run interest of the firm, any of these actions could increase current profit and EVA measures.
Cash Flow Return on Investment
Cash flow return on investment (CFROI), like EVA, is a metric designed to focus on value creation. Both EVA and CFROI emphasize that value is created only when rates of return exceed the firm’s weighted average cost of capital. Operating profits are the key input to EVA calculations. Operating cash flows are the key input to CFROI models. CFROI is the internal rate of return on the inflation-adjusted cash flows produced with a firm’s assets.9 The calculation and interpretation of an internal rate of return (IRR) measure is discussed in Chapter 7, “Capital Budgeting and Discounted Cash Flow Analysis.” A CFROI greater than the firm’s cost of capital indicates that value is being created. Exhibit 12-4 shows the components used when calculating CFROI. Different firms use different computational approaches, but they all begin with an estimate of the amount a firm has invested in its existing assets. The book value of a firm’s assets is, of course, the original purchase price of those assets minus accumulated depreciation. This process begins by adding back the accumulated depreciation to calculate the amount the firm originally paid. That amount is then converted to current dollars using estimates of the rate of inflation since those assets were purchased. In other words, estimate what it would cost to purchase all those assets today.
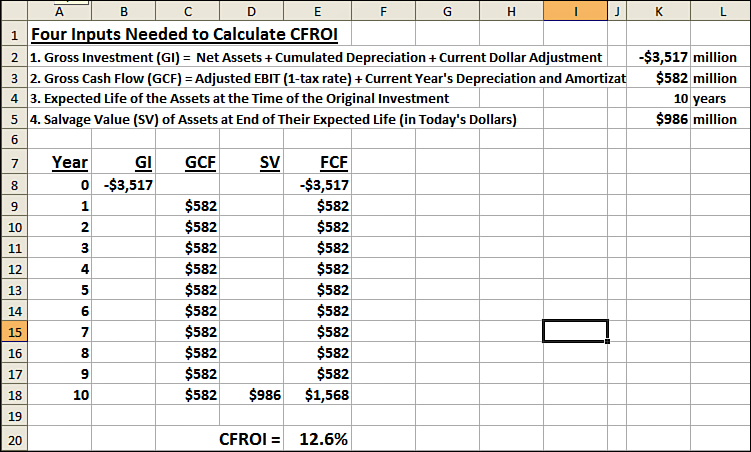
Exhibit 12-4. Calculating cash flow return on investment
The second input to this model is the annual cash flows those assets are currently producing. It is calculated by adding depreciation and amortization back to the usual measure of after-tax operating profit (EBIT × [1-tax rate]). As you know, depreciation and amortization do not represent cash outlays in the current period. The CFROI approach assumes the real (inflation-adjusted) cash flows on assets do not change over time. This may be a reasonable assumption for investments in mature firms. When this assumption is not correct, it is probably a conservative one. If investment returns do grow in real terms, this assumption causes the CFROI measure to underestimate the true value created.
The third input required for this calculation is an estimate of the average useful life the firm’s assets. The estimate used is not the remaining life of these assets, but the total useful life of these assets from the date of the original investment. The final input required is an estimate of the salvage value, (that is, residual value) of these assets at the end of their expected useful life. This estimate is often the portion of the initial investment that was not depreciable. This amount is also adjusted to express it in today’s dollars.
The spreadsheet (refer to Exhibit 12-4) shows the cash flow series based on these four inputs and calculates the IRR of that series in cell E20. The Excel formula in E20 is =IRR(E8:E18). The estimated CFROI is 12.6%. That number should be compared to the firm’s real, that is, inflation adjusted cost of capital. Value will be created only when the CFROI is greater than the real cost of capital. This is analogous to the standard capital budgeting use of IRR.10
As a basis for allocating incentive pay, CFROI has many of the same strengths and weaknesses as EVA. Their primary strength is that both measures focused directly on value creation. As discussed, measures like revenue, profit, and ROE can be positive and growing even when value is destroyed. On the downside EVA, and maybe more so CFROI, can be difficult to communicate to managers. If managers cannot see how changes in their behavior affect the measure, it will not produce the desired incentive effects. There is also always the danger these measures could be gamed by self-serving managers willing to boost near-term profits and cash flow in ways that would not be in the best long-run interest of the firm and its shareholders.
Economic Margin (EM)
Economic margin11 is a performance metric that combines elements of both CFROI and EVA. EVA is operating profit minus a charge for the capital used to generate that profit. Economic margin is based on operating cash flow minus a charge for the capital used to generate that cash flow. That amount is then expressed as a percentage of total invested capital. The invested capital measure in the denominator of the economic margin ratio is similar to the one in the denominator of the CFROI ratio. The equation for economic margin can be written as
Economic Margin = (operating cash flow – capital charge) / total invested capital
The capital charge is (debt plus equity) × WACC. As in the calculation of EVA and CFROI, a number of adjustment’s are usually made to accounting measures of operating cash flow and total invested capital.12 Proponents of the economic margin measure would argue that it is superior to EVA because it is based on cash flows and not on profits. Profits are influenced by accounting choices such as depreciation schedules. Cash flows are not.
Market Value Added (MVA)
ROIC, ROE, EVA, CFROI, and economic margin are performance measures based on financial statement data, not on stock prices. Market value added (MVA) is a function of stock price and usually defined as the market value of the company minus the book value of the company’s debt and equity capital. For example, if the market cap of a company is $10 million and the book value of its assets is $6 million, the market value added is $4 million. Management’s objective should be to maximize the market value added, not the market value of a firm, because the latter can be easily accomplished by investing ever-increasing amounts of capital. A company that generates positive EVA should have a market value in excess of its book value. In theory, the MVA should equal the present value of the expected EVA stream. The economic value of any asset is just the present value of the cash flows you could get out of owning. Looked at this way EVA management can be thought of as a tool to maximize a company’s MVA. There is a sense in which MVA should be a particularly appealing measure to HR managers. MVA measures the value of a company beyond the value of its physical assets. Why might two companies with identical physical assets have different market values? There are a number of possibilities (for example, brand value or first mover advantage), but the most common reason is the differences in the value of their workforces.
If a company’s stock is not publicly traded, it is generally not possible to calculate MVA. MVA is a function of management’s performance, external perceptions of that performance, and external market conditions. Even if the amount contributed by management were negative, the momentum from a soaring stock market might push a firm’s MVA into positive territory. In the year 2000, the average company in the S&P 500 had a market value five times its book. Over the last decade it is more likely that market conditions would have depressed a firm’s MVA. As revealed in Exhibit 12-5, for companies in the S&P 500, the ratio of market value to book value plummeted during the economic crisis of 2008. Since that time the S&P 500 index has regained most of its losses, but the ratio of market to value book value remains below where it was in 2008 and is less than one-half of what it was in 2000.
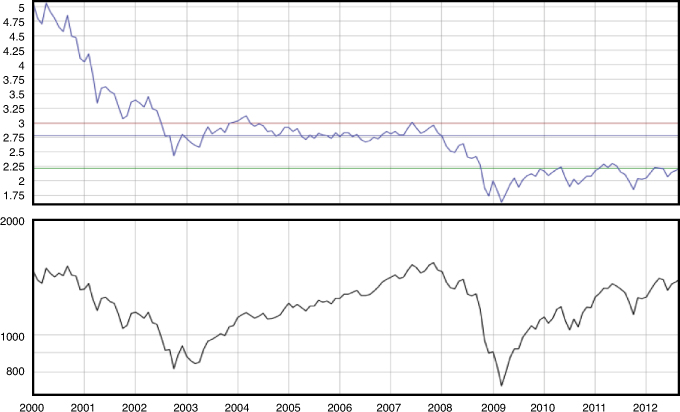
Exhibit 12-5. The top panel shows ratio of market value to book value among S&P 500 companies; the bottom panel shows value of S&P 500 index.
Source: Standard & Poor’s, downloaded September 9, 2012 from http://www.vectorgrader.com/indicators/price-book
Total Shareholder Returns (TSR)
Total shareholder return (TSR) is just the change in the stock price plus dividends. It is often expressed as a percentage by dividing the change in the stock price plus dividends by the initial stock price. For example, if during 2012 a company’s stock price increased from $40 per share to $46 per share and the company paid a dividend of $2 share, its 2011 TSR would be 20% (6 + 2 / 40). Compensation specialists have argued that incentive pay should be linked not just to company financials but also to TSR.13 The implication of that statement is that managers should be rewarded not just based on estimates of how well the company performs but also on measures tied to the benefit received by the company’s shareholders. TSR is viewed by some as the ideal measure for aligning executive compensation and shareholder interests.
How does TSR compare to MVA? TSR is a change measure; that is, the change in the stock price over the last year. MVA is a level measure; that is, the difference between market value and book value at a point in time. Suppose a company’s market value increases from $40 million to $60 million, while its book value increases from $30 million to $50 million. If no dividends were paid, the TSR over that period would be 50% (60 – 40 / 40). The change in MVA over that period would be zero (40 – 30 = 60 – 50). If MVA had been measured as a ratio rather than as a difference, it would have declined by 13 percentage points (40 / 30 = 1.33 and 60 / 50 = 1.20). Even though they were each affected by stock price, TSR and the two measures of MVA would have resulted in different levels of incentive pay.
Relative TSR
Relative TSR is just a company’s TSR relative to the average TSR among a reference group of other companies. Tying incentive pay to relative TSR instead of absolute TSR minimizes the impact of overall stock market fluctuations and industrywide changes in performance. Performance share plans (those that grant stock to employees based on company performance levels) are increasingly popular, and TSR is the most frequently used performance metric in these plans. For example, in February 2012, performance share units granted to GE CEO Jeff Immelt in 2007 were canceled because between 2007 and 2011 GE’s TSR did not exceed that of the S&P 500.14 Many companies feel relative TSR is the best measure they have to align executive compensation with shareholder interests. Still, a number of valid cautions about the use of TSR or relative TSR have been raised. One is that the composition of the reference group can dramatically change the impact of this measure. One high-tech company that measured its TSR relative to the S&P 500 later realized that market swings in the tech industry were much wider than cycles in the general economy. This meant the relative TSR measure it was using was capturing relative volatility, not relative performance.15 Is the way to avoid that problem to compare a company’s TSR with the average TSR in a small group of similar companies? Identifying a small group of highly similar companies is not always possible. Even when it is, unintended outcomes can occur. The average TSR among a small group of 4 to 6 firms could be greatly impacted by an unusual event, for example, an acquisition or a patent lawsuit at one of the firm’s in the group. Such events could influence your firms incentive pay in ways unrelated to your firm’s performance. An additional criticism has been that although TSR may do a good job to align executive pay and value creation, it does not do a good job signaling to executives how to create that value. Unlike TSR, internal financial and operating measures can be focused on the specific value drivers that have been targeted by the firm’s business strategy.
Earnings per Share (EPS) and the Price/Earnings (P/E) Ratio
Earnings per share, which is just net income divided by the number of shares outstanding, gets a lot of attention. It is often the headline number first reported by the media when firms release their quarterly financial reports. The reason for this attention is that EPS is closely related to stock price. The price of any firm’s stock can be expressed as it’s EPS times its P/E ratio. If a company’s P/E is 15, that is, its stock price is 15 times its EPS, and its EPS increases from $2 to $3, its stock price will increase from $30 to $45. Some executives have complained, however, that even though their EPS was rising (which they believed was a result of their performance), their stock prices fell because of lower P/E ratios (which they believed were unrelated to their performance).
The P/E ratio, the price per share divided by earnings per share, is the amount share purchasers are willing to pay for every $1 of earnings. Why do P/E ratios differ between companies? Why isn’t $1 of earnings from Company A worth exactly the same thing as $1 of earnings from Company B? The answer is that P/E ratios are determined not by current earnings-per-share but by expected future earnings. Consider the example in Exhibit 12-6. Both companies are currently earning $2.00 per share, but the expectation in the market is that Company A’s EPS will decline in the future, whereas company B’s EPS will rise. Obviously, investors will pay more for Company B’s stock even though both companies have the same current earnings-per-share. Investor expectations about future earnings-per-share are shaped by company-specific factors as well as by factors related to the overall market and the overall economy. During 2012, the median P/E for stocks in the S&P 500 was close to 16. High P/E stocks, (for example, those with a P/E above 25) tend to have higher growth rates or the expectation of a profit turnaround. Low P/E stocks (for example, those with a P/E below 10) tend to have slower growth or diminished prospects.
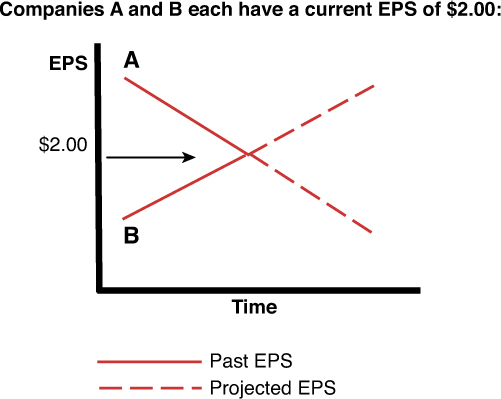
Exhibit 12-6. Stock price reflects expected not current EPS.
Managing EPS Expectations
It’s not unusual to see a company’s stock price fall immediately after it announces an increase in earnings-per-share. The explanation is typically that the company’s EPS did not rise as much as financial analysts had expected. A company whose earnings had been expected to rise by 10% typically sees its stock price fall if it announces an earnings increase of 5%. A company whose earnings had been expected to rise by 2% typically sees its stock price jump if it announces an earnings increase of 5%. Managers concerned about their company’s stock price worry about both EPS and the P/E ratio. The success of their current operations determines their EPS, and the guidance they give investors is one of the factors affecting the P/E ratio. When giving guidance about future earnings, companies have an incentive to not let expectations get too high. The higher the stock market’s expectations for a company’s performance, the better the company has to perform just to keep its stock price stable. Home Depot stock, for instance, lost one-half its value between 1999 and 2009 despite growing revenues at 11% per year and maintaining a value creating ROIC. A McKinsey and Co. analysis16 suggested that a major reason for that drop was that the market was expecting an even higher and probably unobtainable level of performance. Justifying Home Depot’s 1999 stock price would have required revenue growth of 26% per year for 15 years. That example highlights the importance of managing expectations as well as earnings.
The Impact of Financial Restructuring on EPS
Earnings-per-share is net income divided by the number of shares outstanding. The value of the ratio, of course, changes when there are changes in either the numerator or the denominator. If net income remains constant, the denominator decreases, and EPS rises when a company buys back shares. Managers sometimes mistakenly interpret increases in EPS due to financial restructuring as increases in business performance. When a company borrows to buy back shares, this increases EPS but does not change the cash flows from the firm’s operations or add value to the firm. It changes only who has a claim to those cash flows, the shareholders or the debt holders. There would be no rationale for operating managers to receive EPS-based incentive pay in a situation such as this.
Acquisitions are a second area in which EPS changes are often misinterpreted. For example, when General Dynamics recently acquired the privately held munitions manufacturer Gayston, Corp., it did not disclose the terms of the deal but said it expected the transaction to be “accretive to earnings.”17 Many managers believe they should not undertake acquisitions unless those acquisitions are accretive, that is, they increase the acquirer’s earnings-per-share. The example in Exhibit 12-7 demonstrates the fallacy in this reasoning. In this example, company A’s weighted average cost of capital is 8%. Because the assets acquired in this transaction produce a return of only 7%, the economic value added, or in this case the economic value lost, is –$65 million (–1% × the $650 million acquisition price). Nevertheless, the deal is accretive in that the acquirer’s EPS increases by 20%. The acquirer’s EPS increases because the income from the new assets exceeds the after-tax interest expense on the new debt. It’s important for managers to understand that that increase in EPS does not always mean an increase in economic value.
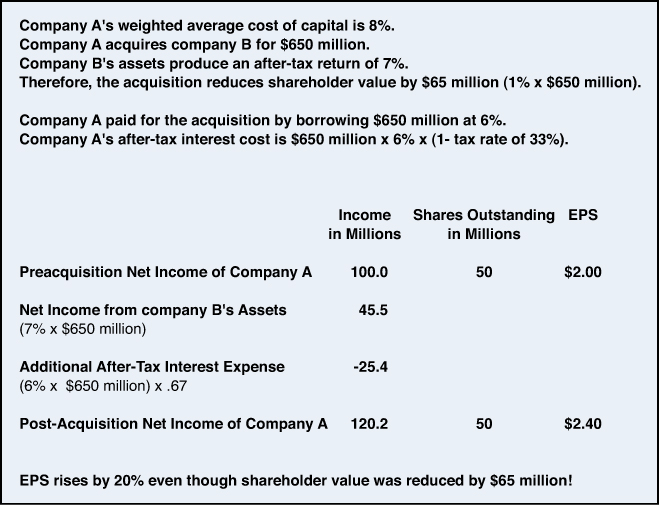
Exhibit 12-7. Accretive acquisitions do not necessarily add value.
The Goldilocks Problem: Getting the Incentive Level Just Right
The Center on Executive Compensation advises that “incentive plans should be customized to the company to support the realization of its business strategy while limiting overly aggressive or overly conservative decision making.”18 Complying with that advice is not a simple task. In addition to selecting the most appropriate measures, a firm must ensure that the reward for increased performance is just right, not too little and not too much. During the 1980s, executive pay packages were often criticized because they were not tightly linked to corporate performance. One influential study concluded executive compensation did not reflect changes in corporate performance. Even though bonuses represented a large proportion of total compensation, CEO pay was “no more variable than compensation for hourly and salaried employees.”19 Corporations responded by increasing incentive pay and granting more stock options. Then in 2008, the financial crisis caused the pendulum to swing in the opposite direction. Many argued that the global economic crisis was due in part to executive compensation packages that encouraged excessive risk-taking. The allegation was that paying bonus payments tied to short-term profits, and granting options with a limited downside but an unlimited upside encouraged managers to take big risks in the pursuit of big rewards. During 2007 and 2008 many of these high-risk investments failed, causing shareholder value to plummet. Responding to these concerns, in December 2009, the Securities and Exchange Commission approved new rules requiring publicly traded companies to disclose information about how they have incorporated risk management into their compensation practices.20
Of course, businesses cannot operate without taking risks. The challenge is to avoid risks that are not justified by the potential rewards, and risks that, regardless of the size of the potential reward, might impose unacceptably severe costs on the firm or its stakeholders. Making decisions about which and how much risk a firm should accept is usually the responsibility of the CFO, perhaps with the CEO and others. It is HR’s role to help design a compensation system that encourages individuals to adopt behaviors consistent with those decisions. To do that HR managers must understand the financial performance measures their firm uses and the behaviors that would be encouraged by linking incentive pay to these measures. They also need to understand that some forms of pay are inherently more risk-inducing than others. For example, suppose a firm’s stock options vest after 3 years and are exercisable for 10 years. This creates a 7-year period during which executives could be exercising their options and then immediately selling those shares, benefiting from a short-term spike in the stock price. That could provide a substantial monetary incentive to undertake risky projects with short-term payoffs, even if they offer little prospect of long-term value creation. That inappropriate incentive could, of course, be negated or at least reduced if the firm required that shares be held for a period of time after the options were exercised.
Many firms are replacing options with performance share units (PSUs). PSUs represent the value of one share of the company’s stock plus the dividends paid. The number of PSUs an employee receives typically depends upon some measure of the firm’s financial performance. For example, an incentive formula might state that if the firm’s EBITDA is below $50 million, the executive receives no PSUs. If EBITDA reaches $50 million the executive receives 1,000 PSUs plus an additional 20 PSUs for each $1 million of EBITDA more than $50 million. Formulas of that type can encourage either overly aggressive or overly conservative decision making. If the minimum threshold is difficult to achieve, executives may feel they must adopt risky strategies to earn any incentive pay. If the minimum threshold is a reasonable one, but the number of PSUs offered for amounts more than the threshold is too small, executives may have an incentive to be overly cautious seeking to avoid anything that might cause them to miss that minimum threshold. If the number of PSUs offered for amounts more than the threshold is large and uncapped, executives may be tempted to pursue high-risk strategies that offer the possibility of tremendous payoffs.
Risk Must Be Considered When Evaluating Financial Performance
You would not evaluate the financial performance of your personal investments without taking risk into consideration. You would not be happy with your stock mutual fund if it provided the same rate of return you could have earned on a government-guaranteed bank CD. The stock fund, to justify the extra risk you are taking, would need to provide a much higher return. That same principle should be applied when deciding how much incentive pay is warranted by a given level of corporate financial performance. Executives who achieve a strong level of financial performance without excessive risk-taking should be rewarded more highly than executives who achieve that same level of performance by exposing the company to great risk. Consider the following example from the home mortgage industry.
Employee A grants (with income checks) mortgages of $1 million that do not exceed 50% of the value of the underlying property. Employee B grants (without income checks) mortgages of $1 million that equal 90% of the value of the underlying property. A typical bonus program would be based only on the value of mortgages granted ($1 million in each case). The lack of integration between bonus and risk level encourages employees to maximize the dollar value mortgaged, limited only by the need to meet compliance and approval requirements. There is no incentive to grant less risky mortgages, and the consequence for granting risky mortgages is often not realized until a default many years after payment of the associated incentive amount.21
Some executive contracts contain clawback provisions. These provisions require the employee to repay bonus amounts that later turn out not to have been earned. However, these provisions are generally limited to situations in which a material misrepresentation results in a restatement of the company’s earnings. They typically do not apply to situations where high-risk strategies turn out badly. A better way to have avoided the adverse incentives created by the compensation system in the preceding example would have been to reward loan officers for both the level of performance (the dollar value of mortgages granted) and the quality of that performance (the likelihood that the mortgages will be repaid in full). The probability that a mortgage would be repaid in full might be estimated based on factors such as borrower’s credit score and the ratio of mortgage value to the home value. The average risk level of the mortgages approved by Employee A could then be calculated and used along with the dollar value of mortgages approved by Employee A to determine the size of her bonus.
Securities analysts when evaluating the performance of a portfolio of stocks, bonds, or other financial instruments use a variety of risk measures, for example, volatility, Sharpe ratio, Value at Risk (VAR), and risk adjusted return on capital (RAROC). In most industries these measures cannot be applied directly to assess the risk associated with firm performance or specific business proposals. In many cases, such as the previous mortgage example, firms can develop their own numerical risk indicators. However, even in firms where the level of risk cannot be easily quantified, managers and corporate boards must consider risk when evaluating and rewarding financial performance.
Putting It All Together
Both short-term and long-term financial measures should be designed to encourage long-term value creation. It will almost always be necessary to combine these financial measures with nonfinancial measures such as customer satisfaction, market share, product innovation, product quality, process efficiency, and the ability to attract and retain talented employees. Short-term metrics should be used to drive implementation of the firm’s business strategy. These measures often include specific annual targets for items such as cash flow (EBITDA), revenue growth, operating margins (EBIT/sales revenue), and return on invested capital (ROIC). Managers must not be allowed to game the system by maximizing one of these at the expense of the others. For example, revenue growth adds economic value only when ROIC is greater than the weighted average cost of capital (WACC). Rewarding revenue growth when ROIC is not greater than WACC would be a serious mistake. Firms should consider not rewarding improvements in any one measure unless each of the other measures is at or above a minimum threshold. Annual performance metrics should be specific to the firm’s short-term operating strategy. That strategy might suggest that value creation can be maximized by setting an aggressive revenue growth targets while maintaining an acceptable ROIC level. On the other hand, a firm pursuing a strategy of targeting a narrow market niche that will pay a premium for a differentiated product might set an aggressive ROIC target while maintaining an acceptable pace of revenue growth.
Short-term performance metrics may also change over a product’s life cycle. Exhibit 12-8 shows how this might occur. Following the introduction of a new product, firms invest to support growth. The expectation is that during this period sales will be growing rapidly and that the product will be profitable. At the same time cash flows may be low or even negative. The firm may be pouring large amounts of cash into the business to expand manufacturing, distribution, and sales facilities. This often results in a negative cash flow. However, because these large expenditures are not expensed on the current income statement but rather depreciated over many years, they do not prevent the firm from showing an accounting profit.
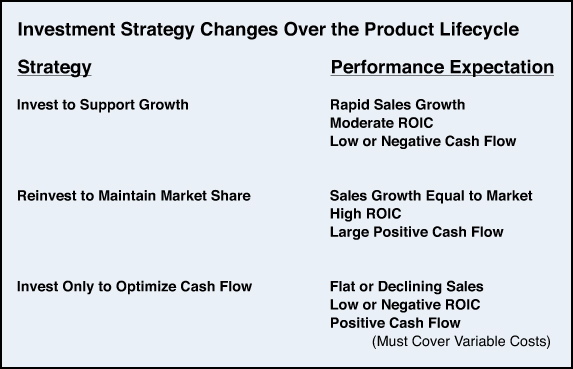
Exhibit 12-8. Linking performance measure to strategy
At some point the product reaches its peak where to maintain market share sales growth must equal that of the market. At this point the product should be generating large profits and large positive cash flows. Getting to this point was the reason the firm introduced the product in the first place. Eventually, the product will approach the end of its life cycle with sales that are flat or declining. To maintain sales in the face of competition from newer products, prices may need to be reduced substantially. This price reduction may lead to operating losses and a negative ROIC. Would a firm continue to produce this product if it shows a loss each quarter? It would as long as the cash flow from the product is positive and large enough to cover the variable costs. For example, suppose revenues are $100 million, variable costs are $50 million, and fixed costs are $30 million. The firm’s profit is $20 million (+ 100 – 50 – 30). Variable costs are those that vary with the volume of output. Fixed costs do not vary on the number of units produced. Now supposed to compete with a competitor that has a newer model, this firm must reduce its price by 30%. If it continues to sell the same number of units, its accounting profit would be –$10 million (+ 70 – 50 – 30). Why not shut the plant down if it is losing $10 million a year? If the plant is closed, that eliminates the $50 million in variable costs but not the $30 million in fixed costs. If production continues for another year, the firm must put in another $50 million to cover the variable costs, but that amount will be more than offset by the $70 million in revenues generating by keeping the plant open. In other words, the cash inflows from keeping the plant open another year are greater than the cash outflows required to keep it open. As long as that is the case, there is a benefit to keep the plant open even if it shows an accounting loss.
Now step back and look at the implications of that last example. The performance metrics were the same in all three stages of this product’s life cycle, but their interpretation shifted by 180 degrees. In the early stage no incentive bonus would be awarded unless sales were growing rapidly. In the latter stage the expectation is that sales would be flat or declining. In the early stage no incentive bonuses would be awarded unless profits and ROIC were positive. In the latter stage an acceptable performance might include losses and a negative ROIC. In the early stage an acceptable performance could include low or even negative cash flows. In the latter stage cash flows would have to be positive and large enough to cover all variable costs. What’s the take away message in this example? Financial performance metrics cannot be interpreted independent of each other and without considering the business context.
Long-Term Measures of Value Creation
The short-term operating and financial measures a firm focuses on should be the drivers of long-term value creation. The metrics used to determine long-term incentive pay usually include a much heavier weighting on direct financial measures of value creation such as EVA, CFROI, and economic margin, and on stock market-based measures of value creation such as stock price, relative TSR, and market value added. These are usually combined with one or more forms of equity-based pay such as restricted stock, performance shares, stock appreciation rights, or stock options. In recent years there appears to be a trend toward using multiple forms of long-term incentives. Stock options now make up 50% or less expected of the value of long-term incentives. Among large firms, a measurement period of 3 years is often used to determine long-term incentive pay.22 An argument could certainly be made that from the shareholder perspective 3 years should be considered an intermediate term, rather than a long-term performance. Almost all publicly traded large firms attempt to achieve an even longer term alignment between top executive and shareholder interests through the use of executive stock ownership guidelines. These guidelines often require that top executives hold company shares valued at 3 to 6 times their base salary. The assumption is that executives will be less likely to take excessive risk or overemphasize short-term results if a significant portion of their personal wealth is tied up in company stock. Most stock ownership policies require compliance for as long as the executive remains employed at the firm. Some however extend into retirement. Exxon Mobil, for example, grants restricted stock with 50% vesting after 5 years and 50% vesting 10 years after retirement.23
Using Imperfect Metrics Well
All measures of business performance are imperfect. Each has its own weaknesses and limitations. The challenge is to combine them in ways so that in the aggregate they provide a useful basis to plan and evaluate business outcomes. Discounted cash flow measures such as net present value and internal rate of return are almost universally recognized as essential planning tools. They are just as applicable to investments within the HR function as they are to investments and other functional area. Even when formal DCF models are not prepared, all operating and strategic investments should be considered from this perspective. No expenditures should be made unless the anticipation is that the present value of future benefits will exceed the upfront costs. DCF techniques work well at the project level, even if the project is a huge one such as an acquisition. However, when assessing performance at the business unit or company level where many things are happening at once, additional measures are needed.
Accounting measures such as revenue growth, cash flow, and profit margins are easy to communicate and can be targeted at the specific changes required by a firm’s business strategy. The weakness in these measures is more than just the assumptions the accountants must make to generate them. It is possible to grow revenues, cash flow, profits, and ROE while no shareholder value is created. Firms create value for their shareholders when, and only when, the return on invested capital is greater than the firms’ weighted average cost of capital. That statement is simple and unquestionably true. The complexity and ambiguity arise when you try to measure the rate of return, the amount invested, and the weighted average cost of capital.
A number of direct measures of value creation have been proposed, for example, EVA, CFROI, and economic margin. The basic concept underlying these measures is easily understood. A firm does not generate value for its shareholders unless its after-tax operating profit is greater than the cost of financing the assets used to make that profit. Communicating that message to everyone within an organization is essential. Unfortunately, calculating these measures can require extensive reconfigurations of the underlying accounting data. These reconfigurations can obscure what is actually measured. Non-accountants may fail to see the forest for the trees and therefore miss the message about what it takes to create value. An important challenge facing HR managers is ensuring that all employees, whether or not their pay is tied to these measures, understand the economic conditions under which value is created and how their own activities impact value creation. Most employees do not need to understand the accounting detail. They do need to understand the determinants and consequences of changes in operating profits, the assets invested in their unit, and the cost of raising the money to purchase those assets.
Encouraging value creation through the use of equity-based pay (for example, restricted stock, stock options, and stock appreciation rights) or through bonuses tied to measures such as market value added avoids the reliance on accounting data. The trade-off is that market values that are highly volatile may be influenced by events, perhaps on the other side of the world, unrelated to firm performance. The value created when ROIC is greater than the cost of capital will over the long term be correlated with market value. Proponents would argue that in the short run, EVA and related measures are more useful than stock market-based measures because they are less impacted by factors beyond the control of the executive team. Most large firms use a combination of these measures. Selecting the mix that is most likely to attract, motivate, and retain talented employees can be a major determinant of a corporation’s success. HR managers who do not understand the strengths and weaknesses of these alternative performance metrics cannot develop a compensation strategy that aligns executive incentives with the firm’s business strategy.
HR’s Role in Value Creation
The talent of its management and workforce is often the primary determinant of a corporation’s success. HR professionals are the ones charged with responsibility to build that competitive advantage. There is no role more important than that. Successful HR strategies are those that align with and support the firm’s business strategy. Successful business strategies are those that create shareholder value. Understanding the financial requirements for value creation is therefore critical to the strategy development process. This book was not intended to be a volume on business strategy or on HR strategy. It was intended to help HR managers increase their understanding of the financial tools they need to link HR strategy to business strategy. Line managers often see a lack of business acumen as the major factor limiting the success of their HR colleagues. Sometimes this is an accurate assessment. At other times, HR managers have the necessary business insights but cannot effectively communicate with line managers because they don’t speak the language (finance) used to plan and evaluate business initiatives. In either case, the good news is that it does not take a degree in finance to overcome those limitations. When you get past the jargon, it is not difficult to obtain an intuitive understanding of the key finance principles that guide corporate operating and strategic decision making. These principles are no more complex than things HR managers deal with all the time. HR managers willing to make a reasonable effort to get up to speed in these areas should not underestimate their ability to contribute to discussions involving financial measures and financial models. If they do not do this, they are limiting what they can contribute to their companies and what they can achieve in their careers.
Appendix A: A Sample of Financial Measures Currently in Use
Caution: These measures are not defined by GAAP, and definitions may vary from company to company.