
Chapter 11. Costs and Benefits of HR Development Programs
Organizations in Europe, the United States, and Asia spend billions each year on employee training—more than $125 billion in the U.S. alone. At the level of the individual firm, Google is exemplary. It offers each employee 100 hours of professional development training per year.1 These outlays reflect the cost of keeping abreast of technological and social changes, the extent of managerial commitment to achieving a competent and productive workforce, and the broad array of opportunities available for individuals and teams to improve their technical skills and their social skills. Indeed, the large amount of money spent on training in both public and private organizations is likely to increase in the coming years as organizations strive to meet challenges such as the following:2
• Hypercompetition: Such competition, both domestic and international, is largely due to trade agreements and technology (most notably, the Internet). As a result, senior executives will be required to lead an almost constant reinvention of business strategies/models and organizational structures.
• A power shift to the customer: Customers who use the Internet have easy access to databases that allow them to compare prices and examine product reviews; hence, there are ongoing needs to meet the product and service needs of customers.
• Collaboration across organizational and geographic boundaries: In some cases, suppliers are colocated with manufacturers and share access to inventory levels. Strategic international alliances often lead to the use of multinational teams that must address cultural and language issues.
• The need to maintain high levels of talent: Because products and services can be copied, the ability of a workforce to innovate, refine processes, solve problems, and form relationships becomes a sustainable advantage. Attracting, retaining, and developing people with critical competencies is vital for success.
• Changes in the workforce: Unskilled and undereducated youth will be needed for entry-level jobs, and currently underutilized groups of racial and ethnic minorities, women, and older workers will need training.
• Changes in technology: Increasingly sophisticated technological systems impose training and retraining requirements on the existing work force.
• Teams: As more firms move to employee involvement and teams in the workplace, team members need to learn such behaviors as asking for ideas, offering help without being asked, listening and providing feedback, and recognizing and considering the ideas of others.
Indeed, as the demands of the information age spread, companies are coming to regard training expenditures as no less a part of their capital costs than plant and equipment.
Training and development entail the following general properties and characteristics:3
- They are learning experiences.
- They are planned by the organization.
- They occur after the individual has joined the organization.
- They are intended to further the organization’s goals.
Training and development activities are, therefore, planned programs of organizational improvement undertaken to bring about a relatively permanent change in employee knowledge, skills, attitudes, or social behavior.4
The analytical tools that we present here apply to programs as diverse as providing learning through job experiences, coaching, mentoring, formal training, e-learning (online instruction, mobile learning such as podcasts, and virtual classrooms), and off-site classes or degrees. We focus our examples on training programs because that is where most of the research and discussion has occurred. In the area of training, topics range from basic skills (technical as well as supervisory skills) to interpersonal skills, team building, and decision making for individuals or teams. Technologies used run the full gamut from lectures to interactive video, to Internet-based training, intranet-based training, social software applications, Web 2.0 tools (technologies that enable user-generated content, such as blogs and wikis), and intelligent tutoring systems.5
Unfortunately, although billions may be spent providing training and development programs, little is spent assessing the social and financial outcomes of these activities. Consider leadership-development programs as an example. Despite the economic downturn that began in December 2007, firms such as Philips Electronics, Estée Lauder, and Canon continued to invest in such programs, hoping not to be caught short of strong managers when the economy recovers.6 One thorough review estimated, however, that only 10 percent of leadership-development programs evaluated their impact on the actual behaviors of managers. Most consider only the satisfaction of participants as an indicator of the programs’ effectiveness.7 At a broader level, just 23 percent of companies in one recent survey reported that “measuring the impact of training” was a top priority.8 The overall result is that little comparative evidence exists by which to generalize or to evaluate the impact of the various technologies. Decision makers thus remain unguided by systematic evaluations of past experiments and uninformed about the costs and benefits of alternative HRD programs when considering training efforts in their own organizations.
That said, meta-analytic evidence collected across many individual studies and in many different organizations does illustrate the positive benefits of different content, methods, and types of training, when designed and implemented properly, across different criteria, such as trainee reactions, substantive learning, behavior change, and organizational results.9 The study we describe next asked a different question: Is there a relationship between firm-level investments in training and changes in those firms’ stock prices?
The Relationship Between Training Expenditures and Stock Prices
At present, firms’ investments in human capital—most notably, spending on employees’ development—are treated as hidden costs that are buried in overhead, specifically in the accounting category “Selling, general, and administrative expenses,” or SG&A. This treatment makes investments in human capital difficult to obtain.
Using a unique database, one study tested the hypothesis that firms that make unusually large investments in employee development subsequently enjoy higher stock prices than comparable firms that make smaller investments in employee development. To disentangle the effects of training, per se, from other potentially confounding variables, the authors deployed a variety of multivariate techniques and control variables.10
The research revealed that four portfolios of 575 publicly traded companies that invested in employee training and development at roughly twice the industry average outperformed the S&P 500 by 4.6 percentage points over a 25-month period, and outperformed it in the year prior to the study by 17–35 percent.11 In 2009, the same authors demonstrated in a sample of 30 banks that training expenditures remain a powerful predictor of subsequent stock prices, even through the market turbulence of 2008.12
Moreover, some forms of training yield superior benefits, relative to others. Specifically, training in technical skills yielded an effect that was 3.5 times higher than the effect for all types of training and 6 times higher than that for general business skills.
To assess the direction of causality, the researchers examined the relationship between training expenditures and stock returns in various years. The only significant relationship they found was between training expenditures in year t-1 and stock return in year t. There was no significant relationship between training expenditures in year t-1 and stock returns in either year t-1 or t-2. This supports, but does not prove, that training investments help determine stock price performance, not the opposite.
In the absence of a true experimental design, however, it is impossible to rule out the possibility that the training measure is serving, at least in part, as a marker for other unmeasured, firm-level attributes that are correlated with a firm’s long-term profitability (and thus equity market valuation). In other words, while on the surface it may appear that variables a and b are correlated, that relationship might be illusory, because both a and b are correlated with variable c, which is unmeasured in the study. As the authors noted:
From the perspective of an individual investor, it is far less important whether the correlation between training and stock value represents a causal training effect on firm performance or whether training is instead simply a leading indicator for other productive firm activities or attributes. In the short run, so long as the underlying relationship between training and whatever firm characteristics that affect productivity continue to hold, investment portfolios that incorporate information about firm training expenditures will yield super-normal rates of return.13
While the researchers’ analyses cannot determine why the relationship between training expenditures and stock price performance exists, three possible explanations seem plausible:
- Training investments have their intended impact. Firms that make greater investments in this area subsequently perform better, as a result.
- Training investments may well serve as a proxy for the degree to which a firm is willing and able to take a long-term perspective rather than focus excessively (and destructively) on quarterly earnings.
- Expenditures on training (and, in particular, changes in those expenditures) may serve as a window into an organization’s future financial health and prospects (or lack thereof).
Although the tools we describe in this chapter are certainly valuable for increasing the amount and effectiveness of development-program evaluation, the issue runs much deeper. Analytical decision tools are not just useful for evaluating programs after they are complete. The lack of evaluation in HR development is a symptom of a more fundamental issue: a lack of systematic logic to plan and refine such programs.
The Logic of Talent Development
Our intent in this chapter is not to present true experimental or quasi-experimental designs for evaluating HRD programs.14 Instead, it is to illustrate how the economic consequences of HRD programs can be expressed. Let us begin, as we have in other chapters, by presenting the logic of talent development, as shown in Figure 11-1.
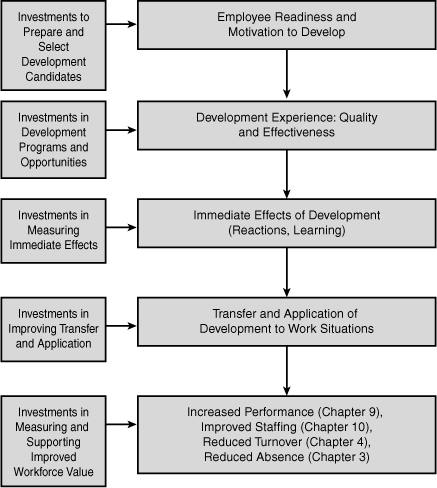
Figure 11-1. Logic of talent-development effects.
As Figure 11-1 shows, effectiveness of development is much more than sound design and effective implementation of HRD programs or experiences. These are necessary, but not sufficient by themselves, to ensure that what is learned in training is actually applied on the job.15 For that to occur, other conditions must be satisfied. First, candidates for development must be prepared and motivated both to learn and to apply their learning at work. This requires investments by the organization both in the preparation of development candidates (for example, through challenging job assignments) and in careful selection of candidates for development experiences, such as jobs or training programs.
Second, after the development experience, there must be an environment that provides the opportunity and motivation for the newly developed individuals to apply or transfer their learning to their work. This second condition requires that supervisors and higher-level managers support employees’ attempts to use on the job what they have learned in training or development. For example, if employees learn all about democratic leadership styles in training but then report back to autocratic leaders on the job, the effects of the training are not likely to have long-term effects. In addition, it is important to offer rewards and incentives to employees when they apply what they learned in training to improve their day-to-day job performance. This means that improved performance often carries with it increased costs of pay, incentives, or supervisory preparation.
The conditions shown in Figure 11-1 create “line of sight” for development candidates connecting their development, their on-the-job behaviors, improved unit performance, and the overall strategic success of the organization. Consider an illustrative example. In response to a shortage of trained service technicians, Caterpillar, Inc., partnered with a network of vocational schools in six countries to develop a Caterpillar-approved curriculum. This ties the training directly to important business processes that Caterpillar must execute well to achieve its business strategy. Students enter the vocational schools with dealerships already committed to hiring them upon graduation. In fact, the trainees spend up to half of their time in apprenticeships at Caterpillar dealers, learning on the job.16 Dealer (that is, management) support, coupled with rewards for completing the training program (guaranteed jobs), provides the kind of “line of sight” that links strategy, execution, and motivation to do well in training.
At the bottom of Figure 11-1, we connect employee development to several other topics covered in this book. Although the vast majority of attention to valuing employee development has focused on its immediate effects or its effects on job performance, it should also be noted that when employees have more tools and opportunities to perform well, they are often more motivated and engaged with their work. This can lead to reduced turnover and absence. In addition, opportunities for development are increasingly an important part of the “total rewards” proposition that employers offer to the labor market.17 For example, Procter & Gamble is globally known for its effective career and training programs to develop great marketers. GE is well known for the effectiveness of its career and management systems in developing future leaders. Not only do these programs improve the performance of those who directly participate, but they also are powerful attractors to external candidates. Thus, enhanced development can also lead to more and better applicants for employment, which, as you saw in Chapters 8, “Staffing Utility: The Concept and Its Measurement”; 9, “The Economic Value of Job Performance”; and 10, “The Payoff from Enhanced Selection,” is one element of enhanced workforce value through staffing.
The remainder of the chapter focuses on two broad themes:
- Developing a framework that extends the utility-analysis logic we applied to staffing in Chapters 8, 9, and 10 to the evaluation of HRD programs
- Illustrating cost analysis, comparing offsite versus web-based meeting costs
Utility Analysis Approach to Decisions about HRD Programs
Faced with a bewildering array of alternatives, decision makers must select the programs that will have the greatest impact on pivotal talent pools—those where investments in HRD will have the largest marginal impact on activities, decisions, and ultimately, the value created for the firm. Recall that utility analysis specifically incorporates the idea of pivotalness by including the quantity of workers affected by an HR program, as well as SDy, the pivotal value of enhanced worker quality. We saw in Chapters 8–10 that utility analysis is a powerful tool for staffing programs,18 and now we show how it can be used to evaluate proposed or ongoing HRD programs.
The basic difference is that staffing programs create value through the quality of the choices they support regarding who joins. In contrast, programs such as HRD do not change the membership of the workforce. Instead, they change the quality of the intact pool of workers. So instead of deriving changes in quality based on who joins or leaves a workforce, we must derive changes in quality based on the direct effect of a program on the individuals who participate in it.
In the Brogden-Cronbach-Gleser model, the only difference between the basic equation for calculating staffing utility (Equation 8-17 in Chapter 8) and that for calculating utility from HRD programs is that the term dt is substituted for the product rxy × x (that is, the validity coefficient times the average standard score on the predictor achieved by selectees).19 The resulting utility formula is as follows:
11-1.
Here, ΔU is the gain to the firm in monetary units (such as dollars, euros, or yen) resulting from the program, N is the number of employees trained, T is the expected duration of benefits in the trained group, dt is the true difference in job performance between the trained and untrained groups in SD units, SDy is the standard deviation of dollar-valued job performance among untrained employees, and C is the total cost of training N employees.
The parameter dt is the effect size. It reflects the difference in job-relevant outcomes between those who participate in a development opportunity and those who do not. It is expressed in standardized units, just as Z-scores were in the selection utility equation.
To illustrate that idea graphically, we plot the (hypothetical) distribution of job performance outcomes of the trained and untrained groups on the same baseline (expressed in Z-score units, with a mean of 0 and a standard deviation of 1.0), as shown in Figure 11-2.
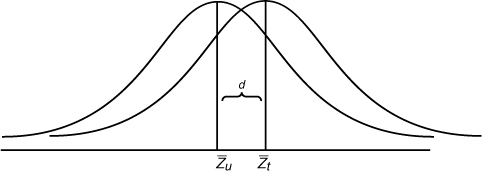
Figure 11-2. Standard score distributions of job performance outcomes among trained and untrained groups.
Note: ![]() is the average job performance score of the untrained group;
is the average job performance score of the untrained group; ![]() is the average job performance score of the trained group; and d is the effect size.
is the average job performance score of the trained group; and d is the effect size.
In Figure 11-2, d represents the size of the effect of the training program. How is d computed? It is simply the difference between the means of the trained and untrained groups in standard Z-score units. This might be the difference in average job performance, time to competency, learning, and so on. Therefore:
11-2.
Here, d is the effect size. If the effect is expressed in terms of job performance, ![]() t is the average job performance score of the trained group,
t is the average job performance score of the trained group, ![]() u is the average job performance score of the untrained group, and SDx is the standard deviation of the job-performance scores of the total group, trained and untrained. If the SDs of the two groups are unequal, the SD of the untrained group should be used because it is more representative of the incumbent employee population.
u is the average job performance score of the untrained group, and SDx is the standard deviation of the job-performance scores of the total group, trained and untrained. If the SDs of the two groups are unequal, the SD of the untrained group should be used because it is more representative of the incumbent employee population.
Hypothetically, suppose that we are evaluating the impact of a training program for quality-control inspectors. Let’s say that job performance is evaluated in terms of a work sample—that is, the number of defects identified in a standard sample of products with a known number (for example, 10) of defects. Suppose the average job performance score for employees in the trained group is 7 and for those in the untrained group is 6.5, and the standard deviation of the job-performance scores is 1.0. Equation 11-3 shows the effect size.
11-3.
In other words, the performance of the trained group is half a standard deviation better than that of the untrained group. Because a perfectly reliable, objective measure of job performance was used in this case, the estimate of d need not be corrected for unreliability. In many, if not most, cases, managers will be using criteria that are less than perfectly reliable, such as supervisory ratings of the job performance of subordinates. In such cases, d must be corrected statistically for unreliability or measurement error in the criterion; otherwise, the estimate will be biased (too conservative).
If supervisory ratings are used as job-performance criteria, reliability probably will be estimated in terms of the extent of inter-rater agreement. A large-sample study that investigated the reliability of ratings of first-level supervisors found that average inter-rater reliabilities were 0.69 and 0.64, respectively, for ratings of supervisory abilities and ratings of the performance of specific job duties.20 Regardless of how the reliability of job performance measures is estimated, Equation 11-4 shows the formula for computing the true difference in job performance between the trained and untrained groups.
11-4.
Alternatively, consider Equation 11-5:
11-5.
All terms are as defined earlier, and is the square root of the reliability of the job performance measure.
To express that difference as a percentage change in output, assuming that performance is measured on a ratio scale, it is necessary to multiply dt by the ratio of the pretest standard deviation to the pretest performance mean (SD/M) × 100.21 Thus, the percentage change in output equals this:
11-6.
Issues in Estimating dt
If an organization already has conducted a training program and possesses the necessary data, it can compute dt on the basis of an empirical study. Pre- and post-measures of job performance in the trained and untrained groups should be collected systematically, with special care taken to prevent the ratings or other measures of job performance from being influenced by knowledge of who has or has not been trained. These are the same kinds of problems that bedevil all HRD evaluation research, not just research on dt. Several thorough treatments of these issues are available.22
When several studies on the same topic have been done, or when dt must be estimated for a new HRD program where there is no existing information, dt is best estimated by the cumulated results of all available studies, using the methods of meta-analysis. We noted earlier that such studies are available in the literature. As studies accumulate, managers will be able to rely on cumulative knowledge of the expected effect sizes associated with proposed HRD programs. Such a “menu” of effect sizes for HRD programs will allow HR professionals to compute the expected utilities of proposed HRD programs before the decision is made to allocate resources to them.
Sometimes the results of evaluation research are presented in terms of statistics such as r, t, or F. Each of these can be transformed into d by means of the following formulas.23 When two groups are compared (and, therefore, df = 1), the F statistic is converted to a t statistic using Equation 11-7.
11-7.
The t-statistic then can be converted into the point-biserial correlation (rpb) between the dichotomous variable (training versus no training) and rated performance using Equation 11-8.
11-8.
Here, Nt is the total number of persons in the study, the sum of the trained and untrained groups.
To transform rpb into d, use Equation 11-9.
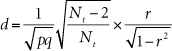
11-9.
Here, p and q are the proportions of the total group in the trained and untrained groups, respectively.
For example, suppose that 100 employees are trained and 100 serve in a control group. Results of training are expressed as F = 6.0, using supervisors’ ratings as criteria (assume that the reliability of the supervisors’ ratings ryy = 0.60). Using Equation 11-7,
t = 2.45
Using Equation 11-8,
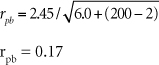
So,
d = 1/0.5 (0.9950)(0.17/0.985)
d = 0.34
Therefore, dt is
Different effect sizes can occur not because training is differentially effective, but because the evaluations differ in breadth of coverage of the outcomes. To be methodologically precise, evaluation should measure only training-related performance.24 Training programs in first-level supervisory skills may encompass a large portion of the supervisor’s job, whereas training programs designed to affect sales of a specific product may influence only a few tasks of a sales representative’s job. In terms of impact, not all elements of the job are equally pivotal.25
Effect sizes measured using specific criteria will usually be larger than those based on a criterion of overall job performance because of the increased precision. When comparisons focus only on the elements that training affects, the observed effects are larger. However, there is a tradeoff. If the outcomes of training are very narrowly defined, a large effect size must be adjusted to reflect the fact that only part of the work outcomes are considered, so the proportion of total work value affected is smaller. At the limit, if training evaluations are so narrowly focused on esoteric training outcomes, even large training effects may be unimportant. Thus, it is vital to match the outcomes used to assess the effects of training to the decision context, and to ensure that training outcomes are comparable to allow meaningful comparisons of effect sizes.26 The value of a change in performance will vary according to the percentage of pivotal tasks measured by criteria.
A large-scale study of the relative effects of HRD interventions in a major U.S.-based multinational firm adjusted overall utility estimates by recalculating the valuation base as the product of the percentage of job skills affected by training and the average full cost of employment. Thus, the utility estimates represented only the value of performance on specific job elements.27
Break-Even Analysis Applied to Proposed HRD Programs
Having determined an expected value of dt, we can use the Brogden-Cronbach-Gleser model (see Equation 11-1 in this chapter) to compute a break-even value of SDy (the value at which benefits equal costs and ΔU = $0.00; see Chapters 2, “Analytical Foundations of HR Measurement,” and 10). For example, suppose that 300 employees are trained, the duration of the training effect is expected to be 2 years, dt = 0.55, and the per-person cost of training is $1,500. Setting ΔU = $0.00 yields the following:
$0.00 = 2(300)(0.55)(SDy) – 300 ($1,500)
SDy = $1,364
Even if dt is as low as 0.10, the break-even value of SDy is still only $7,500, well below the values of SDy typically reported in the literature (for example, $28,000–$39,000 in 2010 dollars). To the extent that precise estimates of dt and SDy are unavailable, break-even analysis still allows a decision maker to use the general utility model to assess the impact of a proposed HRD program. If estimates of dt and SDy are available, utility can be computed, and the expected payoff from the program can be compared with the break-even values for dt or SDy. The comparison of “expected-case” and “worst-case” scenarios thus provides a more complete set of information for purposes of decision making.
Duration of the Effects of an HRD Program
A key parameter in Equation 11-1 is T, the duration of the effect of a training or HRD program. We know that the effects of development will not last forever because the relevance of the learning has a half-life due to changing work situations. In most cases, this parameter is difficult to estimate. One approach that has proven useful is the Delphi method, often used in long-range forecasting. With this method, a group of subject matter experts is asked to provide judgments about the duration of the training effect. Each expert responds individually and anonymously to an intermediary. The intermediary’s task is to collect and summarize the experts’ opinions and redistribute that information back to the experts for another round of judgment. The cycle continues until the experts reach a consensus, often after three or four rounds of judgments.
In practice, we have little knowledge about the duration of training effects. To deal with this issue in the large-scale study described in the previous section, researchers computed break-even values in terms of time. Such values represent the amount of time that the training effect must be maintained for the value of training outcomes to offset the training investment. Across 18 training programs (managerial, sales, and technical), they found great variability in results, with break-even periods ranging from a few weeks to several years. In the extreme, two management-training courses were never expected to break even or to yield a financial gain, because they produced slight decreases in performance; effect sizes were negative. The lesson to be learned from those results is that if we do not understand how long training effects last, we do not really understand the effects of training on organizational performance.
Economic Considerations and Employee Flows Applied to HRD Programs
Because training activities lead to diminishing returns over time (that is, training effects dissipate over time), a utility model that incorporates employee flows should be used to assess the net payoff of the program over time.28 Beyond that, variable costs, taxes, and discounting must be considered to assess correctly the true impact of a proposed or ongoing HRD program. Because we considered these issues in Chapter 10, here we need consider only the summary model that incorporates all of these factors. Then we present a worked example to demonstrate how the utility analysis proceeds. Equation 11-10 shows the model. It is the same model used in Chapter 10, but here we have substituted the true effect size dt for the product of the validity coefficient and standardized average predictor score of selectees that we used in Chapter 10.
11-10.
For purposes of illustration, we adopt the dt value we computed earlier, 0.44. Assume that 100 employees are trained each year for five years and that, for each cohort, the training effect dissipates gradually at the rate of 25 percent annually. No employees separate during this period (therefore, Nst = 0). That information allows us to compute a weighted average dt value for the trained group each year, as a new cohort of trainees is added. Table 11-1 shows the weighted average dt values.
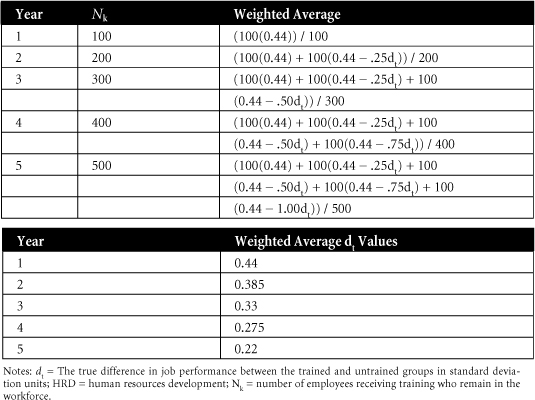
Table 11-1. Diminishing Returns of an HRD Program over Five Years
To use Equation 11-10, assume that SDy = $30,000, variable costs (V) = –0.10, the tax rate is 45 percent, and the discount rate is 8 percent. Because costs ($1,000 per person) are incurred in the same period that benefits are received, we use k as the exponent in the cost term in Equation 11-10. The total payoff of the HRD program is the sum of the utilities of each of the five periods:
ΔU1 = 100(0.926)(0.44)($30,000)(0.90)(0.55) – $100,000(0.55)(0.926)
ΔU1 = $554,118
ΔU2 = 200(0.857)(0.385)($30,000)(0.90)(0.55) – $100,000(0.55)(0.857)
ΔU2 = $932,802
ΔU3 = 300(0.794)(0.33)($30,000)(0.90)(0.55) – $100,000(0.55)(0.794)
ΔU3 = $1,123,629
ΔU4 = 400(0.735)(0.275)($30,000)(0.90)(0.55) – $100,000(0.55)(0.735)
ΔU4 = $1,160,198
ΔU5 = 500(0.681)(0.22)($30,000)(0.90)(0.55) – $100,000(0.55)(0.681)
ΔU5 = $1,074,959
The sum of those one-period utility estimates is $4,845,706. This is the total expected payoff of the HRD program over the five-year period.
Example: Skills Training for Bankers
The utility-analysis concepts discussed thus far were illustrated nicely in a study of the utility of a supervisory skills training program applied in a large commercial bank.29 The study incorporated the following features:
• Training costs were tabulated using cost-accounting techniques.
• The global estimation procedure was used to estimate SDy.
• Pre- and post-training ratings of the job performance of (non–randomly assigned) experimental- and control-group subjects were compared to determine dt.
• Utility-analysis results that included adjustments for economic factors (discounting, variable costs, and taxes) were compared to unadjusted utility results.
• Break-even analysis was used to assess the minimum change in SDy required to recoup the costs invested in the program.
• The effect on estimated payoffs of employee flows, decay in training effects, and employee turnover was considered explicitly.
Results showed that the training program paid off handsomely over time, even under highly conservative assumptions. Training 65 bank managers in supervisory skills produced an estimated net payoff (after adjustment for the economic factors noted earlier) of $79,000 (all figures in 2010 dollars), and $338,736 by Year 5. Not surprisingly, the reductions in value associated with adjusting for economic factors tended to become greater the farther in time they were projected. In general, however, utility figures adjusted for economic factors were 60–80 percent smaller than unadjusted figures.
When break-even analysis was used, even assuming a 25 percent yearly reduction in the strength of the training effect, break-even values of SDy were still less than 50 percent of the values used in the utility analysis. Finally, in terms of employee flows, the economic impact of training additional groups was also considerable. For example, the estimate for the tenth year of the utility of training 225 employees in the first five years was more than $830,000 (in 2010 dollars), even after adjustment for economic factors. Information such as this is useful to decision makers, whether the focus is on the broad allocation of organizational resources across functional lines or on the choice of specific HR programs from a larger menu of possible programs.
Costs: Off-Site Versus Web-Based Meetings
Having illustrated methods and technology for assessing the value of employee-development efforts, this final section of the chapter focuses on identifying costs—specifically, the costs of offsite versus web-based meetings. Given the wide proliferation and continued growth of Internet-based technologies, many organizations have opted for a web-based or off-site approach to cut costs. What follows is a general costing framework that can be applied to many types of training and that can be used to compare relative costs.
Off-site meetings conducted away from organizational property are useful for a variety of purposes: for conducting HRD programs, for communicating information without the interruptions commonly found at the office, for strategic planning, and for decision making. In many cases, however, the true costs of an off-site meeting remain unknown because indirect attendee costs are not included along with the more obvious direct expenses. The method described here enables planners to compute the actual costs of each type of activity in an off-site meeting.30 Then we consider web-based meeting costs.
We make the following assumptions about a hypothetical firm, Valco, Ltd. The firm has 500 employees, including 100 first-line supervisors and managers. Under the general planning and direction of Valco’s training department (one manager and one secretary), Valco holds a total of ten days of off-site meetings per year (either training sessions or various types of meetings for managers). The firm retains outside speakers and consultants to develop and conduct the meetings. On the average, 20 managers attend each meeting, and the typical meeting lasts two full days.
Costs shown in Table 11-2 are based on those figures. The estimates we are using here are broad averages intended only to create a model for purposes of comparison. Note that, in this example, we make no attempt to place a monetary value on the loss of productive time from the job, although, if it is possible to estimate such costs reliably, do include them in the calculations. As with the illustrations in other chapters, we have attempted to make the numbers as realistic as possible, but the primary concern should be the methodology rather than the numbers.
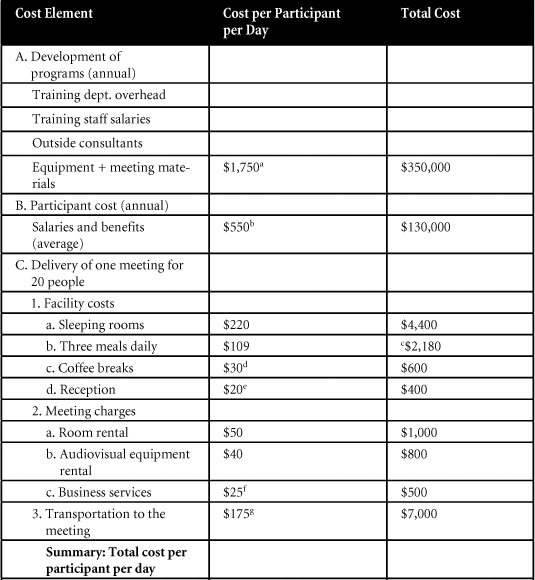

Table 11-2. Costs of an Off-Site Management Meeting
As you can see in Table 11-2, the per-day, per-person cost of Valco’s meeting comes to $2,969. Actually, that figure probably does not represent the true cost of the meeting, because no distinction is made between recurring and nonrecurring costs.31
During the development of a program, organizations absorb nonrecurring costs such as equipment purchases and training designers’ salaries. Recurring costs absorbed each time a program is presented include session expenses, such as facilities and trainers’ salaries, and costs that correspond to the number of participants in a program, such as training materials and trainees’ salaries.
Separating costs into categories allows each set of costs to be incorporated into utility calculations for the time period in which each expense is incurred. Thus, the high initial expenses associated with a program may indicate that costs exceed benefits for some period of time or over a certain number of groups of trainees. However, at some point, an organization may begin to derive program benefits that signal the beginning of a payback period. Separating costs from benefits helps decision makers clarify information about the utility of HR programs and return on investment.32 This is as important for off-site meetings as it is for web-based ones.
Web-based meetings incur all the costs shown in Table 11-2, with the exception of sleeping rooms (item 1a), the reception (item 1d), meeting charges (items 2a, b, and c), and transportation to the meeting (item 3). However, a premises-based license for web-based conferencing typically costs at least $1,000 per year for unlimited usage.33 Moreover, the emerging generation of unified communications platforms featuring integrated instant messaging, e-mail, video, and audio tools is making it easier for geographically dispersed attendees to exploit the full range of media.34
The very highest-level videoconferencing systems, such as Hewlett-Packard’s Halo Collaboration Studio, Polycom’s RPX product, and Cisco’s Telepresence Meeting solution, include a set of technologies that allow people to feel as if they are present at a remote location, a phenomenon called telepresence.35 To achieve the illusion that all attendees are in the same room, each vendor makes its videoconferencing rooms look alike, using the same semicircular conference tables illuminated by the same type of light bulbs and surrounded by identical wall colors. Participants appear as life-size images and sit at the table facing video displays, which have cameras set just above or around the screen.36
Telepresence systems are not cheap. HP’s system can cost as much as $350,000, plus $18,000 a month per conference room for operating costs. Cisco’s TelePresence System 3200 product costs $340,000 for the hardware itself (rich audio, high-definition video, and interactive elements), plus $40,000 for planning and design, plus $3,500 a month for maintenance. Those costs will likely limit the use of telepresence systems to large, deep-pocketed organizations. At the same time, however, IDC forecasts that the number of telepresence systems shipped annually will grow from 4,000 in 2009 to more than 49,000 in 2014 and will reach a global installed base of 127,000 systems by 2015.37
Why do so many meetings still occur in person all over the globe every year? Perhaps because 64 percent of communication is nonverbal,38 and most lower-end web-based conferencing systems lose those cues. Hence, many organizations feel that there is no substitute for face-to-face contact and the opportunity for interpersonal interaction. The influence of the environment on training cannot be minimized. The task for decision makers is to consider whether facility costs or web-based conferencing costs as a percentage of the total of the true meeting costs identified will or will not be offset by a corresponding increase in learning effectiveness. Only by considering all the factors that have an impact on learning effectiveness—program planning and administration, the quality of the trainer, program delivery, and learning environment—can we derive the greatest return, in time and dollars spent, on this substantial investment in people.
Process: Enhancing Acceptance of Training Cost and Benefit Analyses
The total cost of evaluating 18 training programs in the multinational firm we described earlier in the chapter was approximately $765,000 (in 2010 dollars).39 That number may seem large until you consider that, during the time of the study, the organization spent more than $368 million on training. Thus, the cost of training evaluation was roughly 0.2 percent of the training budget during this time period. Given expenditures of such magnitude, some sort of accountability is prudent.
To enhance managerial acceptance, the researchers presented the utility model and the procedures that they proposed to use to the CEO, as well as to senior strategic planning and HR managers, before conducting their research. They presented the model and procedures as fallible but reasonable estimates. The researchers noted that management preapproval prior to actual application and consideration of utility results in a decision-making context is particularly important when one considers that nearly any field application of utility analysis will rely on an effect size calculated with an imperfect quasi-experimental design. (See Chapter 2 for more on quasi-experimental designs.)
Conclusion
One of the important lessons to be learned from the material presented in this chapter is that methods are available now for estimating the costs and benefits of HRD programs (proposed, ongoing, or completed). Instead of depending on the power of persuasion to convince decision makers of the value of HRD programs, HR professionals can, by the use of cost-benefit models, join with the other functional areas of business in justifying the allocation of scarce organizational resources on the basis of evidence rather than on beliefs.
Exercises
Software to calculate answers to one or more exercises below is available at http://hrcosting.com/hr/.
- Jane Burns, an HR analyst for Standard City, USA, knows that SDy for firefighters in her city is $28,000. The fire department has asked the city to provide training in team building for 500 of its employees, at a cost of $2,500 per employee. The effects of this organization-development effort are expected to last for two years. Using Equation 11-1, compute the break-even value for dt necessary for the city to recoup the costs of the program.
- Suppose, in Exercise 1, that you have just read a meta-analysis of team-building studies and know that the cumulated estimate of dt is 0.45. Compute an expected utility for the program and compare it to the break-even value you identified earlier. How might this affect the chances that the project will be funded?
- With regard to Exercise 2, suppose that the discount rate is 10 percent and variable costs are –0.10. The city is not taxed. How do these factors affect the estimate of expected utility that you developed in Exercise 2?
- Pilgrim Industries, a 2,000-employee firm with 400 managers, holds 40 days of off-site meetings per year. Outside consultants develop and conduct the meetings, and, on average, 20 managers attend each meeting. The typical meeting lasts two full days. Last year, total program-development costs consumed $350,000. The average attendee’s salary (plus benefits) was $70,000. To deliver each two-day meeting for 20 people, sleeping accommodations, food, telephone, and a cocktail reception cost $10,000. In addition, transportation, business services, a meeting room, and audiovisual equipment rental totaled another $11,000. Determine the total per-day, per-person cost of one off-site meeting.
- Pilgrim’s CEO has heard about the remarkable quality of telepresence web-based conferencing systems, and she has asked you to prepare a per-person, per-day cost comparison of an off-site meeting versus a web-based conference for a two-day meeting. You calculated the per-person, per-day cost of an off-site meeting in Exercise 4. What costs must you consider with respect to a web-based system? Would you want any other information before recommending one alternative over the other?
1. Levering, R., and M. Moskowitz, “100 Best Companies to Work For,” Fortune (February 2, 2009), 67–78. See also Cascio, W. F., and H. Aguinis, Applied Psychology in Human Resource Management, 7th ed. (Upper Saddle River, N.J.: Prentice Hall, 2011).
2. Ibid. See also Noe, R. A., Employee Training and Development, 5th ed. (Burr Ridge, Ill: McGraw-Hill, 2009).
3. Ibid. See also Goldstein, I. L., and J. K. Ford, Training in Organizations: Needs Assessment, Development, and Evaluation, 4th ed. (Belmont, Calif.: Wadsworth, 2002); and Kraiger, K., “Perspectives on Training and Development,” in Handbook of Psychology: Vol. 12, Industrial and Organizational Psychology, ed. W. C. Borman, D. R. Ilgen, and R. J. Klimoski (Hoboken, N.J.: Wiley, 2003).
5. O’Leonard, K., The Corporate Learning Factbook 2010: Benchmarks, Trends, and Analysis of the U. S. Training Market (San Francisco: Bersin & Associates, 2010); Noe, R. A., Employee Training and Development, 5th ed. (Burr Ridge, Ill.: McGraw-Hill, 2009); Jana, R., “On-the-Job Video Gaming,” BusinessWeek (March 27, 2006): 43; and Brown, K. G., and J. K. Ford, “Using Computer Technology in Training: Building an Infrastructure for Active Learning,” in Creating, Implementing, and Managing Effective Training and Development, ed. K. Kraiger (San Francisco: Jossey-Bass, 2002).
6. Mattioli, D., “Training, Amid Cutbacks,” The Wall Street Journal (February 10, 2009), 17.
7. Avolio, B. J., J. J. Sosik, D. I. Jung, and Y. Berson, “Leadership Models, Methods, and Applications,” in Handbook of Psychology 12, ed. W. C. Borman, D. R. Ilgen, and R. J. Klimoski (Hoboken, N.J.: Wiley, 2004), 277–307.
9. Arthur, W. Jr., W. Bennett, Jr., P. S. Edens, and S. T. Bell, “Effectiveness of Training in Organizations: A Meta-analysis of Design and Evaluation Features,” Journal of Applied Psychology 88 (2003): 234–245. See also Burke, M. J., R. R. Day, “A Cumulative Study of the Effectiveness of Managerial Training,” Journal of Applied Psychology 71 (1986): 232–245; Guzzo, R. A., R. D. Jette, and R. A. Katzell, “The Effects of Psychologically-Based Intervention Programs on Worker Productivity: A Meta-analysis,” Personnel Psychology 38 (1985): 275–291; and Morrow, C. C., M. Q. Jarrett, and M. T. Rupinski, “An Investigation of the Effect and Economic Utility of Corporate-wide Training,” Personnel Psychology 50 (1997): 91–129.
10. Bassi, L., P. Harrison, J. Ludwig, and D. McMurrer, “The Impact of U.S. Firms’ Investments in Human Capital on Stock Prices” (June 2004), whitepaper downloaded from www.mcbassi.com, May 1, 2010.
11. Bassi, L., and D. McMurrer, “How’s Your Return on People?” Harvard Business Review 82 (March 2004), downloaded from www.HBR.org, May 1, 2010.
12. Bassi, L., and D. McMurrer, “Training Investments As a Predictor of Banks’ Subsequent Stock-Market Performance” (February 2009), whitepaper downloaded from www.mcbassi.com, May 1, 2010.
13. Bassi, Harrison, Ludwig, and McMurrer, 2004.
14. Cascio and Aguinis, 2011. See also Shadish, W. R., T. D. Cook, and D. T. Campbell, Experimental and Quasi-Experimental Designs for Generalized Causal Inference (Boston: Houghton Mifflin, 2002).
15. Boudreau, J. W., and P. M. Ramstad, Beyond HR: The New Science of Human Capital (Boston: Harvard Business School Publishing, 2007).
16. Coy, P., and J. Ewing, “Where are all the workers?” BusinessWeek (April 9, 2007), 28–31.
17. WorldatWork Total Rewards Model, downloaded June 11, 2010 from www.worldatwork.org/waw/aboutus/html/aboutus-whatis.html#model.
18. See, for example, Sturman, M. C., C. O. Trevor, J. W. Boudreau, and B. Gerhart, “Is It Worth It to Win the Talent War? Evaluating the Utility of Performance-Based Pay,” Personnel Psychology 56 (2003): 997–1035. See also Mabon, H., “The Cost of Downsizing in an Enterprise with Job Security,” Journal of Human Resource Costing and Accounting 1, no. 1 (1996): 35–62; and Mabon, H., and G. Westling, “Using Utility Analysis in Downsizing Decisions,” Journal of Human Resource Costing and Accounting, 1, no. 2 (1996): 43–72.
19. Schmidt, F. L., J. E. Hunter, and K. Pearlman, “Assessing the Economic Impact of Personnel Programs on Workforce Productivity,” Personnel Psychology 35 (1982): 333–347.
20. Rothstein, H. R., F. W. Erwin, F. L. Schmidt, W. A. Owens, and C. P. Sparks, “Biographical Data in Employment Selection: Can Validities Be Made Generalizable?” Journal of Applied Psychology 75 (1990): 175–184.
21. Sackett, P. R., “On Interpreting Measures of Change Due to Training or Other Interventions: A Comment on Cascio (1989, 1991),” Journal of Applied Psychology 76 (1991): 590, 591.
22. Cascio and Aguinis, 2011; Shadish et al., 2002; and Goldstein and Ford, 2002.
24. Campbell, J. P., “Training Design for Performance Improvement,” in Productivity in Organizations, ed. J. P. Campbell and R. J. Campbell (San Francisco: Jossey-Bass, 1988).
25. Boudreau and Ramstad, 2007.
28. Boudreau, J. W., “Effects of Employee Flows on Utility Analysis of Human Resource Productivity Improvement Programs,” Journal of Applied Psychology 68 (1983): 396–406.
29. Mathieu, J. E., and R. L. Leonard, Jr. “Applying Utility Concepts to a Training Program in Supervisory Skills: A Time-Based Approach,” Academy of Management Journal 30 (1987): 316–335.
30. The method is based on McKeon, W. J., “How to Determine Off-site Meeting Costs,” Training and Development Journal 35 (May 1981): 126–122.
31. Mathieu and Leonard, 1987.
33. “Comparison of the Pricing and License Models for the 5 Best Web Conferencing Systems, Online Meeting Tools Review, downloaded June 9, 2010 from www.webconferencingtest.com/en/webconferencing_top5/webconference_pricing.html.
34. Murray, J. “Poor Comms Management Harms Virtual Teams,” IT Week (September 20, 2006), downloaded from www.computing.co.uk/itweek/news/2164621/poor-comms-management-harmswww.itweek.co.uk.
35. Wikipedia, “Telepresence,” 2010, at http://en.wikipedia.org/wiki/Telepresence.
36. “Polycom Delivers Lowest Telepresence Total Cost of Ownership Versus Competitors” (June 7, 2010), downloaded from www.polycom.com/products/telepresence_video/telepresence_solutions/index.html, June 9, 2010; “What’s the Full Cost of Cisco Telepresence?” (May 19, 2008), downloaded from www.networkworld.com/community/node/27923, June 8, 2010; “Grappling with Cisco TelePresence, HP Halo Drops Pricing under Half a Million” (February 25, 2008), downloaded from www.networkworld.com/community/node/25356, June 9, 2010; and Lee, L. “Cisco Joins High-End Videoconference Fray,” BusinessWeek (October 25, 2006), www.businessweek.com/print/technology.
37. Edwards, J., “Understanding the Spectrum: Videoconferencing to Telepresence Solutions,” IDC whitepaper (May 2010), downloaded from www.cisco.com/en/US/prod/collateral/ps7060/idc_vc_to_tp_spectrum.pdf, August 10, 2010.
38. Pearn-Kandola, The Psychology of Effective Business Communications in Geographically Dispersed Teams (San Jose, Calif.: Cisco Systems, 2006).