
5. Financial Statements as a Window into Business Strategy
When looking at financial statements, the challenge for most people is to not fail to see the forest for the trees. Can a corporation’s balance sheet and income statement provide clues not only about its financial performance, but also about its business and financial strategy? Try an exercise to see how far you can get. The income statements and balance sheets in Exhibits 5-1 and 5-2 describe real companies that you’re probably familiar with. For the moment, however, the names are withheld to see how much you can learn about each of them just by looking at the numbers in their financial statements. Suppose as an experienced HR executive, you have been asked to recommend which company’s management team deserves a bigger performance bonus. Chapter 12, “Creating Value and Rewarding Value Creation,” discusses in more detail the selection and construction of bonus drivers, but for the purpose of this exercise, you will use only some simple financial ratios.
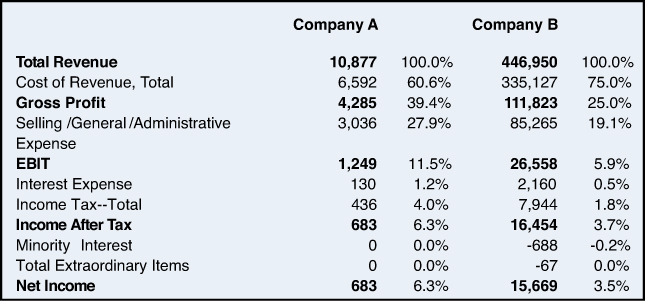
Exhibit 5-1. Income statements for companies A and B
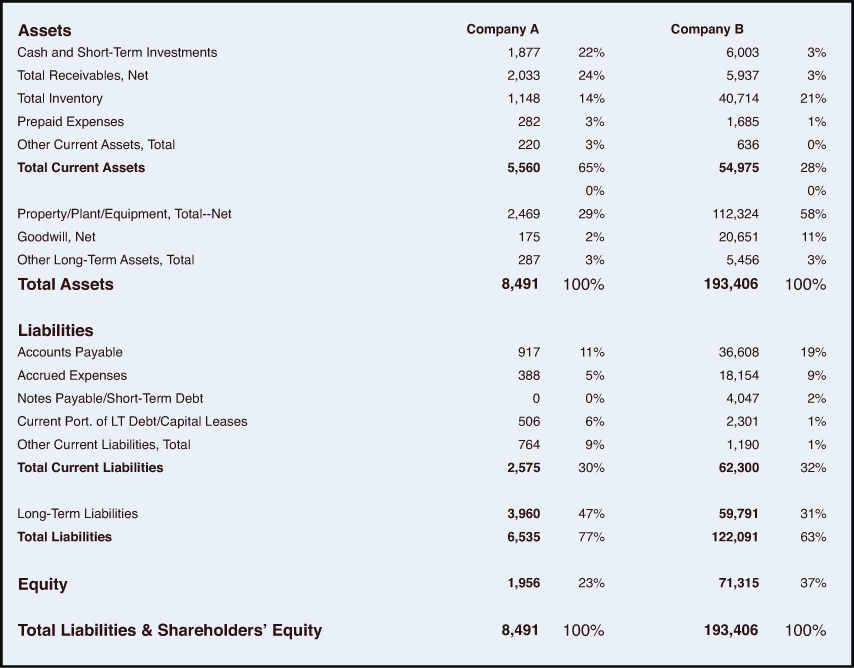
Exhibit 5-2. Balance sheets for companies A and B
Common Size Financial Statements
It’s immediately obvious that Company B has much larger sales revenue and profits. You can assume, however, that the size difference between these two organizations is reflected in the base salaries of the two management teams. The challenge is to recommend which team should get the larger performance bonus, perhaps as a percentage of its base salary. To control for the size difference between the two firms, you can calculate common size income statements and balance sheets (refer to Exhibits 5-1 and 5-2). The common size income statements simply express all entries as a percentage of top-line sales revenue. The common size balance sheets simply express each asset category as a percentage of total assets and each component of liabilities and shareholders’ equity as a percentage of the total liabilities and shareholders’ equity.
Profit Margin
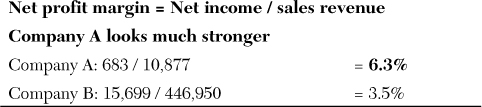
You might start your analysis by comparing the two firms on net profit margin. On this measure Company A looks stronger. For every $100 in sales revenue, Company A ended up with $6.30 of bottom line net income. Company B generated only $3.50 of bottom line net income from every $100 in sales revenue. If you recommend that bonuses be distributed in proportion to the net profit margin, Company A managers will receive bonuses almost twice as large as those received by the team at Company B.
Return on Assets
In addition to looking at profit as a percentage of sales revenue, you could calculate profit as a percentage of the assets used to generate that profit. Maximizing the profit they can earn given the bundle of assets they have to work with is a key economic goal of any management team. If you recommend that bonuses be distributed in proportion to return on assets, the teams in both companies would receive similar bonuses. There is no significant difference between the two companies on this measure.

Asset Turnover
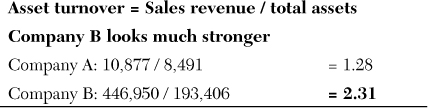
Clearly, it is going to make a big difference which bonus driver you choose. The question you may be asking yourself is, “How could two companies be so different on net profit margin and so similar on return on assets?” To answer that question you probably need to calculate one more ratio. The ratio defined as sales revenue divided by total assets is sometimes referred to as asset turnover. This is the first measure on which Company B’s performance is the stronger one. Company B generated $2.31 in sales revenue for every $1 of assets it had to work with. Company A generated only a $1.28 in sales revenue for every $1 of assets. If bonuses are distributed based on asset turnover, the Company B team would receive bonuses almost twice as large as those received by its counterparts in Company A.
Connecting the Dots
So what are you going to recommend? On the first measure, Company A looks better. On the second measure, there is no real difference between the two firms. On the third measure, Company B looks better. To make sense of this information, you need to ask what business scenario explains this constellation of data points. Perhaps it can help to recognize that Return on Assets = Profit Margin × Asset Turnover, as shown in Exhibit 5-3. When you multiply the fractions on the right side of this equation, the two sales terms cancel, and you are left with NI over assets, which is ROA (return on assets). This equation is simply saying that ROA, the net income a company earns on each dollar of assets, is equal to the profit it makes on every dollar of sales revenue, times the number of sales dollars it can generate with each dollar of assets. You can now see that Company A and Company B achieved almost exactly the same ROA through two different business strategies. The Company A data suggests a high-margin, low-volume business strategy. The Company B data is consistent with a low-margin, high-volume business strategy. Company B made much less profit on each dollar of sales but offset that by generating more sales per dollar of assets.
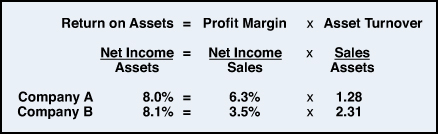
Exhibit 5-3. The determinants of ROA
Return on Equity
You have now figured out how these two firms could be so different in profit per dollar of sales while so close in profit per dollar of assets. Company A offset its lower margins with higher volumes. There is, however, an additional performance measure that you should consider: profit per dollar of shareholders equity. This measure shows how much profit is earned for every dollar shareholder investment.
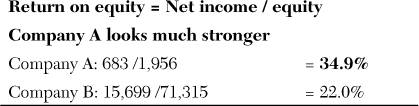
If performance is judged on this measure of ROE, Company A looks much stronger. This raises a new question. How can two companies be so similar on ROA yet so different when it comes to return on equity (ROE)? The equation in Exhibit 5-4 provides the answer.
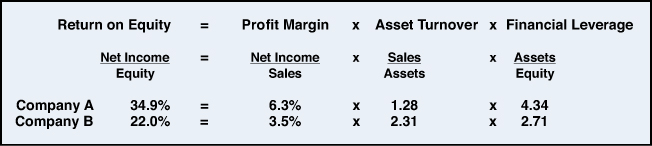
Exhibit 5-4. The determinants of ROE
The first two terms on the right side of this equation are exactly the ones you used to calculate the ROA. The additional term on the right side is a measure of financial leverage, calculated as the ratio of assets to equity. Company A’s assets to equity ratio of 4.34 suggests that for every $1.00 of equity, the company borrowed an additional $3.34. Company B’s assets to equity ratio of $2.71 suggests that for every $1.00 of equity that company borrowed $1.71. When you multiply the fractions on the right side of this equation, the two sales terms cancel, the two assets terms cancel, and you are left with net income over equity, which is ROE. This equation is simply saying that ROE, the net income a company earns on each dollar of equity, is equal to the profit it makes on every dollar of assets multiplied by the amount of assets it has per dollar shareholder investment. As explained in Chapter 3 (“The Balance Sheet: If Your People Are Your Most Important Asset, Where Do They Show Up on the Balance Sheet?”), whenever you see a company whose ROE is different from its ROA, that difference is the result of financial leverage. When the ROE is greater than the ROA, the financial leverage was beneficial, that is, the company earned more on the borrowed money than it cost to borrow it. When the ROE is less than the ROA, the financial leverage turned out to be detrimental, that is, the company earned less on the borrowed money than it cost to borrow it. The larger the amount of financial leverage (that is, borrowing), the larger these beneficial or harmful effects can be.
Differential Impact of Financial Leverage
The impact of financial leverage was beneficial at both of these firms. Company B’s ROE of 22% was well above its ROA of 8.1%. There was even a larger difference between Company A’s ROE of 34.9% and its ROA of 8.0%. Company A had the bigger benefit from financial leverage because it engaged in more borrowing. That can be confirmed by referring to Company A’s higher assets to equity ratio in Exhibit 5-4. The first two terms on the right side of the equation are the components ROA. The third term on the right side of this equation is the leverage multiplier. The larger it is, the more borrowing there has been, and the larger the impact of financial leverage will be. You’ve now figured out how the two companies could have similar ROAs but such different ROEs. The explanation is that Company A was much more highly leveraged.
It is interesting to note that in percentage terms Company A has both borrowed more from others and has more owed to them. The accounts receivable number shown on Company A’s balance sheet (2,033) is equal to 19% of the top-line sales number on its income statement (10,877). The comparable percentage for Company B is only 1%. It appears that Company A makes much greater use of credit sales.
The Big Picture
By reviewing their financial statements, and without relying on any external information, you got clues about the business strategies and the financial strategies of these two firms. Company A appeared to have a high-margin, low-volume business strategy. Company B appeared to employ a low-margin, high-volume strategy. Company A’s financial strategy appeared to depend upon a far greater amount of financial leverage. The data in Exhibits 5-1 and 5-2 is real and was excerpted from the March 2012 10-K filings of two well-known retailers. The figures are in millions of U.S. dollars. That information is probably enough for you to identify Company B with 2011 sales revenues of just under $447 billion as Wal-Mart Stores, Inc. Company A is Nordstrom, Inc. Now that you know who these two companies are, you can see that your speculations based on their financial statements were accurate. Wal-Mart’s low-margin, high-volume strategy is widely understood and has been hugely successful. During 2011 Nordstrom matched Wal-Mart’s ROA through a quite different high-margin, low-volume strategy. Nordstrom is willing to compromise some market share to focus on the subset of consumers who are willing to pay a premium price for its differentiated merchandise and its higher level of customer service. If the objective were to reward operating managers in proportion to the success of their 2011 business operations, managers at both the firms should probably receive similar bonuses. Both firms achieved the same ROA but through different business strategies.
Even though their operating performances as measured by ROA were similar, Nordstrom (Company A) had a greater ROE; that is, it earned more profit per dollar shareholder investment. Nordstrom’s larger ROE was the result of its financial strategy, not the result of a stronger operating performance. Financial strategy decisions are typically made at corporate headquarters, and ROE is therefore usually not an appropriate measure to gauge the performance of divisional or operating managers. The difference between a firm’s ROE and its ROA could be an important factor when evaluating the performance of the CFO or the CEO. Remember, however, that although greater financial leverage may boost a firm’s ROE, it also makes the firm riskier. You must carefully assess whether the increase in the ROE is large enough to justify taking on that additional risk. In the previous example, you saw that Nordstrom was both more highly leveraged (it borrowed more) and had much more owed to them (that is, much higher receivables on its balance sheet). The explanation is that Nordstrom is one of the few U.S. retailers that still own its credit card receivables. Nordstrom’s wholly owned federal savings bank, Nordstrom FSB, provides a private label credit card, two Nordstrom VISA credit cards, and a debit card. Nordstrom’s financial statements reflect the combination of retail businesses that are typically only moderately leveraged and banking operations that are typically more highly leveraged.
The Link Between HR Strategy and Business Strategy
Becker, Huselid, and Beatty in their excellent book, The Differentiated Workforce1 explain how the HR strategies at Wal-Mart and Nordstrom are aligned with the business strategies that you uncovered through a review of their financial statements. At both firms HR strategy is focused on attracting, developing, and retaining exceptionally talented individuals to occupy those key positions that are most critical to maintaining the firm’s strategic capabilities. They explain that at Nordstrom these individuals are the personal shoppers that shape the customer experience, and that at Wal-Mart they are the distribution and logistics specialists that enable the firm’s operating processes to work so efficiently.
Remember this was only an exercise used to demonstrate how you can extract clues about both business strategy and financial strategy from a review of a firm’s income statement and balance sheet. A more detailed discussion of selecting bonus drivers is contained in Chapter 12. However, one key take away from the previous example should be that a firm’s ROA is always a function of its profit margin and asset turnover. When a firm selects a business strategy, it makes a statement about the combination of profit margin and asset turnover that it believes can maximize its ROA. HR strategy including employee selection and employee compensation should be tailored to support the firm’s business strategy. Those business strategies can differ between firms and even between different divisions of the same firm. For example, Tiffany and Company has one division that manufactures and sells finished jewelry and another division that imports and distributes loose diamonds. Both divisions have the same economic goal, to maximize ROA, the profit earned on the assets invested in that division. The strategies it utilizes to pursue this goal are, however, polar opposites. The finished jewelry division pursues a high-margin strategy. This division’s products are differentiated from the competition not only by the quality of the materials and workmanship, but also by the Tiffany and Company brand. This division believes its brand is its single-most important asset2 and targets a market niche that pays a premium for its differentiated product.
Branding is much less important in the loose diamond division because a loose diamond of a given size and quality has the same value whether distributed by Tiffany or any other firm. Product differentiation is not practical in this market. This division pursues a low-margin strategy. Its approach is to employ competitive, not premium, pricing and to seek the largest share possible of the diamond importation and distribution business. If Tiffany is going to be successful in this market, it will be because of the scale and efficiency of its operations. If you are the SVP of HR at Tiffany’s, you don’t want to evaluate the financial statements of these two divisions without an understanding of these differences in business strategies. It would be foolish to deny bonuses to managers in the loose diamond division because they did not achieve profit margins comparable to those earned in the finished jewelry division, or to criticize the managers in the finished jewelry division because they did not match the market share of the loose diamond division.