2. The Income Statement: Do We Care About More Than the Bottom Line?
Suppose you resign from your corporate HR position and use your life savings, say $1,000,000, to start your own headhunting firm. One year later, what are the financial questions that you will be asking? Perhaps number one on your list will be, “Did your firm make a profit?” In addition to profitability you will want to know about the financial condition of your business, that is, “Will your firm have the financial strength to ride out difficult economic conditions should you encounter them?” Or on the flipside, “Will your firm have the financial strength to take advantage of any attractive expansion opportunities?” A third question you will no doubt ask is, “What rate of return are you earning on your $1,000,000 investment?” Could you have earned a comparable or better return from an alternative investment, perhaps one that was less much risky than starting up a small business? Your accountant may point out to you that you should be closely monitoring your firm’s cash flow from operations. What’s the difference between cash flow and profit? Why is cash flow even important as long as you make a profit large enough to give you a good return on your investment? The questions you would want answered as the owner of a small privately held business are the same ones that the CEOs, CFOs, and other executives of large corporations worry about. How close can the standard financial statements come to providing useful answers to these questions?
It has become a cliché to say that trying to manage a business based on its financial statements is like trying to drive a car by looking in the rear view mirror. That criticism is a bit too simplistic. A driver cannot plan his route forward without knowing where he is now and how much gas he has in the car. Financial statements tell you where you are now and what resources you can draw upon to move forward. Furthermore, a key component of strategic planning is almost always a forecast of what future financial statements would look like under different business scenarios. In addition to these internal uses, financial statements are a primary mechanism through which external constituencies (for example, stockholders, bondholders, financial analysts, banks, partners, suppliers, customers, competitors, and prospective employees) form opinions about a firm. It’s hard to overstate the importance of financial statements. That doesn’t mean that the standard financial statements (the balance sheet, the income statement, the statement of cash flows, and statement of retained earnings) don’t have significant weaknesses and limitations. However, understanding those limitations makes them more, not less, useful. Financial metrics are also more valuable when combined with nonfinancial measures such as customer satisfaction, product quality, product innovation, process efficiency, and the ability to attract and retain highly talented employees.
The following sections discuss the interpretation and analysis of the basic financial statements using as examples data from the Securities Exchange Commission (SEC) filings by the nation’s largest home improvement retailer Home Depot, Inc., and its major competitor Lowe’s Companies, Inc. This chapter looks at income statements. The income statements show profit as the amount by which revenues exceed expenses. The next two chapters focus on the balance sheet and cash flow statement. A balance sheet provides an indication of a company’s financial strength by comparing the amount the company owns (assets) to the amount it owes (liabilities). Annual cash flow statements provide a comparison of the amount of cash coming in during the year and the amount paid out during that period. A key objective of these chapters is to help the reader understand how net cash flow differs from net profit.
Income Statements
Income statements are sometimes referred to as an Earnings Statement, Statement of Operations, Profit and Loss Statement, or P&L Statement. No matter how complex the corporation may be, the logic of an income statement can be nothing more than Revenues minus Expenses = Profits. Exhibit 2-1 presents Home Depot’s income statement for the 2011 fiscal year. Perhaps the first thing you notice is that Home Depot’s top-line sales revenue grew by a modest 3.5%, whereas its bottom line net income grew by a substantial 16.3%. How can profits grow so much faster than sales? Before getting into that analysis, review the definition of each of the components shown on an income statement.
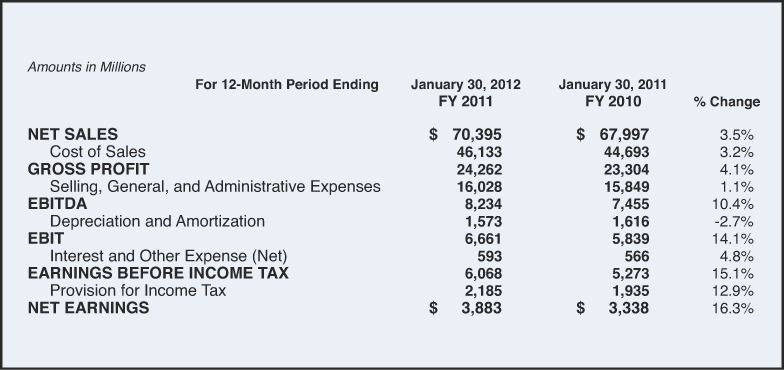
Exhibit 2-1. The Home Depot, Inc., and subsidiaries consolidated statement of earnings
Source: Form 10-K filed with U.S. Securities Exchange Commission on 3/22/2012, page 30.
Sales Revenue
When analysts speak about a company’s top-line growth, they are referring to growth in the dollar value of sales, which is the top line of the income statement. The top line of Home Depot’s fiscal year (fy) 2011 income statement shows sales of just under $70.4 billion, up 3.5% from fy2010. As is typically done, the top line in the Home Depot income statement is labeled Net Sales, indicating that this number is net of (that is, after subtracting out) any discounts off of list price, sales returns, or other deductions from the original sale price. Sales taxes are also not included in this number. You must remember that Home Depot, like all major corporations, uses the accrual method of accounting. That means they assign (accrue) revenues and expenses to particular time periods using the following logic. Revenues for a specific time period, say fy2011, are the revenues earned during that year regardless of whether Home Depot has collected the cash from those sales. Any amounts that remain uncollected at the end of the year show up as Accounts Receivable on the balance sheet (see Exhibit 3-1).
Cost of Goods Sold
The first category of expenses subtracted out on an income statement is the cost of the merchandise sold during that period. The cost of the merchandise sold by Home Depot in fy2011 was $46.1 billion. Remember that is what it cost Home Depot to purchase this merchandise from its suppliers, not the price Home Depot charged its customers when this merchandise was resold. The accrual accounting method requires that the expenses subtracted out on the fy2011 income statement be those expenses, and only those expenses, that were necessary to generate Home Depot’s fy2011 revenues. The amount of merchandise Home Depot purchases from its suppliers in a given year can be either more or less than the amount it actually sells in that year. The amount subtracted on its income statement will always be the cost of the merchandise sold that year. For example, if in a given year Home Depot purchased merchandise costing $50 billion but sold merchandise only costing $45 billion, a $45 billion cost of goods expense would be subtracted on its income statement. Inventory levels shown on its balance sheet would increase by $5 billion. In a year when year Home Depot purchased merchandise costing $50 billion and, by drawing down on previous inventory, sold merchandise costing $53 billion, the $53 billion cost of goods sold would be subtracted on its income statement. Inventory levels shown on its balance sheet would decrease by $3 billion.
SG&A
Ignore, just for the moment, the subtotals shown in bold type in the income statement (Gross Profit, EBIT, EBITDA, and Pretax Profit). The next major category of expenses subtracted out is Selling, General, and Administrative Expense (SG&A). Home Depot’s SG&A expense in fy2011 was $16.0 billion. This category is sometimes referred to as Operating Expenses because it is a catch-all category that includes almost all the costs of operating a business. The only things it does not include are the costs shown elsewhere on the income statement (merchandise costs, depreciation, interest, and income taxes). It will come as no surprise to HR managers that for most corporations the largest component of operating expenses is compensation costs (wages and benefits). That is just one of the compelling reasons why HR managers need to understand financial statements and why CEOs, CFOs, and others need to appreciate the role HR plays to determine a firm’s financial success (or lack thereof). In addition to compensation costs, SG&A includes expenses for the following:
• Advertising
• Office supplies
• Rent
• Insurance
• Utilities
• Bad debt write-offs
• Payroll taxes
• Shipping costs
• Travel and entertainment
• And much more
Under the accrual accounting method, all operating expenses for the year are included in SG&A even if the company has not paid all those bills by the end of the fiscal year. As discussed in the next chapter, any operating expenses not paid by the end of fy2011 were recorded on the company’s balance sheet as an accounts payable liability. It’s not a consideration for a retailer like Home Depot, but in some industries, for example pharmaceuticals, research and development is so important that operating expenses on their income statements are disaggregated on to two lines: one labeled R&D and the other labeled SG&A. Pfizer, Inc., for example, in its fy2011 income statement shows $9.1 billion spent on R&D and another $19.5 billion for other SG&A expenses.1
Depreciation and Amortization
Suppose Home Depot builds a new store at a cost of $60 million and that store generates $20 million in revenues during its first year of operation. When trying to determine whether that new store was profitable in its first year, would it make sense to subtract from its first year revenues its first year operating expenses and the full $60 million construction cost? Of course not. Both common sense and Generally Accepted Accounting Principles (GAAP) require that when estimating this store’s profit you treat the $60 million construction cost as if it had been spread over the useful life of that store. The accounting term for that process is depreciation. There are various ways to calculate depreciation expense, but the simplest to illustrate is called straight line depreciation. If Home Depot were using straight line depreciation to allocate this $60 million construction cost over a 30-year life of the building, it would on its income statement subtract a $2 million ($60 million / 30) depreciation expense in each of those 30 years. In the first year $60 million would have been paid to construct the building but only a $2 million expense would be included on the income statement. In the second and later years, no cash would be been paid out for this construction, but a $2 million expense would be included on the income statement. This method of calculating profits can produce large differences between the profit a company reports in a given a year and its actual net cash flow in that year. The implications of that statement for business planning are extremely important and are examined in detail in later chapters.
In fy2011 Home Depot’s income statement included a depreciation expense charge of almost $1.6 billion. That $1.6 billion was not, however, paid out in fy2011. It was just an accounting recognition of a portion of the cash Home Depot paid out in earlier years to purchase buildings and other long-term assets. Firms depreciate not just their buildings, but almost all long-term assets. Long-term assets are assets that have a useful life of greater than one year. These might include furniture and fixtures, trucks, forklifts, lab equipment, computers, and almost any other type of fixed asset that is required for the firm’s operation. The most significant exception is real estate. Firms depreciate the cost of buildings and other improvements on the land but not the cost of the land itself. The assumption is that land does not have a finite useful life and does not decrease in value with usage.
How can you determine the appropriate useful life over which to spread the cost of each type of depreciable asset? You could argue, quite reasonably, that a firm should make the most realistic forecast possible of how long each of its long-term assets will be used and then allocate their cost over that that life span. For tax purposes, however, firms typically use the minimum asset life span permitted under the federal income tax code. The shorter the life span assumed, the larger the annual depreciation expense will be. Larger annual depreciation deductions reduce the company’s taxable income and therefore the taxes that must be paid. An exception might be a firm that is not profitable now but expects to be profitable in the future. In that situation a firm might prefer smaller deductions now and larger reductions in the future. When firms use a different asset life estimate for financial reporting than for tax purposes, this is disclosed in a footnote to its financial statements.
The term deprecation refers to allocating the cost of a long-term tangible asset over an estimate of its useful life. Until recently, the term amortization referred to an analogous process used to allocate the cost of an intangible asset, for example, a purchased patent or brand name over an estimate of its useful life. The logic behind this approach was not always clear. Does a brand name have a finite useful life? Is it always true that over time a brand name decreases rather than increases in value? To sidestep these difficulties, accountants have generally stopped assigning arbitrary economic lives to intangible assets. Intangible assets are now carried on a company’s books at their initial value until there is evidence that their value has declined. If and when such declines in value of an intangible asset do occur, the company shows a charge on their income statement labeled amortization expense.
Interest Expense
Almost all corporations have both interest bearing debt such as bank borrowing and bonds and noninterest bearing debt such as accounts payable. This line on the income statement shows the cost for this period of the interest bearing debt. Interest is shown on a separate line and is not lumped into the broad category of operating expenses because it is not a cost of operating the business. It is a cost of financing the business. This distinction is important when you begin analyzing the income statement to assess the success of the firm’s business model. The label used on the Home Depot income statement is Interest and Other Expenses (Net). Other expenses that can be included are loan application and processing fees, points charged by lenders, and legal and other fees associated with obtaining loans. In fy2011 Home Depot’s interest expense of $606 million was offset by $13 million of interest and investment income producing a net interest expense of $593 million. In a foot note to its income statement, Home Depot states that the interest expense shown for 2012 is net of capitalized interest of $3 million. Capitalized interest is interest that instead of being expensed on the current period’s income statement is treated as part of the asset’s cost reported on the balance sheet. It then becomes part of the asset’s depreciation expense reported on future income statements.
Income Taxes
Income tax expense is the total amount the corporation must pay in federal and state income taxes. It does not include other nonincome taxes such as the employer share of unemployment and social security taxes. These nonincome taxes are included in operating expenses. Home Depot’s income tax expense in fy2011 was just more than $2 billion. Its combined effective income tax rate decreased to 36.0% for fy2011 (2,185 / 6,068) from 36.7% in fy2010 (1,935 / 5,273).
Net Income
When managers talk about being “bottom line focused” they mean focused on net income, which is the bottom line of the income statement. Net income (which is the same as net earnings or net profit) is what’s left when you take top-line sales revenue and then net out (subtract out) all the categories of expenses shown on the income statement. Companies whose stock is publicly traded are required to report Earnings Per Share (EPS). EPS is exactly what it sounds like: Net Income divided by the number of stock shares outstanding. Stock options and certain other financial instruments give their owners the right to obtain additional stock shares from the company. When such share distributions occur, the denominator in the EPS ratio, the number of shares outstanding, increases and the earnings per share is reduced (if the same profit figure is used in the numerator). To alert shareholders to this possibility, publicly traded companies are also required to report Diluted Earnings Per Shares. In the diluted EPS measure, the denominator is the number of shares currently outstanding plus the number that could potentially be issued through stock options and other securities that could be converted into stock. A big difference between a company’s basic EPS and diluted EPS may make investors nervous because of the risk that their ownership percentage will decline at some point in the future. Expressed on a per share basis, Home Depot’s net income converts to a basic EPS of $2.49 and diluted EPS of $2.47.
Profit Can Be Measured at Various Levels
The income statements in Exhibit 2-1 show five measures of profit:
• Gross Profit
• EBITDA
• EBIT (Earnings Before Income Taxes)
• Net Income
Which profit measure is most important? That depends on which business question you want to answer at the moment. Each of these measures provides important information for managers and investors.
Gross Profit
Gross profit is sales revenue minus only the first category of expenses, the cost of goods sold. Gross profit, often referred to as gross margin, is just the mark-up a company receives over its cost of purchasing or producing the items sold. If Home Depot buys a hammer for $5.00 from its supplier and then sells it at retail for $8.00, the gross profit or gross margin on that item is $3.00. To be successful a company’s gross profit must be large enough to cover all other costs of operating and financing the business and still leave a sufficient bottom line profit.
EBIT
EBIT is an acronym for Earnings Before Interest and Taxes are subtracted out. Its calculation is exactly that: sales revenue minus all expenses other than interest and taxes. What critical business question does knowing that quantity answer? Why exclude interest expense that is a real and sometimes large expense? Another name for EBIT is operating profit. Interest expense is not subtracted out in this calculation because it is a not a cost of operating the business. It is a cost of financing the business. Suppose Home Depot and Lowe’s had the same sales revenue, the same cost of goods sold, and the same operating expenses, but that Home Depot had more debt and therefore more interest expense than Lowe’s. In this hypothetical situation, both companies would have equally successful business operations and exactly the same pretax operating profit (EBIT). However, because of financing differences Home Depot would have a smaller bottom line net income. If the question you are interested in at the moment is, “Which business model is more successful?” comparing the two firms on EBIT would be the best choice. If the question you are interested in at the moment is, “Which firm generated the greatest profit for its shareholders?” comparing the two firms on net income would be the best choice. Remember that net income is always the result of two things: the profitability of the firm’s business operations (which is measured by EBIT) and the way those operations were financed, that is, how much was borrowed at what interest rate.
EBITDA
EBITDA is an acronym for Earnings Before Interest, Taxes, Depreciation and Amortization are subtracted out. Though sometimes referred to as a profit measure, it is probably more correct to view EBITDA as one form of cash flow measure. Remember that depreciation and amortization expenses do not represent cash outflows during the period in which they appear on the income statement. They are accounting reallocations of cash that was actually paid out at the time specific tangible or intangible assets were originally acquired. In fy2011, Home Depot’s depreciation and amortization expense was $1.573 billion, so its EBITDA was $1.573 greater than its EBIT. EBITDA is a widely used performance metric in many industries including telecom. One telecom firm that eventually got into financial trouble was boasting each quarter about how rapidly its EBITDA was growing. Its EBITDA, the revenues it received from subscribers minus only the current cost of providing telecom services to those subscribers, was actually a positive and growing number. However, the monthly cost to provide telephone service after the fiber, electronics, and other network components are in place is relatively small. EBITDA would have been a good estimate of the positive cash flow its business would generate each quarter if there were no additional expenditures for building out its network. As a profit measure, however, EBITDA can be misleading. For this telecom firm viewing EBITDA as a profit measure was the equivalent of saying, “Yes, we are profitable if we don’t subtract out the biggest costs our industry incurs, the costs of fiber, electronics, and network construction.” The networks are a long-term asset, and the costs to create them show up on an income statement only as depreciation expense.
Net Income
Net income is the profit reaming after all expenses have been subtracted. It is determined by the level of success achieved by the firm’s business operations, the amount borrowed to finance those operations, the average interest rate paid on that debt, and the company’s tax bracket. These bottom line profits can be retained by the corporation to support future business operations or distributed to shareholders as dividends.
Seeing the Big Picture
Understanding the definition and calculation of the various income statement components is only the first step to use this information to make better business decisions. One way to begin an analysis of the business implications of this information is to calculate a common size income statement. This is easily done by expressing each row in the income statement as a percentage of top-line revenues. By expressing each item as a percentage of a common size (100%), you can easily make comparisons between a company’s income statements from different years or between the income statements of different companies for the same year. Exhibit 2-2 provides an example of common size income statements for Home Depot and its largest competitor Lowe’s Companies, Inc. Several factors are immediately obvious. Both firms charge almost exactly the same mark-up on the merchandise they sell. Gross margins at Home Depot are 34.5%, and gross margins at Lowe’s are 34.6%. This is not surprising given the similarities in their product lines and competitive pressures to match the prices others offer. The similar gross margins are an important insight into the business strategies of these two firms. The relationship of gross margins to business strategy is discussed in the next chapter.

Exhibit 2-2. Common size income statements for Home Depot and Lowe’s
Source: Lowe’s calculations based Form 10-K filed with U.S. Securities Exchange Commission on 3/20/2012, page 32. Home Depot calculations based Form 10-K filed with U.S. Securities Exchange Commission on 3/22/12, page 30.
Operating Efficiency
There is a bigger difference between the two firms in terms of operating efficiency. SG&A at Lowe’s is equal to 25.1% of sales revenue, whereas at Home Depot it is only 22.8%. If Lowes’s had generated the same $50.2 billion of sales with an SG&A percentage equal to Home Depot’s, its operating profit (EBIT) would have been $1.15 billion larger! ([25.1% – 22.8%] × $50.2 billion). This data raises the question, “Why are operating expenses greater at Lowe’s?” Is it because it is less efficient, or is it because it is intentionally spending more on marketing or more to provide a different customer experience?
Store Growth
Depreciation expense at Home Depot was larger in dollar terms but smaller as a percentage of sales (refer to Exhibit 2-2). This percentage difference is largely the result of the difference in the rate of store expansion. Between the end of 2007 and the end of 2011, the number of Lowe’s stores increased by almost 14%, from 1,534 to 1,745. During that same period the number of Home Depot stores increased by less than 1%, from 2,234 to 2,252.
Operating Profit Margin
Because as a percentage of sales revenue, both SG&A and depreciation expense are larger at Lowe’s than at Home Depot, it is not surprising that Lowe’s operating profit margin (EBIT/sales revenue) is much smaller. For every $100 of sales revenue, Home Depot in 2011 earned an operating profit of $9.50. For every $100 of sales revenue, Lowe’s earned an operating profit of only $6.50. Even if Home Depot and Lowe’s had the same sales revenue, Home Depot’s operating profit would have been 46% greater!
Profit per Store
Another way to see this difference is to calculate EBIT per store. At Home Depot this was $2.96 million ($6.66 billion / 2,252 stores). At Lowe’s, it was only $1.88 million ($3.28 billion / 1,745 stores). By strategically closing down underperforming stores, Home Depot has optimized its capital allocation and concentrated on its core business activities. The introduction of new warehousing and transportation systems has also helped to reduce its supply chain costs.
Year-Over-Year Change
Between 2010 and 2011, Home Depot’s bottom line net income grew by 16.3%, even though its top-line revenues grew by only 3.5%. It can do this because during 2011 as a percentage of sales, its gross margins were up and its SG&A and depreciation expenses were down.
Financing Costs
EBIT provides the most direct measure of the success of Home Depot’s business model. Bottom line net income is always the result of two things: the success of the company’s business model and how that business was financed, that is, how much was borrowed at what interest rate. Home Depot and Lowe’s were not dramatically different in terms of interest expense. At Home Depot it was equal to 0.8% of sales and at Lowe’s 0.7% of sales.
The Bottom Line
After subtracting from Home Depot’s operating profit of $6.7 billion, an interest expense of $593 million, and almost $2.2 billion in income taxes, you see that Home Depot’s 2011 bottom line net income (which it label Net Earnings) was almost $3.9 billion. The 5.5% net profit margin means that for every $100 in sales revenue that comes in, $5.50 remains after all expenses are subtracted. Does that level of profitability constitute a strong business performance? Is that enough profit to provide the company’s shareholders with an attractive return on their investment? Alternative techniques for answering those questions are examined in later chapters.