
4. Cash Flows: Timing Is Everything
What’s the difference between operating profit and cash flow from operations? When measuring profits you make a series of timing adjustments. For example, you define top-line revenues as total sales during the period even if you have not yet collected all the cash from those sales. You subtract from that number only the cost of the merchandise sold during that period, even if you paid your suppliers for that merchandise and other merchandise that is still in inventory. Similarly you don’t subtract from the current period’s revenues the full amount paid to purchase long-term assets. You allocate, or depreciate, those costs over an estimate of the economic life of that asset. Those timing assumptions are all quite reasonable if your goal is to estimate the amount of profit earned during a particular time period. When calculating cash flow from operations, you make none of those timing adjustments. When calculating cash flow you attempt to answer the question, “How much cash did your business operations actually bring in during the period and how much cash did your business operations actually pay out during that period?” The net of those two numbers determines whether your cash flow for the period was positive or negative.
The example in Exhibit 4-1 illustrates how different profit and cash flow can be during the same period. This firm had a profit of $15 million in 2012, but its cash flow was a negative $6 million. The company’s cash flow from the operations was calculated as follows:
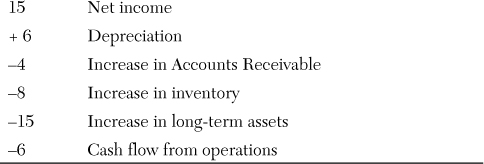
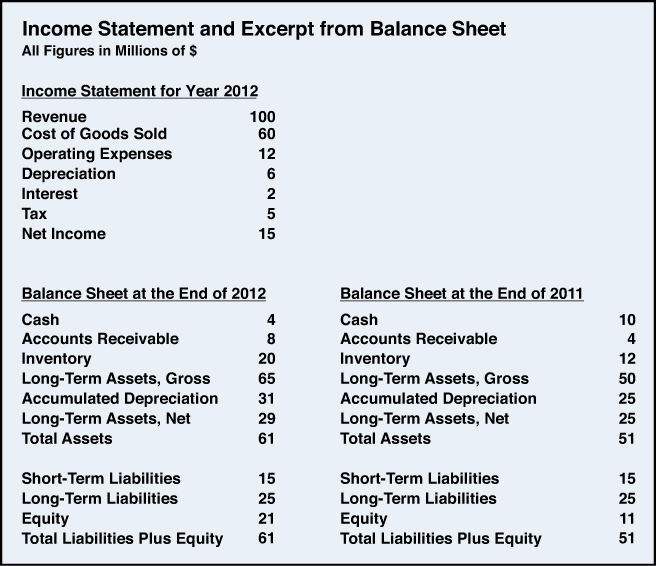
Exhibit 4-1. Information needed to calculate cash flow from operations
Calculating operating cash flows involves two steps. The first is to determine what the income statement tells you about cash flows. The second is to review the assets and liabilities shown on the balance sheet to determine whether there were any changes during the year in these items that had cash flow implications. When you assess the cash flow impact of a particular transaction, you are doing nothing more than saying, “If all this company’s cash were kept in a single account, would that account balance go up or down because of this transaction?”
Cash Flow Information from the Income Statement
The company (refer to Exhibit 4-1) earned a net profit of $15 million. That’s a cash inflow. But one of the items subtracted on the income statement was depreciation. As you know, depreciation is not a real cash outflow. It’s just an accounting recognition in the current period of a portion of the cash that was spent at the time the long-term assets were acquired. The cash generated in 2012 was therefore more than $15 million profit. When you add back the $6 million in depreciation expense, you see that the cash generated was $21 million. The company’s current business operations during 2011 brought in $21 million more than was paid out. You could stop there if there were no changes over the year in the balance sheet. But there usually are, so look at that next.
Cash Flow Information from the Balance Sheet
What changes occurred in this company’s balance sheet between the end of 2011 and the end of 2012? Did those changes add to or reduce the company’s cash on hand? An increase in an asset category required cash to purchase those additional assets, so subtract from the cash generated the amount of any asset increase. A reduction in an asset category would mean assets were sold, so you would add the cash received from selling those assets. An increase in any category of liabilities would mean additional funds were borrowed, so add the amount of cash obtained through any additional borrowing. A reduction in any category of liabilities would mean debts were being paid off. In that case, you would subtract the amount of cash used to pay off those debts.
In this example, inventories increased by $8 million, and long-term assets increased by $15 million. The cash used to acquire those additional assets was subtracted in the preceding calculation. Accounts Receivable also increased over the year. Accounts Receivable, that is, uncollected funds, increased by $4 million, so the company has $4 million less in the bank than if accounts receivables had remained at the 2011 level. In this example liabilities were unchanged between the end of 2011 and the end of 2012.
The logic of the Home Depot cash flow statement shown in Exhibit 4-2 is exactly the same as the approach used in the simplified previous example. Home Depot starts with the $3.9 billion in net income from the bottom line of its 2011 income statement and then adds back the two noncash items, depreciation, and stock-based compensation expense, which had been subtracted on that income statement. Chapter 10, “Equity-Based Compensation: Stock and Stock Options,” discusses the expensing of stock-based compensation. The key point for this discussion is that granting employees stock options or other forms of equity does not require a cash outlay at the time of the grant. Home Depot then goes through each of the categories of assets and liabilities that appear on its balance sheet. If an asset category increases, the cash required to increase those assets is subtracted. If an asset category decreases, the proceeds from those asset reductions are added. If a liability category increases, the funds obtained through that borrowing are added. If a liability category decreases, funds used to pay down that debt are subtracted. During the 12-month period that ended January 29, 2012, Home Depot’s business operations produced a net cash inflow of $6.651 billion. Of that amount the company spent $1.129 billion to build new stores and acquire other long-term business assets. That still left a net inflow of $5.522 billion.
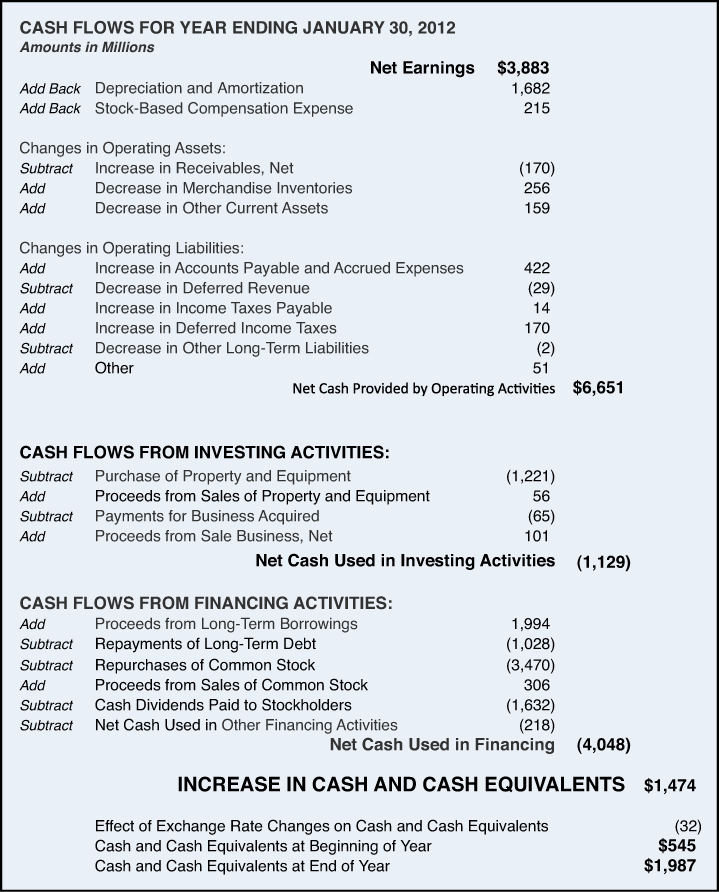
Exhibit 4-2. Cash flow statement for Home Depot
Source: Form 10-K filed with U.S. Securities Exchange Commission on 3/22/2012, page 32.
What can a company do with that much cash? There are only a few possibilities. The cash could be retained within the company to expand current business operations or to acquire new businesses. Funds not retained in the business can be returned to the shareholders as dividends or used to repurchase the company shares in the open market. Home Depot during 2011 did all three of those things.
It paid dividends of $1.632 billion and repurchased a $3.47 billion of its own stock. After a stock repurchase, each of the remaining shareholders will own a larger percentage of the company. These remaining shareholders will have benefited if at the time of the repurchase the stock was undervalued in the external market. The remaining shareholders will have incurred an economic loss if at the time of the repurchase the shares were overvalued in the external market.
At the same time that Home Depot was distributing cash by repurchasing shares, it was raising cash by selling bonds. Home Depot paid off $1.028 billion in bonds originally issued in 2006 that matured in 2011. This cash outflow was more than offset by borrowing $1.994 billion through the sale of new 10-year and 30-year bonds. Of course, buying back shares at the same time you’re taking on additional debt makes the company more highly leveraged. As explained in Chapter 2 (“The Income Statement: Do We Care About More Than the Bottom Line?”) increasing leverage creates additional opportunities and also additional risk.
The combined effect of all these activities was to increase Home Depot’s cash on hand by $1.474 billion, from $545 million at the start of the year to $1.987 billion at the end of the year.