11.3 Coverage
By its nature, testing is never complete. As the influential computer scientist Edsger Dijkstra put it, “Testing shows the presence, not the absence of bugs.” No quantity of tests can ever prove a package free of bugs. At best, they increase our confidence that the package works well in a wide range of important scenarios.
The degree to which a test suite exercises the package under test is called the test’s coverage. Coverage can’t be quantified directly—the dynamics of all but the most trivial programs are beyond precise measurement—but there are heuristics that can help us direct our testing efforts to where they are more likely to be useful.
Statement coverage is the simplest and most widely used of these
heuristics. The statement coverage of a test suite is the fraction of
source statements that are executed at least once during the test.
In this section, we’ll use Go’s cover tool, which is integrated
into go test, to measure statement coverage and help
identify obvious gaps in the tests.
The code below is a table-driven test for the expression evaluator we built back in Chapter 7:
func TestCoverage(t *testing.T) {
    var tests = []struct {
        input string
        env   Env
        want  string // expected error from Parse/Check or result from Eval
    }{
        {"x % 2", nil, "unexpected '%'"},
        {"!true", nil, "unexpected '!'"},
        {"log(10)", nil, `unknown function "log"`},
        {"sqrt(1, 2)", nil, "call to sqrt has 2 args, want 1"},
        {"sqrt(A / pi)", Env{"A": 87616, "pi": math.Pi}, "167"},
        {"pow(x, 3) + pow(y, 3)", Env{"x": 9, "y": 10}, "1729"},
        {"5 / 9 * (F - 32)", Env{"F": -40}, "-40"},
    }

    for _, test := range tests {
        expr, err := Parse(test.input)
        if err == nil {
            err = expr.Check(map[Var]bool{})
        }
        if err != nil {
            if err.Error() != test.want {
                t.Errorf("%s: got %q, want %q", test.input, err, test.want)
            }
            continue
        }

        got := fmt.Sprintf("%.6g", expr.Eval(test.env))
        if got != test.want {
            t.Errorf("%s: %v => %s, want %s",
                test.input, test.env, got, test.want)
        }
    }
}
First, let’s check that the test passes:
$ go test -v -run=Coverage gopl.io/ch7/eval
=== RUN TestCoverage
--- PASS: TestCoverage (0.00s)
PASS
ok      gopl.io/ch7/eval    0.011s
This command displays the usage message of the coverage tool:
$ go tool cover
Usage of 'go tool cover':
Given a coverage profile produced by 'go test':
    go test -coverprofile=c.out

Open a web browser displaying annotated source code:
    go tool cover -html=c.out
...
The go tool command runs one of the executables from the Go
toolchain. These programs live in the directory
$GOROOT/pkg/tool/${GOOS}_${GOARCH}. Thanks to go build, we
rarely need to invoke them directly.
Now we run the test with the -coverprofile flag:
$ go test -run=Coverage -coverprofile=c.out gopl.io/ch7/eval
ok      gopl.io/ch7/eval    0.032s  coverage: 68.5% of statements
This flag enables the collection of coverage data by
instrumenting the production code.
That is, it modifies a copy of the source code so that before each
block of statements is executed, a boolean variable is set, with one
variable per block.
Just before the modified program exits, it writes the value of each
variable to the specified log file c.out and prints a summary of the
fraction of statements that were executed.
(If all you need is the summary, use go test -cover.)
If go test is run with the -covermode=count flag, the
instrumentation for each block increments a
counter instead of setting a boolean. The resulting log of execution counts of each block
enables quantitative comparisons between “hotter” blocks,
which are more frequently executed, and “colder” ones.
Having gathered the data, we run the cover tool, which
processes the log, generates an HTML report, and opens it in a new
browser window (Figure 11.3).
$ go tool cover -html=c.out
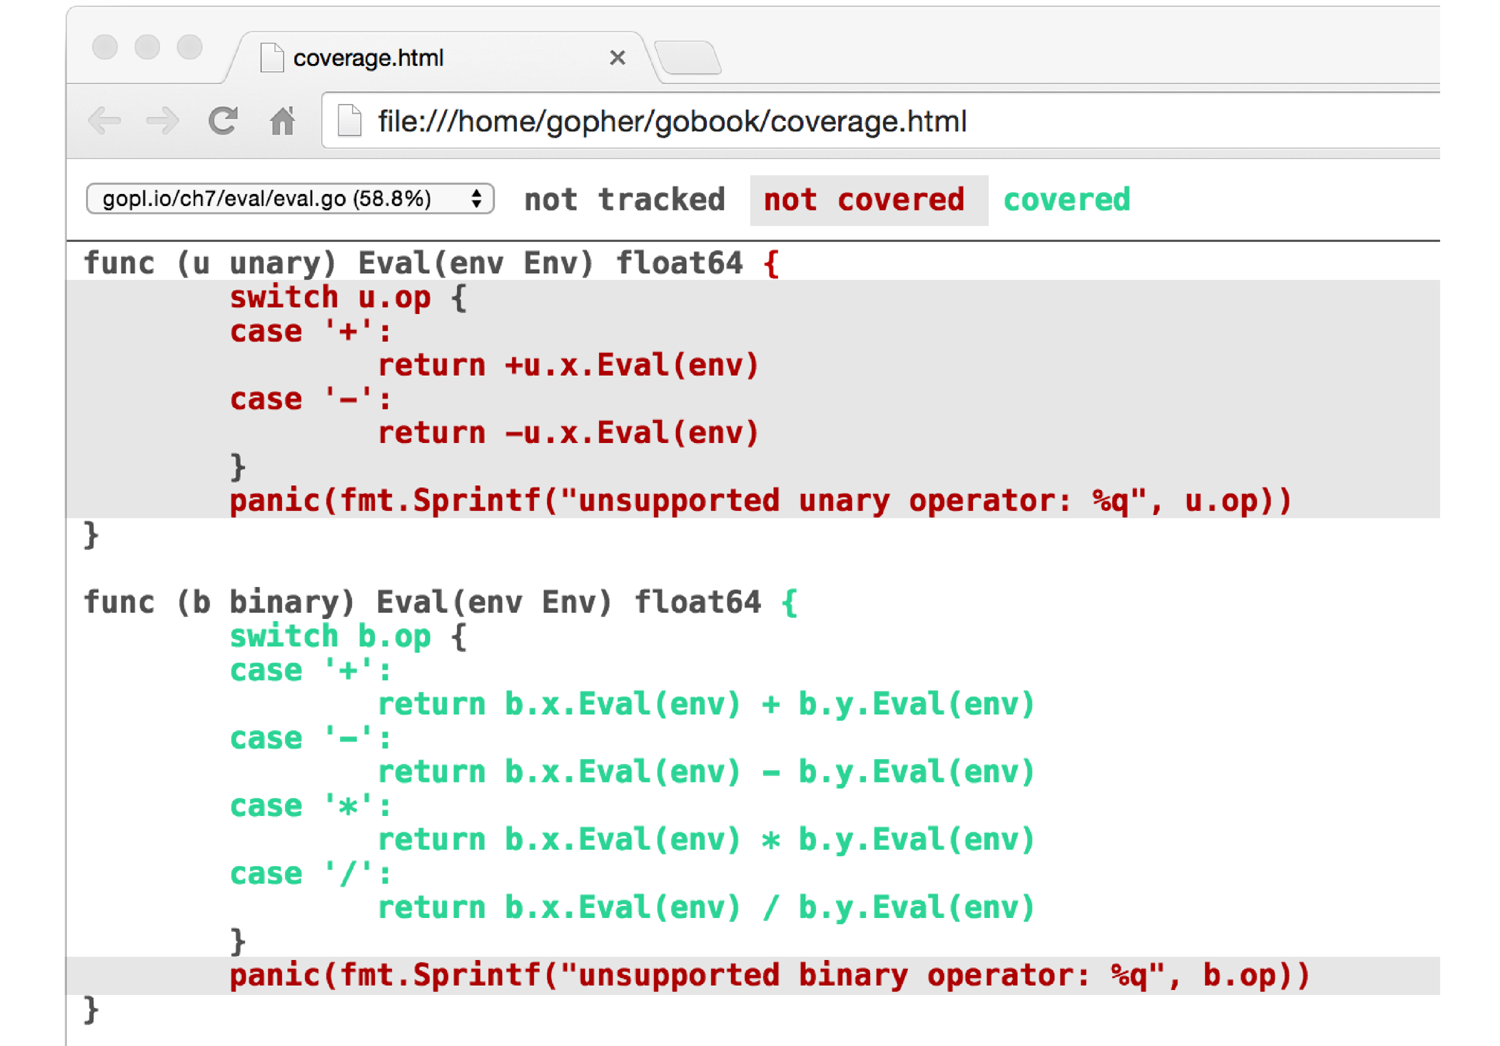
Figure 11.3. A coverage report.
Each statement is colored green if it was covered or red if it
was not covered. For clarity, we’ve shaded the background of
the red text.
We can see immediately that none of our inputs
exercised the unary operator Eval method.
If we add this new test case to the table
and re-run the previous two commands, the unary expression code
becomes green:
{"+x * -x", Env{"x": 2}, "4"}
The two panic statements remain red, however.
This should not be surprising, because these statements are supposed
to be unreachable.
Achieving 100% statement coverage sounds like a noble goal, but it is not
usually feasible in practice, nor is it likely to be a good use of effort.
Just because a statement is executed does not mean it is bug-free;
statements containing complex expressions must be executed many times
with different inputs to cover the interesting cases.
Some statements, like the panic statements above, can never be
reached.
Others, such as those that handle esoteric errors, are hard to
exercise but rarely reached in practice.
Testing is fundamentally a pragmatic endeavor, a trade-off between the
cost of writing tests and the cost of failures that could have been
prevented by tests. Coverage tools can help identify the weakest
spots, but devising good test cases demands the same rigorous thinking
as programming in general.