Lean methods and tools (part VI)
Introduction
For the concept of flow to work well many of the core Lean methods such as standard work, visual management, quick changeover (hence inventory reduction), takt time and systematic problem solving need to be bedded down.
Flow incorporates much more than the physical mainstay flow of the product or service, although this is normally the primary target for streamlining. There are many other flows that need to be purposely designed so that they support and interact seamlessly with the primary physical flow of your product or service.
Flow in a hospital environment
In a hospital there are many flows that must interact successfully to ensure that a patient gets the best result. For instance the patient must flow to where the specialised treatment rooms and equipment are located. Providers such as doctors and nurses must be available in a timely manner to provide care for the patient. The flow of information such as the patient’s care plan and medical records must be readily accessible at this point of care. Oral and intravenous medication must flow to the patient just when they are needed. Supplies such as IV kits and catheters must arrive in the right quantity on time and in the correct type. Equipment such as vital signs monitors and sterile instruments must flow in synchronisation with the patient’s needs also. Process engineering needs to coordinate flows behind the scenes. They must ensure that all of the facilities services and equipment are capable and fully functional at the point of use when needed. This is quite a complex series of tasks to orchestrate many thousands of times daily in hospitals all over the world. Without deliberate design intervention in this complex series of flows the outcome could be avoidable harm to patients and at best sub-standard care and/or extended patient wait times.
- Improved quality: increased velocity of material or information availability leads to shorter consumption periods and defects are detected in almost real time when the root cause trail is still warm.
- Lead time compression: smaller batch size and less queue time dramatically reduces lead time.
- Productivity: wasted motion is reduced as is double processing.
- Space: facility space is freed up due to capacity increases and fewer inventory staging positions.
- Cost: reduced fixed costs such as less capital investment in inventory.
- Morale: greater employee involvement in correcting process stoppages through systematic problem solving.
Flow is a time-based competitive strategy. The refocusing of attention from cost to time provides organisations with immense competitive advantage. The authoritative work of Stalk and Hout1 sets out three rules based on research carried out in 1990.
- The ¼–2–20 rule states that for every quartering of total lead time, there will be a doubling of productivity and a 20% cost reduction. This research also aligns closely to later work carried out by the George Group2 in 2002. As a rule of thumb, if this in-process waiting time is reduced by 80%, the overhead and quality cost will drop by 20%. This results in increased operating profit of approximately 5%.
- The 0.05 to 5 rule states that value is actually being added only between 0.05% and 5% of the total time door-to-door in your organisation.
- The 3/3 rule states that wait time, during which no value is added, is split three ways, each accounting for approximately one-third of the total lead time. The three categories are waiting for completion of batches, waiting for physical and intellectual rework, and waiting for management decisions to send the batch forward.
One might wonder how velocity (less stopping and waiting) and time compression slashes so much ‘hidden’ cost. If you consider the sequence of events below we can begin to understand the depletion that sluggish processes are siphoning from the bottom line.
In manufacturing every time a part is stopped (placed into storage along the value stream):
- someone has to assume the job of managing the parts
- they have to be placed in containers
- most likely transferred to a predetermined area of the factory
- then stacked
- counted, tagged and booked onto the inventory control system
- then when it is time to use them they have to be un-stacked, de-tagged and booked off the inventory control system
- then conveyed to another area of the factory to be consumed!
Can you relate the above sequence of events to your own industry?
River and rocks analogy
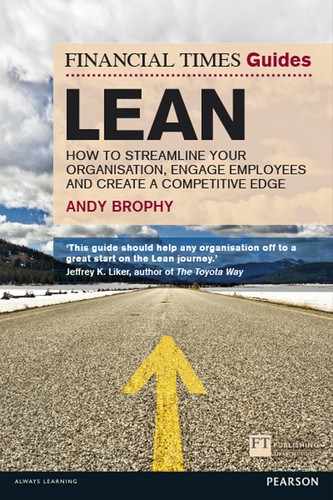
Taiichi Ohno used the analogy of an organisation being like a river full of rocks (see Figure 9.1). The water level in the river symbolises inventory and the rocks signify waste. When the water level is high, potential rocks or problems can go undetected due to the water cushion. Problems continue to grow underneath the visible water level. The intention of Lean is to constantly lower the water level through each phase of maturity. This then exposes the rocks and induces compulsory problem solving in order to keep the area operational. The rocks must be shattered through root cause analysis to enable smooth fast flow along the value stream, similar to a boat sailing along a fast flowing river with a flat, rock free riverbed.
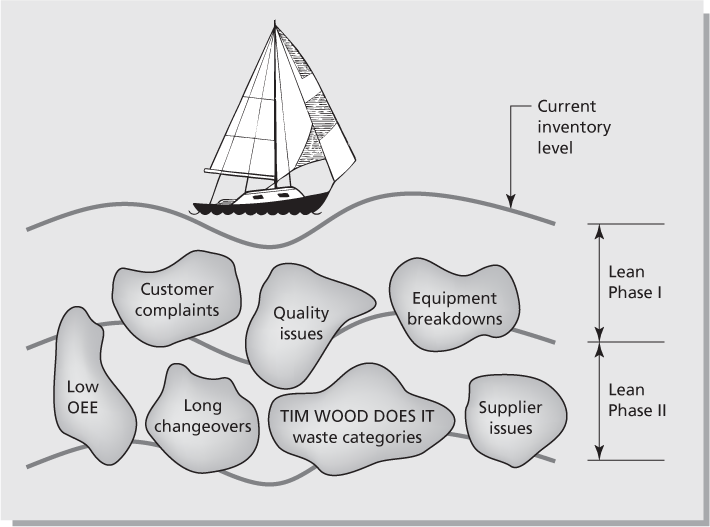
Figure 9.1 River and rocks analogy
Batch size implications for flow
The inevitable consequence of batching work is extended customer lead times. If you consider the implications of batch size in the simplified diagram in Figure 9.2 you can appreciate why this is so. When the batch size per processing lot is 12 units the customer will not receive a finished unit of work until after 36 minutes as it takes 12 minutes for the batch to cycle through each process. Cutting the batch size by 50% (through improvements such as quick changeover) will halve the lead time to 18 minutes. A further 50% reduction will achieve a 75% reduction of the original lead time. This abides by Little’s Law which as phrased by Michael George states that Process Lead Time = Number of ‘Things’ in Progress/Completions per Hour. The ultimate objective would be to get to one piece flow; in this case the lead time would be 3 minutes. Exploiting the batch size economies can achieve an incredible 83% reduction in lead time in this instance. Yet the industry norm is exactly the opposite: run as large a batch as possible to achieve economies of scale! The Lean paradigm of economies of flow crushes this widely accepted practice. The principal rationale for running large batches is to amortise the cost of setup time over many units. Toyota broke this paradigm by perfecting quick changeover (see Chapter 7 Section 1). This method allows the setup time, for example of a 2000 ton press, to be reduced from 4 hours to 10 minutes. This allows the batch size to be cut by 96% while maintaining the same production rate. A 96% reduction in batch size will drive a 96% reduction in overall work-in-progress. The overall cycle time of the factory would also be cut by 96% according to Little’s Law. Little’s Law provides the mathematical foundation for Lean. This practice holds true regardless of whether you are working in a service transactional process or a software development project management function (in this case the batch size would be open incomplete projects).
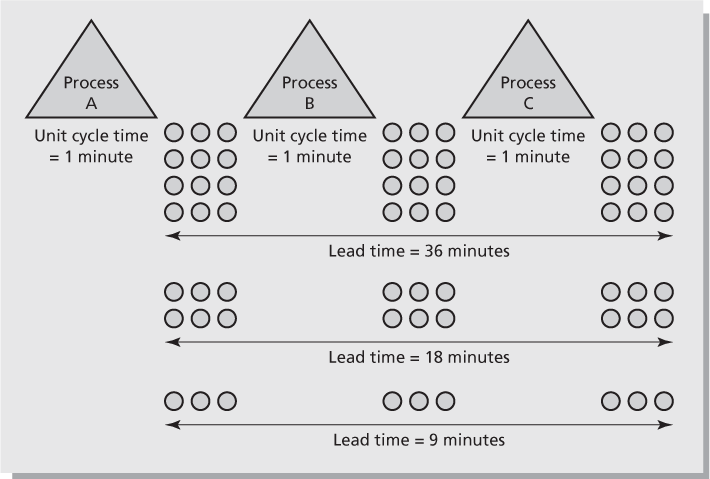
Figure 9.2 Effect of batch size on lead time
A concept known as transfer or move batch could also be deployed where it is difficult to reduce batch size due to process constraints. This is achieved by physically splitting a batch and moving it on to the next process instead of waiting for the completion of the entire batch.
A word on inventory
The traditional view of inventory costs is that they include the capital cost (the cost of capital or the opportunity cost of capital) and holding cost (costs of the store or warehouse, including space occupied, wages, damage, obsolescence (date sensitive) and material handling equipment in the store). Typical figures used by the American Production and Inventory Control Society (APICS) would be a capital cost of 10% per year and a holding cost of 15% per year, leading to an inventory carrying cost of 25% per year. The Lean view goes beyond this as in most cases inventory actually involves far more cost: work-in-progress takes up space on the factory floor (which not only uses space but also prevents compact layouts, which in turn means more material handling and decreased effectiveness of communication, etc.). Most importantly large batches work against the flow metric of EPEI (every product every interval, the ultimate Lean metric) and inflate lead time. The real cost of inventory is more likely to be in the region of 50–80% per annum.3
However, take care when cutting inventory as an end goal. Not having inventory in the right place at the right time is often a bigger waste than the cost of having the inventory itself. For instance the cost of stock-outs that result in lost sales and possibly loss of customer loyalty is to be avoided at all costs.
The problem with traditional production scheduling using material requirements planning (MRP)
MRP uses the batch logic of making large runs to get economies of scale. Equipment set-up costs and material handling costs (driven by plant layout and handling procedures) add to the cost of the product or service. By producing more at once, the costs of set-up and handling can be amortised over more quantity (hence the logic that bigger batches reduce costs!). Traditional accounting defines inventory as an asset; the only perceived cost of producing more parts than are needed is the minimal costs of lost interest on money in the bank and storage costs. MRP-induced large batches ensure that any rocks in the river are well disguised through immersion in inventory. MRP also falsely assumes that lead time remains constant even at 100% equipment utilisation levels (see the discussion on balance charts at the end of this chapter). Additionally, quality losses and yield allowances are built into MRP to further hide problems. In short the scheduling system ensures that there is enough inventory everywhere to keep waste and problems hidden.
Preconditions for flow
Seek to level the demand
The starting point for most flow improvement work is to develop a keen understanding of average daily demand in terms of both quantity and mix of work content. The extent of variation present in this data is also a critical consideration. Organisations need to get to the root cause of why the schedule is not level. This could be down to price promotions, excessively long changeovers or the bullwhip effect (swings in customer demand create a bullwhip outcome – a delicate flip of the wrist creates colossal power at the other end of the whip – resulting in over-production upstream and excessive staffing levels to cater for this bogus demand). For example, if a baker is running a price promotion his short-term demand will probably increase. Hence his requirement for more raw materials from his suppliers also increases, which in turn causes his suppliers to order more from their suppliers (and a bit more just in case!) and this continues throughout the supply chain. The demand amplifies at each level and has little correlation with the actual, real, end user demand which remains relatively stable over the longer term.
It is extremely difficult to be continuously responsive to fluctuating demand without enduring mura (unevenness in productivity and quality) and muri (overburden of people and equipment). The attainment of standard work in this environment becomes extremely difficult if not impossible. Muda in all its forms is created when demand is uneven and when resources are overburdened. Most demand, as previously indicated, is in fact relatively stable and predictable at the point of use.
Runner, repeater and stranger
Generally speaking 20% of the work variety in most organisations accounts for 80% of the overall volume (remember the universally applicable 80/20 rule discussed in Chapter 5, Section 1). Indeed it is statistically valid to further predict that 5–7% of a particular type of work that we perform accounts for 50% of the total volume of work variety undertaken. This is a great area to focus on making value flow. Hence it is possible to smooth the great bulk of work entering our organisations. A useful concept to gain an understanding of the demand entering your organisation is runner, repeater and stranger. A runner is work that is very regular; such work normally occurs on a daily basis (most likely being the 5–7% variety mentioned earlier). A repeater is frequently reoccurring work that may take place every other week. A stranger is work that happens less often. It may be seasonal or enter the system every few months or even less often. Separate strategies can be devised to exploit each of these categories of work. For instance it may be economically viable to have dedicated equipment for runner demand to ensure that it is never delayed by the two other categories.
Heijunka
Due to the bullwhip effect even small changes in demand can create chaos throughout your organisation. A concept called heijunka regulates the volume and mix of work produced. It provides daily consistency and certainty to the production schedule so that the Lean system can work in a holistic manner and permit flow. It allows for small batch increments to be released for processing in a levelled fashion throughout the work shift. One of the many counterintuitive advantages of producing in smaller batches is the reduction of risk against changes in customer orders, which happens frequently! Needless to say that producing in large batches all at once is a risky practice.
Heijunka is implemented via a visual scheduling box similar to a ‘pigeon box’ arrangement. It enables the frontline staff to see what work is queued for completion and the time that it is due to be released. The material handler or runner (see below) removes the kanban cards from the box in their scheduled order to authorise production.
Pitch is the term used to represent a pack out quantity such as a full container or pallet of work. It is preferable that pitch increments are represented by some physical activity happening in your organisation (just like people getting on the train – either they get on or they miss the train). A common way to achieve this is to have the material handler (the train) show up every pitch increment, take away the work completed, and provide the schedule for the next pitch increment. The runner is the pace setter for the entire process and provides the cadence of flow. This has the concealed benefit of improving schedule adherence as problems that affect pitch increment are surfaced every cycle. To create pitch equal to a full box quantity, we multiply takt time by box quantity. Therefore, as a full box or pallet is produced, the material handler comes to take it away.
Runners should be able to understand the value stream demand requirements and communicate abnormalities well through the visual management system. They play an important role in proactive problem solving. Because they continuously monitor the functioning of a line or cell as well as pitch, runners are closely attuned to how well the value stream is fulfilling customer requirements. In traditional organisations, when a problem occurs frontline employees notify the team leader and the problem is addressed after it occurs. However, runners are in a unique position to help prevent small problems before they escalate into larger problems that can seriously disrupt the process.4
Pacemakers
A pacemaker schedules production at one process (usually but not always at a bottleneck) to pull production into it. All other processes subjugate themselves to the pacemaker process. While local efficiency may be diminished, total system efficiency is instead optimised. A general rule for selection of a pacemaker is that the process must flow after the pacemaker. It is common for the pacemaker to be situated downstream in the value stream. This is because this operation is more in tune with end user demand than processes upstream that can be more susceptible to the effects of potential bullwhip. Again the pacemaker, as the name suggests, sets the pace for the entire value stream similar to the accelerator in your car. This prevents over-production and WIP imbalances between the preceding processes and hence lead time expansion.
Pitch can be visually displayed on a traffic light board at the pacemaker and countermeasures are recorded and implemented for red flag pitch misses. Hence there is real time visibility to schedule attainment and, to reiterate, real time solving of problems before they cause disruption. This is in stark contrast to weekly schedule buckets in which we only know after the fact the percentage schedule attainment. The runner starts and ends his route at the heijunka box (initiating the next round of activity as the heijunka card is issued), which is located adjacent to the pacemaker.
Family identification
Value stream improvement should be categorised by product or service family. These families are identified by a matrix that shows the connection of products (or services) with processes (Figure 9.3). The three rectangular looped products/services would be classified as a product/service family as they are routed through the same series of processes. These are normally classified as one value stream for the creation of flow as they transverse the same series of processes.
Map the value stream
Value stream mapping discussed in Chapter 3 is the methodology for mapping processes end to end and capturing physical, information and people flow in your organisation. To recap, the current state map captures the process as it exists now. Through analysis of the current state the team is able to identify flow interrupters and bottlenecks in the value stream map. When these are cleared the flow of value is enhanced and the speed of the end-to-end lead time increases.
Figure 9.3 Routing matrix
Takt time
We introduced the concept of takt time in Chapter 3. Takt time establishes the ‘beat’ of the organisation and this should be in alignment with your customer demand. If demand changes, takt time should also be adjusted to reflect this. Mature Lean organisations often change takt time deliberately to make problems visible through analysis and revision of standard work.
Takt time = net available time per day / customer demand per day
There is a 50-second policy for takt time which states that repetitive operations should not have a cycle time of less than 50 seconds. There are a number of reasons for this. The first reason is productivity – there are always a few seconds lost at the start and end of an operation due to orientation – and common cause variation, etc. If you lose 4 seconds at the start and end of a 25-second cycle, this represents a 16% productivity loss per cycle. However, if the task cycle time is 50 seconds and 4 seconds is lost at the beginning and end of the task, the productivity loss is 8%. Whilst further improvement is obviously required this represents a significant improvement over the shorter cycle time. Quality also improves as cycle time expands as people become customers of their own work. Dependent steps are performed to a higher degree of accuracy as the same person becomes a customer of their own work. Feedback is also instant if quality criteria are violated. Safety, in addition, improves due to diminished risk of repetitive strain injuries. Finally there are also higher levels of job enrichment as people complete more diverse and complete portions of a job from start to finish rather than mindlessly completing a very small element such as drilling a hole in a part.
Identify bottlenecks and variation
The theory of constraints was developed by the late Eli Goldratt (1947–2011). Its central insight is that an hour lost at a bottleneck is an hour lost for the entire value stream (or streams if the bottleneck is a shared resource). A bottleneck is the pinch point or kink in the overall system. A good analogy is a water hose: if there is a kink in the hose the output is governed by the cross-sectional area of that kink. Hence the productivity of the bottleneck determines the productivity for the entire value stream. This has enormous implications for the focus of improvement work. It is the bottleneck that regulates flow, not efficiency of individual resources. Many continuous improvement endeavours are themselves waste if they focus on improving non-bottleneck resources prior to a bottleneck resource.
The theory of constraints uses three primary metrics to measure performance. These are:
- Throughput – the money generated by the system through sales
- Inventory – the money spent to make products or provide services that are anticipated to be sold
- Operating expense – the money the system spends to transform inventory into throughput.
The actual application of the theory of constraints is a five-step process consisting of the following:
- Identify the system’s constraint – the kink in the system.
- Decide how to exploit the system’s constraint: ensure that it is never starved of supply, reduce changeover time, measure OEE, do not process defects, maximise the batch size (only for a bottleneck!) and maximise utilisation of the bottleneck process.
- Subordinate everything else to ensure that the bottleneck is kept running: policies must support the constraint such as keeping the resource working through breaks, and improve flow to the constraint from non-bottleneck resources through improving changeover in order to reduce batch size at non-bottlenecks.
- Elevate the system’s constraint: break the constraint through speeding it up via process improvements.
- If, in the prior steps, the constraint has been broken, go back to step 1, identify where the constraint has shifted to in the system and repeat these five steps.
Drum, buffer, rope (DBR)
The theory of constraints uses a concept called drum, buffer, rope (DBR). The idea of DBR is that the drum is the constraint. It establishes the rhythm for all other processes. The buffer is inventory to shield the drum from being starved of work. The rope is the rate that material is released into the system. This should be in synchronisation with the constraints rate of processing.
Cellular flow
The purpose of cellular layout is to address the root causes of poor flow which include large batch processing, inflated work-in-progress levels or queues, inadequate work balancing, low adherence to 5S, variation in demand and ineffective space utilisation.
Traditionally, equipment is arranged in separate departments where the method of operation is termed ‘batch and queue’ processing. In a ‘batch and queue’ arrangement equipment is grouped by similar processing characteristics such as final assembly in manufacturing, the imaging function in hospitals or the check-out facility in a hotel. This disjointing of the flow of value is driven by the flawed assumption of economies of scale (Lean advocates economies of flow) through large batch processing. The end result is the introduction of unnecessary waiting time due to delay in waiting for batch processing to be completed and the transporting of material and information, to name but two of the many unintended consequences of ‘batch and queue’ mentality.
Cellular layout refers to an operational system in which the equipment is lined up in sequence that permits continuous flow of the production or service fulfilment of your offerings. A common layout for this sequence of working is a U-shaped cell. The direction of flow is normally anti-clockwise to accommodate the 70–90% range of people who are right-handed. The optimum size of a cell is about 5–12 people.
Kanban is often used to pull material from one workstation to the next if true one-piece flow is not yet attainable. Note that in true Lean organisations the primary authorisation to produce is not by a printed schedule from the office; kanban is authorisation to produce to real time demand. The True North aspiration of one piece flow is rarely achieved in reality; hence kanban is the norm rather than the exception in most cells. In essence, flow where you can and pull when you must! The magic of kanban is that it caps work-in-progress and hence enables faster cycle times.
Benefits of cellular operation
These include:
- dramatic increase in lead time as batch sizes are dramatically reduced
- waste elimination in all of the TIM WOOD DOES IT categories
- better quality as issues are surfaced faster – process velocity is faster in comparison with ‘batch and queue’ processing
- less inventory through the reduction of work-in-progress
- better use of people’s capabilities through problem solving and enhanced teamwork
- improved space utilisation is facilitated through the compact layout of equipment and less floor space dedicated to holding large queues of inventory
- equipment can be ‘right-sized’ (not using over-specified equipment as is common practice in batch and queue layouts where shared resources are the norm: multiple product/service lines are processed through the same equipment)
- flexibility is enhanced as one cross-trained person can potentially run an entire cell (due to close proximity of equipment) as opposed to the need to staff up individual departments fully, even during low demand periods.
The operation balance chart
The operation balance chart (see Figure 9.4) is used to analyse how well an operation is balanced against end user demand or takt time. This is a critical exercise when setting up cellular operations. The example process shown in Figure 9.4 identifies Process 3 as a potential bottleneck in the system. The takt time for the system is 70 seconds. Even though the process is just a couple of seconds above takt time remedial action is needed to reduce the cycle time at this process step. There are a number of options to do this, the most common being to analyse the process and remove non-value-added work to reduce the cycle time. Another option is to reallocate some of the work elements to other process steps that are below takt time. In reality workstations should be loaded to approximately 75–80% of takt time. When a resource approaches its maximum capacity rating there is an exponential growth in the length of queues due to its inability to absorb the variability of dependent events and natural variation. Anyone who has ever travelled home from work during rush hour traffic has experienced this phenomenon first hand. During quiet periods minor disruptions such as a car stalling at traffic lights for a few seconds have no overall effect on the performance of the network. However, if the network is close to its rated capacity the compounding effect of minor disturbances such as this has a domino effect and traffic jams grow exponentially.
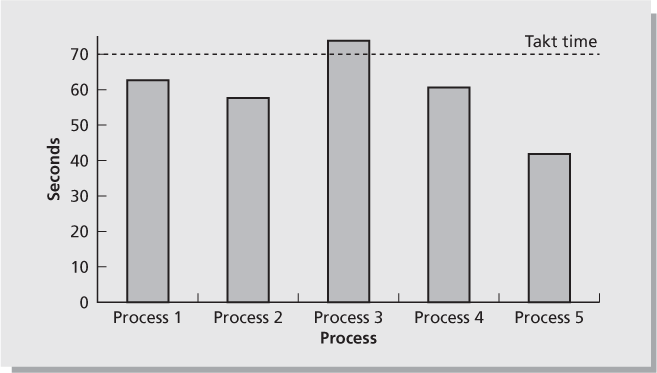
Figure 9.4 Operation balance chart
Human implications for flow
As mentioned at the beginning of the chapter the attainment of flow is dependent on many elements of the Lean system being in place to support it. A high degree of equipment reliability is required as disruptions and breakdowns will create havoc in a system where the excess fat has been removed. Excess fat refers to the various classifications of waste such as surplus inventory and extra overhead in the form of free capacity. People need to be developed and competent in Lean practices such as autonomous maintenance and problem solving. Support functions need to be decentralised to each value stream to provide the technical skills to maintain flow and solve process issues in a rapid fashion. It is recommended that support functions like engineering and maintenance are located on the frontlines (a concept known as co-location) rather than in offline office areas to facilitate the requirement for rapid team-based problem solving.
A critical enabling factor in the attainment of flow is to appoint a person who has end-to-end accountability for the delivery of a product or service through flow metrics like lead time and change-over performance. In the pre-Lean environment the organisational structure was composed of departments which were managed by individuals per speciality, such as the engineering manager, but this is no longer the most effective option. Each area looked out for its departments’ interests at the expense of achieving end-to-end flow. To compound this individual departments were often measured and rewarded in a fashion that hindered flow. An example of this would be metrics such as utilisation which demand that departments keep their machines and people busy so that the accounting department’s overhead absorption figures look positive. One outcome of this behaviour is that over-production is the end result and large batches of production slow down the overall system output. The appointment of a value stream manager who measures the end-to-end performance is an effective antidote to this cycle. Visual management maintenance by frontline people is another behavioural change that smoothes the swift end-to-end progression of the product or service delivery. Visual management tools such as hour-by-hour tracking maintain a steady sense of urgency and hasty response to problems. Entropy is continually at play in all systems, everything degrades without repeated intervention, and visual management enables this intimate focus on the process.
Flow practices review
Many of the benefits of flow are succinct and some are even counterintuitive, like slowing down one area in order to speed up the whole. Waste removal is just one-third of the potential savings that Lean can deliver; unevenness in demand and overburden are often forgotten! Heijunka is fundamental to eliminating these through its regulatory effect. Also very important is levelling out the demand on your people, equipment and suppliers. Heijunka prevents the bullwhip phenomenon in upstream processes and the supply chain via smooth, steady demand patterns. Quality problems can easily be found and corrected in a flow environment as the root cause trail is warmer than in batch and queue systems. Less facility space is needed, and tracking of inventory is greatly reduced if not eliminated. Almost by default equipment performance is also enforced at a high performance level to support a high velocity organisation. Flow is challenging and demands that people must be developed and grow to support it through high-priority problem solving and the resultant teamwork that this demands.
This chapter concludes Part II which covers the core methods and tools of Lean. The intention of Chapters 4 to 9 is to provide a working knowledge of the core Lean methods and tools that your organisation will require approximately 80% of the time throughout its Lean journey. There are other methods and tools covered in other ‘methods’ focused books that you can learn about if and when required.
The order of using the various methods is determined by the particular issues or opportunities that your organisation is facing. In the words of Dr Deming, ‘need must drive change’, so remember to tailor techniques to your organisation’s specific requirements.