
19
Understanding digital and Big Data
What you will learn in this chapter
- How to understand ‘Big Data’ and why it’s important
- How to create Customer and Business Insight that’s used not deleted
- How to appreciate your website as a powerful shop window from the user’s perspective
- How to understand why IT and Thinking Digitally is for everyone
It used to be that the ‘guys from IT’ were geeks who sat in darkened rooms by big computer servers. No more. These days, we are all in the business of data and knowledge, and almost all of us use our website as one of our main routes to market and ‘shop window’. Moreover, you won’t ‘get’ your customer, or the possibilities of today, unless you ‘get’ digital. The amount of data created today is truly astronomical. Indeed, experts claim that all the words ever spoken by humans up until 2003 equals 5 exabytes of data, the amount that is now created inside of 24 hours. It’s mind-boggling.1
In the digital age, everyone knows much more about what everyone else is doing, as the internet is totally traceable. Every website you visit, every link you click on, every transaction you complete, is recorded – with or without the users’ knowledge. If you can accurately trace this online activity and combine it with offline knowledge, you get a very compelling picture of how people behave. The implication for managers is clear: get digital or get dinosaured. This chapter explores the basics every manager needs to know.
Big Data, Little Data
Big Data, cited as one of the top ten trends by leaders such as Sir Martin Sorrell, is about taking the various sources of information a company has about its customers and bringing them all together in one place. If you have one source of data, say your credit card info, or your online shopping delivery, that is ‘Little Data’. ‘Big Data’ combines ‘structured data’ in databases with ‘unstructured data’, such as what you post on Facebook or websites you visit, and then mines them systematically for customer insights.
Big Data is changing the way we do business. Although customer information has long existed, it has tended to be in isolated pockets that did not connect to each other. People didn’t know which customers were buying which products, in which countries, and what motivated them to do so. Nor did they know much about these customers outside of their behaviour in their particular part of the customer’s world. Technology enables us to connect these databases and mine them for insight into customer behaviour. By using rapid a/b testing, predictive modelling and algorithms, you can create analytics that help to better understand and anticipate customer behaviour.
Big Data can be a force for good, but only if you harness it well. Few companies do that. And there are privacy concerns. Ultimately, most experts believe the consumer, not the company, is in control of the data, and most consumers are willing to give up their data only when they get something in return.2
I can honestly say that every success I’ve enjoyed over the years as a manager has been down to data. Back in the days of direct marketing on Pampers it might have been ‘Little Data’, but it was absolutely the same principle. Here are some more contemporary examples.
Troy Carter, manager for pop star Lady Gaga, related the following at the FT’s Innovation Conference in 2012. If a rock star is touring globally, there is typically a list of venues chosen for a few days round the world. Today, given the internet, the manager can identify which cities download her songs the most and plan the tour so that it stays longest there. He also works with downloader Spotify to see which songs in which areas are most popular, to help select the playlist for each gig. If he uses fans’ drawings on Facebook to design the tour T-shirts, merchandise sales increase 30 per cent. And by connecting the fans on Gaga’s social networks, he can get those in France talking with those in Korea using translation software in chat rooms.3 At a more modest level, a plumber in Manchester wants to put an ad in Yellow Pages. Using data mining, coupled with customer research, the Yellow Pages publisher can estimate the number of leads that plumber should receive, as well as the average job value, to calculate an estimated ROI from the ad. The plumber places the ad and is given a dedicated phone number and web micro site so he can actually track the number of leads received.
Tesco, one of the big data pioneers, began mining data using its Clubcard, and many attribute its meteoric rise to the world’s third largest retailer to its ground-breaking use of customer analytics. Big Data enabled Tesco to identify and nurture high-value customers. When store managers wanted to remove organic bread to make more room for baked beans, Tesco knew that those organic bread customers were buying more frequently and spending more per visit than others. Recently, Tesco could marry their Clubcard database and info with your Facebook profile. They could discover you love the colour blue in photos, and make sure they only send you emails in your favourite shade of blue.4
BSI wanted to know what benefits customers were gaining from audits beyond the audit certificate. By connecting the auditor’s reports and their customer satisfaction study they were able to produce a sophisticated benchmark report for their 70,000 audit customers which became a differentiator – as well as a source of potential leads for other products. Using the same metrics they could predict which customers were likely to lapse.
Experts recommend five steps for creating successful data plans, all of which tally with my own experience:
- Have a game plan for assembling and integrating data.
- Make sure you agree to use the best data available – otherwise you’ll lose months arguing over whether it’s accurate.
- Make sure you have the right talent that can master database design and analytics.
- Make use of advanced analytic models to try to predict customer and behaviour trends.
- Have easy-to-use tools and applications for managers and front-line users to understand.
Equally, we agree on three big planning challenges:
- Match the data agenda with the needs of the business and strategy – don’t go off and spend a fortune.
- Demonstrate real-life quick wins so colleagues buy into the programme.
- Ensure you focus on getting front-line users to use the data tools correctly and give them the capabilities to do so. Otherwise you’ll end up with garbage in/garbage out.5
Who owns the data? and the importance of the ‘golden record’
Pick a customer, say it’s John Smith of ABC Company. In most organisations, John will exist many times over as a separate data record. In some cases his first name will be present, in others it will be Mr Smith, or J. Smith. In some entries his company will be entered, perhaps as ABC Company, and in others it will be missing, or entered as A. B. C. Company. Because he is entered differently everywhere, no one will know that the different records refer to the same person, so the organisation misses opportunities to understand John’s buying habits and spending potential.
Many databases get choked up with invalid names, or multiple different entries. In one company I worked in, we supposedly had over 1 million ‘leads’ on the system. The only problem was, all but 150,000 of those leads were bad data. In one division of the same organisation, the sales team had a 90 per cent close rate – because they only entered customers into the system they had already signed.
The ‘golden record’ is one version of a data entry. One version of a customer’s name, title and contact details that is consistently used throughout the company. It is worth paying attention to those on the front line and rewarding them for correct entry.
To promote data quality:
- Establish who has ownership of the data and make them responsible for its quality.
- Establish a data governance policy and a data quality initiative. Any initiative should aim to be more than a piece of paper – people and processes need to be taken into account.6
- Use quality improvement methods such as Six Sigma.7
- Ensure everyone understands the importance of good-quality data, and the impact of poor-quality data on their ability to perform well.
- Build KPIs on correct data and monitor the performance of it frequently – and ensure successes are shared when data has been used well.
Business insight
Business insight is taking data and information and turning it into news you can use – whether it is information about your market, your competitor or your customers. Too often I see business insight generating reams of unwieldy reports and PowerPoint presentations that no one reads.
This is something that you can programme into your business insight team design. Ensure you focus your initial intelligence on real business issues: things the organisation wants and needs to know to achieve its strategic objectives. Make people ‘hungry’ for your outputs.
Share the design of any reports or tools that emerge from your intelligence. Allow internal customers and stakeholders to ask questions and make comments – ultimately, they must ‘act’ on your data, so unless they own it, it will be difficult to get any results from it.
Keep analytics simple, sharp and user friendly. They need to be actioned by busy sales people and customer service reps. Remember KISS (Keep It Simple, Stupid) definitely applies here.
There are four things you will always need to do:
- Gain commitment from senior management Creating business intelligence will have costs and resources implications. Also, make sure it has a commercial focus, and not just a technical one.
- Plan Business insight takes time and money. Data warehouses must be built, often enterprise systems upgraded. It’s important this is done in a methodical manner with clear objectives. Developing a research plan could be useful here. Start with the key questions you are trying to answer. Make sure they are business-relevant. If you are not sure, ask your key internal customers. If you cannot answer the question ‘What will we do with the answers from the research?’ then it’s not the right research!
- Analyse the information Information is of no use if it is not analysed and summarised effectively. Keep it short. Decide who the audience for the report is, and make sure it’s relevant. Include recommendations and suggested actions as well as key findings. Have a session or three to discuss and refine these with operational business people.
- Use the data to make actionable decisions If you can’t do this, then it’s useless information.
A guide to creating insight that’s used
- Start with the internal accounting system, especially sales analysis and customer records. Analyse your customer transactions over a period of time and reconcile each one back to your financial transactions. This will enable you to see who your biggest customers are and what they buy. Do this for each of your product lines, and major geographies. Then cross-compare. Look at average values and retention rates. Check industry sectors and business size. There is a wealth of information to be gained from this exercise. Because you are tying the data back to the financials it’s much more likely to gain acceptance.
- Other internal databases. Maybe you’ve got customer complaints databases. Or website hits, or downloads. Or content and social media sites. What trends and habits can you find when you correlate their transactions with other databases?
- Market intelligence. Once you’ve identified your key customers, and some of their behaviours, look to the broader market. What are the habits of your lead sector, who are the leaders there? Who are your main competitors? How are you and your customers positioned in the market?
- Market research. Once you’ve understood more about your customers, use research to get the rest of the answers. You can use online research to speed things up.
- Other information sources. Most organisations already hold, or have access to, 80 per cent of the information required for assessing their competitors. Do not overlook the importance of front-line staff as sources of information – they are likely to pick up all sorts of information through dealing with customers.
- Social media. Don’t forget your customers are people when they leave you. They may interact with lots of other internet and social media sites and organisations. The more you can link these up, the more you can understand about them.
IT is for everyone
It’s no longer possible for employees at any level to avoid the use of technology – and nor should they. From the use of multi-million-pound IT systems that make processes more efficient, to free social media tools that help us to promote brands, there are a huge number of technical tools at our disposal. Managers should select those digital tools that will help their organisation operate more effectively. You don’t need to know every technical detail but you do need to have enough knowledge to keep pace with the digital age and to encourage the use and development of IT.8
Try a reverse mentoring scheme, where younger people who are digital literates team up with tooled folk who are technology Luddites. Consider sending everyone on a ‘learn to code in a day’ course. The more you can demystify technology, the more you can benefit from it.
Your IT needs will vary hugely depending on the size of your organisation. Some investment in IT will often be required, but most businesses are not software developers. Apart from very large companies, it is advisable to use custom-made software packages rather than employ a team of in-house developers. It is so very easy to get bogged down and waste time and money developing your own solutions when you can use ‘off-the-shelf’ things that will work just as well. This is another reason to have IT as an integral part of your commercial team – it will militate against the tendency to develop everything ‘in-house’. Also, whatever new product or services your commercial folks are developing, chances are very high they will need IT time and support to pull it off. Integrating IT into your core commercial functions will ensure that people spend time thinking about the IT requirements their projects are generating.
In the 1990s, many organisations invested in IT systems in a bid to increase productivity. Nowadays, whilst there still may well be efficiency savings to be made by investing in IT, there are a number of other advantages of concentrating time, effort and money on your IT operation.
Visa gained market leadership in the payments platform by being a relentless adopter of technology to make payments simpler, safer and faster for customers and banks alike. Technology investments made a competitive difference. New technologies help to improve operating models, and, crucially, the selfsame technologies also make it possible to replicate improvements across the board. Indeed, manufacturing in the USA is being revitalised using high-tech solutions which, coupled with lower energy costs, are making it cheaper for firms to manufacture in-house than to outsource to countries like China and India.9
Who owns your web? It’s your first point of contact
Never underestimate the importance of your company’s website. It is estimated that 35–45 per cent of multichannel companies’ business comes through the web. Your website is an information tool, but increasingly it’s also your best source of leads and enables potential customers and stakeholders to engage with you wherever they are in the world. It is also a major source of revenue and cost savings, as you can engage with many people very efficiently online. The web drives disintermediation, which means it eliminates the middle man.
Many websites are not fit for purpose. They are overcrowded, complex and clunky. People throughout the company ask that their content is posted with no regard for how useful it will be for users. The site may be structured along internal company lines rather than the way the external users need to use it. It can be almost impossible to discern what a company does based on the site.
In one company I worked in, there were over 1,500 pages of content. And yet 90 per cent of the traffic went to just 7 per cent of the pages. In searching for the nearest store, the customer had to go through fifteen clicks – over 80 per cent of them dropped out. There were over 190 ways in which customers were urged to contact the company – with the result that less than half of those did. Almost half never made it past the home page. The site had been built from the company’s point of view, rather than from the users’ point of view. User-centric design means you build your site around the different types of users you know you will have and make it easy for them to find what they want. If you are a university, for example, a prospective student will want information on how to apply; a current student to sign up for a course; alumni will want to buy reunion tickets and so on.
Digital is everyone’s business: Management 2.0
Technology should not just be the preserve of the IT department. There needs to be recognition of the importance of IT throughout the organisation, including an understanding of how the use of technology affects the business.
There’s more. Does technology have the potential to reinvent management? A group of leading thinkers and practitioners, known as Management Innovation Exchange, or MIX, thinks the answer to that question is yes, and I would tend to agree. The problem is that much of management is still done in a pre-digital, Management 1.0, way. It’s based on slow-moving, inflexible, hierarchical organisations characterised by inertia, instrumentalism and disempowerment. The solution? Transparency, Collaboration, Meritocracy, Community, Speed and Agility – the same principles upon which the web is built. If we can apply these to organisations we can reinvent management for the better – welcome to Management 2.0! The data would tend to support them, in that, generally speaking, agile, community-based, collaborative organisations outperform those that aren’t. And are a lot more fun.10
Here are some ideas:
- Hire some digital entrepreneurs to get agile.
- Remember that flexible working can boost productivity.
- Embrace technology and the values of the web 2.0 and you will boost your managerial performance.
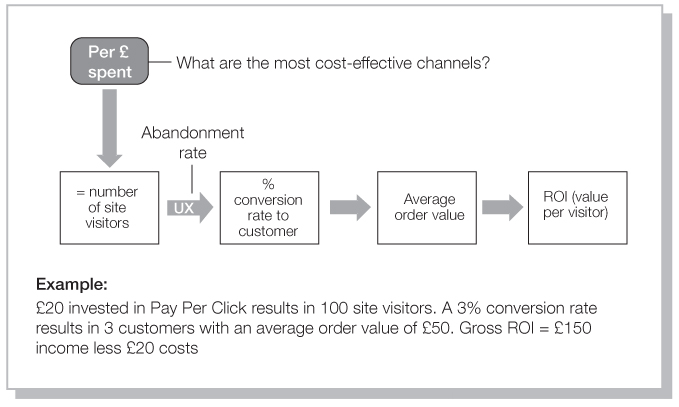
- Understand eCommerce metrics below (figure 19.1). How does your company’s website stack up? If you aren’t doing eCommerce, why not? Are you missing out on a vital route to market for your organisation?
Figure 19.1 eCommerce metrics
Top tips, pitfalls and takeaways
Top tips
- Always remain commercially focused: data is never an end in itself, and its use should be geared to tangible business goals.
- Combine data gathering with real insights, such as buying patterns over time and by geography, and other dynamics.
Top pitfalls
- Obsessing over data, rather than the underlying objective.
- Confusing data with real insights.
- Neglecting the website, and making it user-unfriendly
Top takeaways
- Big Data is having a transformational impact on the way in which businesses operate, especially in the areas of marketing and understanding customers.
- IT is something that everyone in the business has to understand, including a grasp of how it affects the business.
- Think about the user perspective. When you want more info from your customer, give them something in return – and respect their privacy!
1 Yates, Mick, CMI President’s Lecture, 7 May 2013.
2 Yates, Mick, dunnhumby Head of International, presentation at CMI President’s Lecture, 9 May 2013.
3 FT Innovation Conference 2012, interview with Troy Carter.
4 Yates, presentation at CMI President’s Lecture, 9 May 2013.
5 Biesdorf, S., Court, D. and Willmott, P., ‘Big data: what’s your plan?’, McKinsey Quarterly, no. 2, 2013.
6 O’Brien, T., ‘Poor data can cost you money and get you sued’, submitted for CMI’s Management Articles of the Year competition, 2012.
7 Stephen, M.K. and Kleiner, B.H., ‘Better data means better decisions’, Industrial Management, Vol. 53, no. 4, July 2011.
8 De Kare-Silver, M., e-shock 2020: How the Digital Technology Revolution is Changing Business and All our Lives, Palgrave Macmillan, 2011.
9 Time Magazine, 22 Apr. 2013, pp. 23–9.
10 MIX (Management Innovation Exchange) http://www.managementexchange.com/but