
18
Managing budgets and other financials
What you will learn in this chapter
- The basics of good budgeting and forecasting
- How to read a P&L in management accounts
- Popular financial measures you need to know
- Balance sheet basics
Unless you are a technology or design genius, you are unlikely to progress too far in management without a firm grasp of finance. The fact that 52 out of 100 FTSE CEOs are ex-CFOs or accountants should tell you something. (By the way, arguably this is why we have too much focus on cost cutting and short-term profits and not enough on growth, job creation and innovation – but that is another story.) My advice is to always lobby for ‘P&L’ (profit and loss) responsibility at some point in your career if you aspire to run something one day.
There are many great short courses and books on finance for non-financial managers – get one. This chapter cannot cover all aspects, but it describes some important disciplines, and explains why they matter. Remember: finance is your friend! It helps you to argue your case in terms that everyone understands and respects. My advice is to partner with your finance manager early in your career. You will benefit from his or her wisdom, and your partnership will help the finance colleague become more connected to the commercial and operational aspects of the organisation. It is win–win!
Budgets and forecasts
Managing a budget, like managing people and projects, is one of the fundamental tasks of management. A budget is a clear statement of income or revenue and expense for a given period, usually a year, broken down by month and quarter-years into targets and activity, such as projects or organisational departments. Learning how to forecast the income, keep track of the costs and project the margins are all key management skills.
One of the very first tasks a new brand assistant is given at P&G is managing the budget. You are told not to overspend under any circumstances. It creates a very good discipline early on about the need to set a realistic budget, and track expenditure against it. It also makes you feel responsible for the money being spent.
A basic budget looks like the example in Figure 18.1.
Figure 18.1 A basic budget sheet
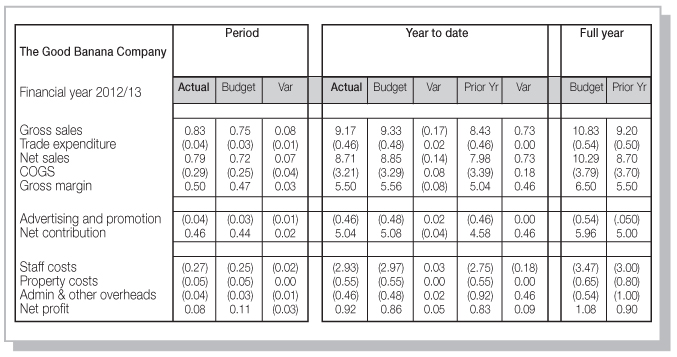
Review the budget on a monthly basis to identify the discrepancy between the forecast and the actual income and expenditure. When setting a budget, ensure you base it on a solid understanding of the facts when you are linking it to your strategy. Again, the SMART acronym is useful (Specific, Measurable, Achievable, Relevant and Time). For example, it is no use having a strategy that says you are going to double the sales of a particular product that is in a declining market segment, with no investment in innovation or sales; and even with such investment, it may not be feasible. Doing a thorough review of the business prior to budgeting allows you to analyse sales patterns and other dynamics. That is much better than arbitrarily setting numerical targets. Understanding how your budget can be broken down into market share, distribution points, number of customers and average value for customer gives you solid ground to stand upon and will boost your confidence and that of your team in your ability to deliver.
The typical method for preparing budgets is to look at last year and add or subtract something for expected growth or increase in costs or revenues. This is called incremental budgeting. Once you have prepared a base budget based on the trends of last year, it’s time to identify the initiatives you have to change those trends. You will need enough new projects to deliver more income. In the example in Figure 18.1, the base business is projected to decline by 2%, to £10 million, in line with the trend of the last five years. So in order to prevent that, the team has added in £500,000-worth of new initiatives which will deliver growth and take the budget to £10.5m. The same is true of costs. If the team decides they need to save £100,000, they will need a slate of projects in order to achieve the savings.
Usually it’s best to use a zero-base budgeting process, which means looking at what you actually need rather than what you currently spend. Sometimes it’s best to do the whole budget on this basis – expenditure that isn’t adding value can be diverted to new projects.
Forecasts
Financial forecasts help a business to budget for the year ahead. Make sure that you only have ‘one version of the truth’. It is important to understand who is responsible for a revenue or cost target and that this is transparent and agreed. I have witnessed unscrupulous managers deliberately obfuscate their forecasts so that their colleagues didn’t really know what was going on.
I have never been in a company that hit its forecast exactly; don’t let forecasting become an end in itself. In order to respond quickly to unforeseen events, you will need to introduce interim forecasts rather than relying on a yearly forecast. Most businesses will re-forecast two to four times a year, sometimes more.
The ten basics of good budgeting
- Link budgets to strategy Focus on the organisation’s objectives to consider how your budget needs to be changed. If you have a clear strategy, your budget should fall out of it as year one. In other words, the revenue, costs, profit and cash you generate in year one should be the annual budget plan. Equally, if your initiatives and projects are the right ones, your master plan will contain the main drivers of your budget in terms of changes to costs and revenues, and profits.
- Analyse and use data: the budget review Every year at P&G and Mars each brand and business unit did a thorough business review of what worked and what didn’t, based on a thorough analysis of past data; not just financial but market share, consumer research and other metrics. This analysis was expressed as a series of conclusions and recommendations for the coming year. This document was widely circulated. It forced everyone to use the same data in analysing and setting next year’s budget. It is a valuable discipline.
- Ensure you have growth or change initiatives to address the findings and recommendations of your budget review Analyse the trends. If segments have been declining at 10 per cent per year, it is unrealistic to expect them to suddenly turn around without a programme. It is best to forecast a continuation of trends in the market – perhaps even an acceleration of those trends if you are dealing with something systemic, like the switch from print to digital. Make sure your plans are tangible and credible: don’t set a budget that says we’ll double the product sales but do nothing differently. It may be necessary to spend today in order to make cost savings later – for example, by increasing your online presence.
- Line up revenue and costs It is vital that you can link revenues and costs in order to understand profit. Too often the revenues are set in one area and the costs in another department or area. Work with your business team to fully understand the linkages between the two. In the case of costs that cannot be clearly allocated, such as personnel working on different projects, agree a way of tracking them, such as percentage of sales. But look too at the activities of the people to ensure they are adding value. Your revenue should always equal more than your costs and grow at a higher rate than your costs. This simple rule is typically ignored in companies in trouble. It can help to set a financial shape – such as growing your revenues at twice the rate of your costs. For example, if your revenue, or topline, is growing at 6 per cent and your costs are growing at 3 per cent you will make more money. Conversely, if your revenue is growing at 3 per cent and your costs are growing at 6 per cent you will make less money. Simple!
- Focus on value-added spending Carefully examine the processes and practices which provide value for the organisation and the end user of your product or service. Only support projects and initiatives that can demonstrate a return on investment, either in monetary terms or in benefits. What adds value? Which elements of your business bring in more than they take out?
- Cut costs that don’t add value Once you have determined which areas create value and which don’t, you should then be in a position to see which areas are suitable to downscale or even eliminate. Take a strict approach to budgetary control and take hard decisions as to what can be cut. Identify the areas which are operating at a loss or don’t add value to the organisation or end user. Prioritise those things which are essential and consider whether the ‘nice-to-haves’ are viable to continue with. Ask for evidence that expenditures are efficient, deliver a return, are used by customers or add value in some way.
- Keep reserves for the unexpected No matter how carefully you plan your budget there will always be an event that is unplanned or even unprecedented. This could be an over-estimation of income or suppliers/clients failing to pay on time. Make allowances by allocating a reserve. Building a reserve or retained profit is imperative if you want the business to grow, re-investing it in order to move the company forward.
- Set a stretch target: fuel success and cap failure It’s good to encourage your colleagues to over-achieve without penalising them for missing their budget. If you set a realistic budget, make sure you also set a ‘stretch’ target. It is typically measured in extra income and/or profit. People often feel freer to get excited about a stretch target, as they know they won’t be penalised if they miss it, but rewarded if they achieve even half of it. In order to achieve your stretch, make sure you fuel the projects or initiatives that are working and starve those that are not. Too often people will try to fix everything.
- Set and measure Key Performance Indicators (KPIs) (see also Chapter 13). Understand and measure the key drivers of your business to see if you are on track. For example, in a media or membership business, retention rates – number of renewals – are a KPI. In a food business, it may be the market share and the return on assets, as factories are capital intensive. In a retail business, it may be the average transaction value, and the number of customers who actually buy something once they enter the store. Set your KPIs according to the truly make-or-break aspects of your business, and focus on those.
- Don’t turn budgeting into a cottage industry It is futile to engage in endless debates over numbers with nothing underpinning them. Challenge finance directors who are re-forecasting so frequently that everyone loses track of what the original commitment was. It results in employees spending their days re-calculating and reporting budgets rather than acting to deliver them. This is a very common mistake – especially in declining companies. It is a symptom of poor strategy and execution. (See Chapters 10–11.)
Profit and loss
The P&L, or profit and loss statement, shows the summarised trading activity during a stated period. Profit and loss statements are usually prepared monthly or quarterly for internal management purposes, and we are focusing on that version here rather than the annual report or accounting version. Figure 18.2 shows a typical P&L, alongside a series of measures to look at. It’s the same company whose budget we showed earlier.
Figure 18.2 A typical profit and loss statement
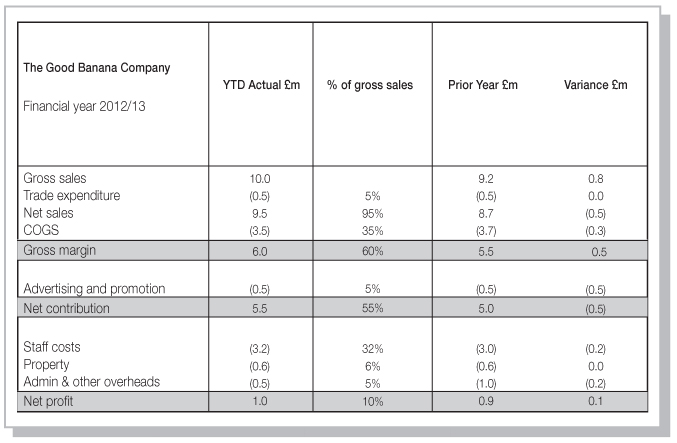
- Look at the trends In most profit and loss statements, figures for the current and previous year are given. Key figures for additional periods may be elsewhere in the accounts – for example three-year trends. Compare the last three years. Are sales up or down? Are costs up or down? If you compare the results figures to the budget for those years, you can see whether the targets set are being achieved.
- Operating profit – the profit/revenue or sales This is the fundamental profitability of the business without considering items like interest payments, sales of businesses or plant closures. It is profit on ordinary activities expressed as a percentage of turnover. It is useful to see how attractive the margins are in a certain category. For example, the margins in food and construction are generally lower than in beauty and technology companies. If it is done pre-interest tax and depreciation it is also called EBITDA (earnings before interest, taxes, depreciation and amortisation), or EBIT (earnings before interest and tax). EBITDA is commonly used to value a company that is for sale: the purchase price is expressed as a multiple of EBITDA.
- Cost of sales percentage This reveals the gross margin, which is the difference between turnover (and income) and the cost of goods or services produced or purchased (this is also called Cost of Goods Sold or Total Delivered Cost). Gross margins are affected by two things: the net sales price and the cost of producing or procuring the goods or services. If gross margins are low, it may mean that prices are being cut, or the costs of raw materials are rising, or manufacturing is inefficient. Gross margins also give you an idea of the attractiveness of a particular category. Technology companies typically have very high gross margins, as it costs little incrementally to produce the product once it is built. Conversely, if you are producing goods such as bread, gross margins are slim because raw material prices fluctuate and there is limited ability to charge more.
- Understand the difference between gross and net sales Often companies sell their goods and services through distribution channels. These channels get payments or deals for listing the products. It is important to understand how much a company is paying retailers or other distributors to list and promote its products. This can be a significant factor in reducing the value of gross sales. If the trade expenses are very high it could be a sign that there is more push (promotion) than pull (consumer or business demand).
- Check the discretionary amount spent on advertising, promotion and selling costs This will vary by category. In FMCG it will be in the double digits – between 10 and 20 per cent or higher; in business-to-business it will be much less – more like 2 to 5 per cent. Strong brands will invest more in advertising and promotion, and use this to drive growth, alongside constant innovation. In the digital world, many strong brands have emerged using much lower-cost marketing and selling techniques based on social media and word of mouth recommendations, helping to boost their operating margins. Advertising is almost always the first cut to be made when savings are needed. However, it is not always the wisest place, as many companies who promote during a downturn increase their market share.
- Look at the net contribution This is the amount of money a brand or product contributes to the overall company, expressed as a percentage. It includes the costs of marketing and making the product or service but excludes the fixed costs such as people and offices. The higher the net contribution, the higher the inherent profitability. If a net contribution is very high it means that that particular brand or division is subsidising less profitable brands or divisions. Sometimes that is deliberate – for example, companies may use highly profitable home markets to subsidise overseas expansion in the initial years. Similarly, profitable ‘cash cow’ brands and products are often used to subsidise newer, more innovative growth areas.
- Check overheads (sometimes called SG&A – selling, general and administration) This is the fixed cost of the salaries of all the staff involved, alongside rental costs, and the cost of stationery, travel, etc. It’s also one of the most common places to cut costs. These costs are often hard to allocate to specific products, which is why they are separated out from the other indirect costs such as advertising. Well-managed companies keep these at a minimum. I recall John Mars, the famous owner of Mars, explaining to me that he kept his overheads down at company HQ by never adding slots to the timecard holders on the wall where all employees had to clock in and out. Simple? Certainly. But very effective.
- Consider the overall financial shape and benchmark it against other companies and brands Although you will not have access to internal management accounts for competitors, basic data is available from annual reports. Use it to benchmark your P&L. Are you more or less profitable? Is your gross margin lower or higher? What about advertising and selling expenses? Overheads? Net margin?
Balance sheets
Balance sheets include the balance of every account in the accounting system, aggregating all P&L accounts. An accurate balance sheet provides a sound understanding of an organisation’s financial position at a given time. When compared with previous balance sheets, trends can be discerned. However, a balance sheet is a snapshot of the financial position, so it can quickly become out of date. Balance sheets must be prepared at the end of the company’s financial year, but they can be prepared for internal use as and when required.
The fundamental formula of balance sheets is that all of the assets of a company must be equal to its debts + equity. It means that all of the value of the company, its assets, as described as plant and equipment, inventory, cash and accounts receivable, are equal to its debts, both short and long term, plus the amount of shareholder equity.
Assets = liabilities + shareholder equity
One of the most useful measures on a balance sheet for managers is working capital. The management of working capital involves managing inventories, accounts receivable and payable, and cash. Efficient working capital means that you are collecting your debts on time and in full, that you are drawing out the payment period to your creditors (although not by so much that they go bankrupt) and that you are managing inventories efficiently.
Business financial measures you need to know
Here is a brief compendium of commonly-used financial measures.
Evaluating financial returns
There are various different financial measures for financial returns. In my experience, payback, NPV and IRR tend to be used for new launches, whilst ROI might be used for shorter-term investments. The main thing is to have a consistent measure across the organisation so that comparisons are valid.
Here’s a brief look at the most popular.
- Payback: This looks at the amount of time it takes for an investment to pay back its cost in terms of additional sales it generates. It is straightforward to calculate; however, it does not allow for the fact that different investments, such as a new brand, may generate revenue over a longer period than others. Neither does it account for the time value of money.
- Example: If investing in a sampling effort and a new machine costs £100,000 and generates £50,000 of new sales, it will pay back its cost in two years. So it has a two-year payback. Payback is often confused with break-even analysis – the break-even point is a point in time when total revenues equal total costs.
- ROI: Similar to payback, but ROI takes into account the incremental profit generated by the investment. It is very helpful for evaluating additional expenses in adding sales people or investing in marketing. However, it still doesn’t consider the time or value of money, or the total time frame of the investment.
- Return on Investment (ROI) = Gains from Investment – Cost of Investment/ Cost of Investment
- Example: You invest £1,000,000 in a marketing campaign you project will generate an extra £5 million in sales. You would be tempted to say it has an ROI of 500 per cent – that is, it returns 5x the initial investment. However, if you only make a 20 per cent margin on the £5 million, then your investment will only generate an extra £1 million in profit, so its ROI could be 1x the initial investment, or 100 per cent.
- Net Present Value (NPV): This looks at the cash flows generated by a project as well as the timing of those flows. NPV compares the value of cash invested today to the value of that same cash in the future, taking inflation and returns into account.
- Example: You buy a fruit shop to grow your fruit business. You look at the amount of cash it would take to buy the business (your outflows plus the amount invested in merging and supporting the business) versus the amount of cash you would take in (additional sales plus the amount of cash you could save by combining operations). You would then discount these cash flows over the time horizon of the investment – to account for the interest you would make on the cash if you invested it elsewhere. It might be five or ten years, as you would expect the shop to last that long. If the NPV of all the cash outflows and inflows is £600,000 and the fruit business costs £500,000, it would be a good deal. If it costs £750,000, you may balk and walk away.
- Internal Rate of Return: IRR also measures cash inflows versus outflows over the time horizon of an investment, and discounts these according to the time value of money and inflation. But rather than look at the value of the cash invested today, it looks at the rate of return the project generates over time. (In effect, the IRR is what will bring the Net Present Value to zero.) If that rate of return is higher than the company could get from the average cost of its capital (i.e. borrowing from a bank or other means of raising it), then it is a good project. If it is lower than the company’s cost of capital (sometimes called internal hurdle rate), then it’s not. Cost of capital varies, but is typically around 7 to 8 per cent.
Investor benchmarks
Investors use balance sheets to calculate financial ratios to benchmark a company’s performance. Here are some of the most popular:
- ROS: Return on Sales. The amount of profit a company makes on its total sales.
- ROE: Return on Equity. The amount of net income returned to shareholders divided by the total shareholders’ equity.
- ROE = Net income after tax/Shareholders’ equity.
- ROA: Return on Assets. This looks at the capital intensity of a business and how efficiently it uses its total assets to generate income. In manufacturing and heavy industries this figure will be low, because it requires huge capital investment. In software industries it will typically be higher.
- ROA = Net Income after tax/Total assets (or Average Total assets)
- ROCE: Return on Capital Employed. Measures efficiency and profitability of use of capital. It should always be higher than the rate at which the company borrows, otherwise shareholders’ earnings will be diluted.
- ROCE = Earnings before Tax/total assets – total liabilities.
- P/E ratio: Price–earnings ratio. This determines whether to invest in a given stock. It is the ratio of the market price per share over the earnings per share. It is also sometimes referred to as a ‘p/e multiple’. The higher the multiple, the more the market is willing to pay for the company’s earnings, because they think it will continue to outperform the market.
Note: a helpful glossary can be found at: investopedia.com/terms
Top tips, pitfalls and takeaways
Top tips
- Make the Finance Director your friend.
- Use key metrics such as Return on Investment and Net Present Value, but use them appropriately and be aware of the aspects that they don’t measure.
Top pitfall
- Subjecting budgeting and forecasts to too much revision, neglecting the actual business.
Top takeaway
- All managers should be financially literate, as this is the ultimate measure for commercial success and viability, and a business case must incorporate financial analysis and projection of returns.
- Know the ins and outs of building a budget and reading a P&L. Encourage benchmarking and a good understanding of the financial ‘shape’ of your business or organisation.